
National Cancer Registry, Cork
Harry Comber
Sandra Deady
Neil McCluskey
Linda Sharp
Northern Ireland Cancer Registry, Belfast
David Donnelly
Anna Gavin
University of Limerick
Avril Hegarty
Centre for Research in Environmental Epidemiology (CREAL), Barcelona
Anne-Elie Carsin
Published by
National Cancer Registry/Northern Ireland Cancer Registry
Cork/Belfast, 2011
This atlas should be cited as:
National Cancer Registry/Northern Ireland Cancer Registry
All-Ireland Cancer Atlas 1995-2007.
Cork/Belfast, 2011.
The analyses in this atlas are based on the high quality data collected, processed and quality assured by the dedicated staff of both registries. Without their work, this atlas, and all of our joint publications, would not have been possible. We would also like to thank the following for their help and support:
Other sources of data are referenced in the text as appropriate.
Ordnance Survey Ireland maps are reproduced under OSI Licence number NCRI/03/05. Unauthorised reproduction infringes Ordnance Survey Ireland and Government of Ireland copyright. All maps are © Ordnance Survey Ireland, 2011.
Northern Ireland maps are Crown Copyright and are reproduced with the permission of Land and Property Services under delegated authority from the Controller of Her Majesty’s Stationery Office, © Crown copyright and database rights NIMA MOU207.2.
The production of this atlas was primarily supported, through the two registries, by the Department of Health (Ireland) and Public Health Agency (Northern Ireland). We would also like to acknowledge the support of Queen’s University Belfast, University College Cork, University of Limerick and the Centre for Research in Environmental Epidemiology (CREAL), Barcelona.
Finally, we would like to thank the Ireland-Northern Ireland-National Cancer Institute Cancer Consortium for its continuing support of the cooperation between the two registries.
I welcome this first All-Ireland Cancer Atlas, which provides a unique insight into geographical variation in cancer on the island of Ireland. I congratulate both Registries on their ongoing collaboration in data harmonisation, analysis and reporting, which has done much to advance our understanding of cancer in Ireland. The continuing partnership between the Registries shows the benefits of the NCI/Ireland/N. Ireland Consortium, a fundamental aim of which is to promote joint research of this kind.
This atlas provides new insights into cancer risk in Ireland and highlights the extent to which effective prevention could reduce the cancer burden in Ireland. It also poses some difficult questions with regard to unexplained variations in incidence and the role of socio-economic status in determining cancer risk. These are matters we need to understand better and the recommendations made for further study must be taken seriously by the Departments of Health in both jurisdictions.
This report shows yet again that improving public health requires high quality information and that, in cancer registries, we have a powerful, and almost unique, mechanism for providing this data both nationally and internationally.
I would like to pay a particular tribute to the Directors of each Registry, Dr Harry Comber and Dr Anna Gavin. This report, and the excellent collaboration upon which it depends, would not have come about without their committed and sustained leadership and vision over many years.
Dr Tony Holohan, Chief Medical Officer, Republic of Ireland.
Cancer poses a significant present and future public health challenge.
In our efforts to control and prevent cancer at a population level it is essential that we continue to develop the evidence, ensuring through research that we continue to strive to understand the variation in cancer incidence, the implications for preventative strategies and the potential to identify new contributory factors.
This report, the latest manifestation of the collaboration between the cancer Registries in Northern Ireland and the Republic of Ireland, provides a most valuable overview of cancer distribution. It describes the geographical distribution of some of the commonest cancers, highlighting the variation in the incidence of a range of cancers. Whilst much of the variation in modifiable cancer burden is already known, this variation poses many questions that both policy makers and researchers alike will need to study and fully consider. I am confident that this report will make a significant contribution to our growing understanding of cancer prevention with the potential to make a real impact in reducing cancer risk. I commend the work of all those who have been involved in contributing to its development and especially recognise the debt of gratitude to all of those who lived and are living with cancer whose data is included in the report.
Dr Michael McBride, Chief Medical Officer, Northern Ireland.
The National Cancer Registry and Northern Ireland Cancer Registry have, since the early 1990s collected information on cancers diagnosed on the island of Ireland. The registries have collaborated on three all-Ireland cancer reports and several research projects. This is the first atlas to be produced as a result of this collaboration.
The aims of this atlas were:
This atlas combines cancer incidence data for the years 1995 to 2007 inclusive, at the smallest geographical level available (ward and electoral division (ED)), for Northern Ireland (NI) and the Republic of Ireland (RoI). This data has been analysed in two ways
The risk of developing many of the cancers presented here was higher in RoI than in NI. The risk of non-melanoma skin cancer, melanoma, leukaemia, bladder, pancreas and brain/central nervous system cancers was significantly higher for both sexes in RoI. For men, the risk of prostate cancer was higher in RoI and, for women, cancer of the oesophagus and cervix. In NI, the risk of lung cancer was higher for both sexes as was that among women for non-Hodgkin’s lymphoma, head and neck cancers and cancer of the uterus. Overall, the relationships between socio-economic variables and cancer risk were similar for men and women. Patterns consistent with known socio-economic gradients were seen—lung, stomach, head and neck and cervical cancers were all more common in areas of higher unemployment and/or lower levels of degree attainment, while non-melanoma skin cancer, female breast cancer, prostate cancer and melanoma were less common. Most cancers were also more frequent in urban areas (as measured by population density); only prostate cancer was more common in rural areas.
Mapping also demonstrated broadly similar geographical patterns for men and women for most cancers. However, apart from this, there was little consistency between different cancer sites in the geographical distribution of risk. There was a marked geographical variation in the risk of some common cancers—non-melanoma skin, lung, prostate and stomach, but very little for others—breast, colorectal, non-Hodgkin’s lymphoma. The most consistent geographical distribution of cancer risk was seen for three cancers (pancreas, brain/central nervous system and leukaemia) which showed an increasing gradient of risk from north-east to south-west.
Eighteen cancer sites were studied, and the results are described in more detail below, in order of cancer frequency.
Non melanoma skin cancer
Non-melanoma skin cancer was 18% commoner in women and 15% commoner in men in RoI than in NI. The risk was higher in more affluent areas, in areas with high levels of elderly living alone, in more densely populated districts and in coastal and urban areas.
Breast cancer
There was no statistically significant difference in female breast cancer risk between RoI and NI. Risk increased with increased population density and affluence. Geographical patterns changed over time, reflecting the introduction of breast screening in RoI in 2000. During 2002-2007, higher rates were seen in the east of RoI (where screening had begun) than in the west (where it had not).
Colorectal cancer
There was no statistically significant difference in colorectal cancer risk between RoI and NI. Increased risk was associated with increasing population density for both sexes and with unemployment for men only. There were areas of higher risk around Cork and from Donegal to Down.
Lung cancer
The risk of lung cancer was significantly higher in NI than RoI for both men (by 11%) and women (by 7%). Increased risk was associated with increased population density, unemployment and low levels of education and was highest in urban areas of Belfast, Dublin, Derry and Cork, and also in Louth, Kildare, Carlow and Wicklow.
Prostate cancer
The risk of diagnosis of prostate cancer was 29% lower in NI than RoI. Men in areas with the highest educational attainment had the highest risk. The risk was highest in the south and east of Ireland during 1995-2001 and in the west and north of RoI during 2002-2007.
Non-Hodgkin’s lymphoma (NHL)
There was no significant difference in risk between NI and RoI for men but the risk for women was 14% higher in NI. There was no association between NHL risk and population density or socio-economic factors. The highest risk for men was in the north-east, and in Kerry and Galway and in the north-east and Dublin for women.
Stomach cancer
Stomach cancer risk was higher in areas of high population density and in those with high unemployment and lower educational attainment. There was a strong geographical pattern, with higher risk in a band running from Dublin to Donegal, excluding the north-east, but including Belfast.
Melanoma of the skin
Melanoma risk was lower in NI than RoI for both men (by 8%) and women (by 14%). Risk was not associated with population density; but was associated, for both men and women, with low unemployment and high educational attainment, and was highest in coastal areas in the south and east of Ireland.
Bladder cancer
Bladder cancer risk was lower in NI for men (by 8%) and for women (by 14%) than in RoI and increased with population density (for both sexes) and unemployment (men only). Male geographical patterns were distinctive, with increased risks from Louth to Wicklow, including Dublin city, and also in Donegal, North Down and Ards. For women, there was an area of higher risk in the south-west.
Head and neck cancer
The risk of head and neck cancer was greater, by 21%, for women in NI compared to RoI but there was no statistically significant difference for men. The risk increased with increased population density and unemployment but not with educational attainment. There was no clear geographical pattern for men, but for women there was one large area of higher relative risk stretching north-westwards in a line between Dublin and Sligo.
Leukaemia
The risk of leukaemia was lower in NI than in RoI, by 23% for men and 17% for women. There was no association with population density, employment or educational attainment. Mapping showed an increasing gradient of increasing risk from north-east to south-west, more pronounced in men.
Pancreatic cancer
Pancreatic cancer risk was lower in NI than in RoI, by 11% in men and 22% in women. Increased risk was associated with higher unemployment, but only for men. In women the risk increased with decreasing levels of educational attainment. There was a gradient across the island, with increased risk in the south-west and lowest in north-east; this pattern was more marked in women than men.
Kidney cancer
There was no statistically significant difference in risk between NI and RoI and no association with either population density or socio-economic factors. The area of highest risk was mainly in Leinster, with a lower relative risk in the west.
Oesophageal cancer
The risk was 8% lower in NI than RoI for women but there was no statistically significant difference for men. Risk increased with increasing population density for both sexes but there was no association with unemployment or educational attainment. The area of highest risk was south of a line from Dublin to Kerry, with areas of low risk in the north-west.
Ovarian cancer
There was no association with country, population density or socio-economic factors. The areas of highest risk were around Cork city, extending more widely across most of Munster and also in the eastern half of NI, excluding parts of Down and Belfast.
Brain and other central nervous system (CNS) cancers
The risk of brain and other CNS cancer was lower in NI than RoI, by 10% for men and 20% for women. There was a weak positive association with population density for women only, and no association with socio-economic variables for either sex. There was a strong geographical pattern, with the highest risk in the south-west and lowest risk in the north-east.
Cancer of the corpus uteri
The risk of cancer of corpus uteri was higher by 11% in NI than in RoI. There was no significant association with population density or socio-economic variables. Higher risk was noted in Connacht, most of Northern Ireland and parts of Munster.
Cancer of the cervix uteri
The risk of cancer of the cervix was significantly higher, by 11%, in RoI than NI and increased with increasing population density, unemployment and poor educational attainment. The areas of highest risk were around Dublin, extending to Wexford and the midlands. Areas around Cork, Waterford, Belfast and Sligo also had higher risk.
This atlas shows major variations, sometimes more than two-fold, in the risk of several cancers, across the island. For many cancers, we found a strong relationship between markers of socio-economic status and cancer risk, sometimes positive, sometimes negative. These socio-economic relationships were more consistent than the broad geographical patterns identified by mapping. Few of the geographical patterns could be satisfactorily explained by the available data on risk factors, although we did see some correlations between smoking prevalence and smoking-related cancers.
Some differences in relative risk appeared to be attributable to health service provision—higher levels of breast screening in NI in the 1990s; more prostate specific antigen testing in RoI. For a few cancers, the more demand-led service in RoI may lead to more case-finding and an apparently higher overall cancer risk, as seen in its most extreme form for prostate cancer.
We were struck by the relative paucity of comparable information on established cancer risk factors at individual, small area or national level in both countries. Sources of data are fragmented and often either unavailable or not published. Understanding the reasons for geographical variation, and taking appropriate action, would reduce the cancer burden significantly in Ireland. We hope that this atlas will serve as a stimulus and raw material for detailed studies which will explore and answer some of the questions it poses.
The cancer registries in Northern Ireland and the Republic of Ireland became operational almost simultaneously in 1993-1994, and quickly built up a strong collaborative relationship. The collaboration has been manifest in three all-Ireland cancer incidence reports, numerous joint peer-reviewed publications, several joint research projects and extensive informal exchanges of information, expertise and support. This relationship was recognised at the establishment of the NCI-Ireland-Northern Ireland Cancer Consortium by the creation of a Cancer Registries Group, later to become the Cancer Registries and Epidemiology Group. Both registries realise that, on a small island, there is much potential in working together and in sharing our links with the UK and the rest of Europe.
This atlas is the latest fruit of our collaboration. Building on earlier work which produced an atlas of cancer in the Republic of Ireland, this document has been produced by a team of statisticians, epidemiologists and GIS specialists on both sides of the border. Carrying out the analysis has posed some challenges because of the different nature of the small geographical areas available for analysis and the incompatibility of almost all census measures of socio-economic status between the two countries. However, despite these limitations, this atlas gives, for the first time, an overview of the distribution of cancer risk across the island of Ireland.
The aims of this atlas were:
Geographical variation in cancer risk has been a subject of fruitful research since cancer registration began in the 1940s. Although often posing questions rather than providing answers, inspection of geographical patterns and their variation between cancer types and over time can give valuable indications of the likely cancer risks and their distribution in our populations. Sometimes, too, examination of this variation can lead to the discovery of new aetiological agents. Within a relatively homogeneous population such as Ireland’s, genetic variation is an unlikely reason for geographical differences in cancer risk, and most must be attributed to modifiable factors of some sort. The majority of variation in modifiable cancer burden is known to be due to four “lifestyle” factors—tobacco, diet, alcohol and sexual/reproductive life (Doll and Peto, 1981). Much less of the risk appears to be attributable to what are commonly called “environmental” factors—radiation exposure, carcinogens in water, air and food, and other external causes. In explaining the variations seen, we therefore need to look closely at people as well as places, and in this atlas we have provided analyses of the personal characteristics, insofar as we could measure them, of people living in low- and high-risk areas.
This atlas describes the geographical distribution of the 18 commonest cancers in two ways—through statistical analysis of the variation of cancer risk by characteristics of small areas of residence (electoral division in the Republic of Ireland and ward in Northern Ireland) and in smoothed maps of relative risk for the small geographical units. Each cancer has been assigned a separate chapter, which gives a general summary of the incidence data for the cancer, international comparative incidence rate, risk factors, analysis by small area characteristics and smoothed maps of relative risk. The chapters are ordered by the frequency of occurrence of the cancers—most frequent first.
The statistical analyses describe models of cancer risk at small area level based on the socio-demographic characteristics of the areas—unemployment, education, rurality etc. Implicit in the models is the hypothesis that the characteristics of the small areas are related in some way to those of the individuals living in them. We have explored the strengths and limitations of this approach (Cook et al., 2000) in the previous atlas of the Republic of Ireland (Carsin et al, 2009).
Mapping of cancer risk at small area level, particularly when smoothing techniques are used, as they are in this atlas, is based on the assumption that populations living in adjacent areas are likely to share the same risk factors, and therefore have similar underlying risks of cancer. This hypothesis suggests that most of the variation in cancer incidence between small areas is due to random variation and that by smoothing this variation over larger areas we can arrive at a better estimate of true cancer risk. However, while maps may give a valuable overview of cancer distribution, in one respect they may be deceptive. The majority of the Irish population, north and south, is urban, and living in a few cities of relatively small area, which are inconspicuous on the maps. On the other hand, large areas of the country, particularly in the west and north-west, are sparsely populated but very visible on the map. As a result, the appearance of the maps tends to be dominated by risk in the rural population, while the analyses by socio-economic and demographic area characteristics mainly represent the urban population. The two approaches are complementary.
We hope that this atlas is a beginning, rather than just an end in itself, and that the many questions raised by our analyses will stimulate studies which can make a real impact on understanding, and ultimately reducing, cancer risk in Ireland.
From the Republic of Ireland perspective, the island of Ireland, and the country comprising most of its area, are both officially known as “Ireland”, while in Northern Ireland there is no universally agreed terminology for the different geographic bodies in the island of Ireland. As this is certain to cause confusion in an atlas of this kind, we have elected to use the expressions “Republic of Ireland (RoI)” and “Northern Ireland (NI)” for the two jurisdictions on the island and to refer to both of these areas as “countries”. The combined area of the whole island (and the offshore islands) is referred to in the text simply as “Ireland”. None of this implies anything concerning the official status of these names.
For administrative purposes, RoI is divided into 27 counties (including Tipperary North and South) (Map 2.1). Counties with large urban areas are further divided into “city” and “county” areas (three of the latter in the case of Dublin), giving a total of 34 large administrative areas. Small area population statistics are available at the level of electoral division (ED), of which there are approximately 3,500.
NI has six counties and is also divided into 26 district councils—four city councils (Armagh, Belfast, Derry and Lisburn), 13 Borough Councils and 9 District Councils (Map 2.1). Small area population statistics are available at the level of ward, of which there are approximately 580. District councils in NI therefore have smaller populations on average than counties in RoI, while NI wards have an average population size greater than RoI electoral divisions (see section 2.2.4). Mapping and statistical analysis in this atlas is based almost exclusively on data at the ward/ED level.
A number of other geographical entities are also referred to in the atlas—these include health board areas, health service regions, provinces and planning regions. These are described in Appendix table A4.1.
Map 2.2 shows, for reference, the outlines of counties in RoI and District Councils in NI with some towns and cities.
Map 2.1 Counties and district councils

Map 2.2 Locations

The Northern Ireland Cancer Registry (NICR) was established in 1994 and uses an automated computer system with multiple information sources to collate information on new diagnoses of cancer. Information has been collected for incidence years from 1993 onwards. The three main sources for registration are the Patient Administration System (PAS) used by all the Hospital Trusts, histopathology reports, and death notifications supplied by the General Register Office (GRO). From PAS the Registry obtains demographic information on individual patients along with basic site and behaviour information for each tumour. This information is supplemented by electronic downloads from histopathology and cytopathology laboratories. A major focus of the Registry’s operation is on the verification of the information from a single hospital admission, a single histopathology report or a single death certificate (death-certificate initiated cases). Trained Tumour Verification Officers (TVOs) examine general practitioners’ (GPs) notes for patients who have died from cancer, hospital records for cases identified without histopathology or cytology confirmation and histopathology reports where there is conflicting information or other possible errors. In the event that no further information on death-certificate initiated cases is obtainable the record is included in the Registry but flagged as a death certificate only (DCO) case. These comprised less than 2% of cases in 1995-2007. Follow up of patients is conducted passively by linking cancer incidence data to death certificate information.
In the NICR the information on cancer site received by the Registry has been coded using the Systematized Nomenclature of Medicine (SNOMED) which is used in the UK National Health Service (NHS) and information on cancer morphology has been coded to the second revision of the International Classification of Diseases for Oncology (ICD-O-2) (World Health Organisation, 1990). Cancer site is recoded at the Registry to the tenth revision of the International Classification of Diseases (ICD-10) (World Health Organisation, 1997).
The National Cancer Registry Ireland was established in 1991 and has produced national figures on cancer incidence since 1994. Most registrations are based on “active” data collection, whereby trained Cancer Data Registrars (CDRs), based in hospitals around the country, access a range of data sources to identify all new cancer cases and register all relevant patient, tumour and treatment details. Hospital pathology reports, provided to the Registry shortly after diagnosis, comprise the bulk of information, providing data on approximately 85% of all new cases. Most pathology reports are registered manually by the CDRs but about 10% of pathology reports are now provided in electronic format. Information on non-microscopically diagnosed cases is registered mainly from other hospital sources, principally the Hospital Inpatient Enquiry system (HIPE) as well as records from radiology and oncology departments, medical charts, etc. Most cases (≥95%) are registered in this way. The main non-hospital source of case information is death certificate data. The Registry is provided with all death certificates by the Central Statistics Office (CSO). All cases initially notified by death certificate are followed up with the hospital of death or the certifying doctor and most cases are subsequently found in other data sources. Only a small percentage of cases (<3%) remain classified as notified by death certificate only (DCO). As in the NICR, follow up of patients is passive, where cancer cases are linked to death certificate information provided regularly from the CSO.
Although case data from pathology reports is registered almost immediately after diagnosis, data from other sources can take longer to obtain. Together with essential case checking and data quality assurance, the Registry normally produces definitive statistics for case data a minimum of 18 months to 2 years following the end of year of diagnosis. Currently the completeness of cancer registration for all invasive cancers diagnosed to end 2007 is estimated to be over 96%.
Incident cases are coded according to the third edition of the International Classification of Diseases for Oncology (ICD-O-3) (World Health Organisation, 2000).
Before analysis, data on cases diagnosed 1995-2007 were recoded to the equivalent ICD-10 classification in both registries. Cases were extracted from both registry datasets, based on ICD-10 codes, and data from Northern Ireland (NICR) and Republic of Ireland (National Cancer Registry) were then amalgamated into a single dataset. Table 2.1 lists the 18 cancer sites analysed, with the relevant ICD-10 codes and total number of cancers in RoI and NI. Data from both registries have previously been used in three joint all-Ireland incidence reports—further information on data comparability and quality is provided in Donnelly et al., 2009. Multiple primary cancers were excluded in the calculation of incidence figures, based upon the rules published by the International Agency for Research on Cancer (IARC) (Ferlay et al., 2005). Death certificate only registrations were also excluded. For all cancers, maps are based on the incidence period 1995-2007. For breast and prostate cancers additional analysis was carried out, and maps produced, for the periods 1995-2001 and 2002-2007 separately because of the introduction of mammographic screening in RoI in 2000, and striking temporal trends in both countries in both prostate cancer incidence and prostate-specific antigen testing (Carsin et al., 2010).
Table 2.1 Incident cancers diagnosed 1995-2007 included in this report: Republic of Ireland (RoI) and Northern Ireland (NI)
cancer site | ICD-10 codes | Ireland | RoI | NI | |||
females | males | females | males | females | males | ||
|---|---|---|---|---|---|---|---|
non-melanoma skin cancer | C44 | 49,102 | 55,826 | 34,655 | 40,034 | 14,447 | 15,792 |
breast | C50 | 38,545 | *254 | 25,876 | *181 | 12,669 | *73 |
colorectal | C18-C21 | 16,992 | 21,205 | 11,041 | 14,485 | 5,951 | 6,720 |
lung | C34 | 13,005 | 20,831 | 8,437 | 13,672 | 4,568 | 7,159 |
prostate | C61 | — | 33,144 | — | 24,704 | — | 8,440 |
non-Hodgkin's lymphoma | C82-C85 | 4,605 | 5,094 | 2,917 | 3,441 | 1,688 | 1,653 |
stomach | C16 | 3,616 | 5,748 | 2,353 | 3,818 | 1,263 | 1,930 |
melanoma of the skin | C43 | 5,467 | 3,702 | 3,871 | 2,611 | 1,596 | 1,091 |
bladder | C67 | 2,513 | 6,226 | 1,730 | 4,309 | 783 | 1,917 |
head and neck | C01-C14,C30-C32 | 2,211 | 5,692 | 1,371 | 3,820 | 840 | 1,872 |
leukaemia | C91-C95 | 3,164 | 4,527 | 2,235 | 3,331 | 929 | 1,196 |
pancreas | C25 | 3,533 | 3,502 | 2,499 | 2,454 | 1,034 | 1,048 |
kidney | C64-C65 | 2,450 | 4,032 | 1,603 | 2,785 | 847 | 1,247 |
oesophagus | C15 | 2,370 | 3,907 | 1,592 | 2,627 | 778 | 1,280 |
ovary | C56 | 6,222 | — | 4,149 | — | 2,073 | — |
brain and other central nervous system | C70-C72 | 2,266 | 3,041 | 1,630 | 2,161 | 636 | 880 |
corpus uteri | C54 | 5,237 | — | 3,355 | — | 1,882 | — |
cervix uteri | C53 | 3,758 | — | 2,665 | — | 1,093 | — |
* Since breast cancer in males is rare, most of the analyses in chapter 4 are limited to breast cancer in women.
Apart from its obvious use in mapping, geocoding of cancer cases allows linkage to area-based data, such as population density and measures of socio-economic status (e.g. percentage unemployed). This is described in more detail in sections 2.2.4.2 and 2.2.4.3. This type of information is not, in general, accessible at the level of the individual cancer case in Ireland, and has to be inferred from area-based measures.
NICR routinely collects address information for registered cancers, allowing small geographic areas to be assigned to individual cancer registrations. This is accomplished through an electronic process which uses the postcode that accompanies the majority of NI addresses along with a postcode-to-electoral ward lookup file known as the Central Postcode Directory (CPD). This is maintained by the Northern Ireland Statistics and Research Agency (NISRA) and updated annually (Northern Ireland Statistics and Research Agency, 2010a). Addresses with an unknown, incomplete or invalid postcode cannot be assigned an electoral ward.
The National Cancer Registry attempts to code all addresses of cancer cases to the level of electoral division (ED), the smallest area for which census data can be obtained. Unlike NI, addresses in RoI do not have postcodes. Each address is therefore assigned to an ED by means of matching Registry address information to other data sources. This process of geocoding is carried out for the most part by matching Registry patient address data to the GeoDirectory database which provides a list of official postal addresses and location details for every residential and commercial property in the country (www.geodirectory.ie [1]). Data matching is carried out using software developed by the Registry, with some manual coding for any remaining unmatched records. Additional resources used include address tables from census surveys, supplied by the Central Statistics Office (CSO), as well as manually locating addresses on maps provided by Ordnance Survey Ireland (OSI). Using a combination of these resources, almost all complete patient addresses can be assigned to a particular ED.
For some cases it is impossible to assign an address confidently to a single ED, usually because the address is incomplete or ambiguous (4.4% of all RoI cancers included in this report; Table 2.2). The number of EDs to which the address could potentially belong is usually small (2 or 3) and, for analysis, these cases were assigned at random to one of the possible EDs, with the possibility of assignment weighted by the population of the alternative EDs.
At the end of the geocoding process, a number of registrations in both RoI and NI remained which could not be assigned to any ED/ward (3.3% of all cancers included in this report; 3.6% in RoI and 2.7% in NI) (Table 2.2). For these registrations, a fraction of the cases of each cancer type was allocated in proportion to each ED (RoI) or ward (NI) weighted by population. In NI almost all of these cases were non-melanoma skin cancers, but in RoI all cancer sites had a similar percentage of cases with unknown ED.
Table 2.2 Number and percentage of cases not assigned to an ED or ward, and of cases assigned to multiple EDs
cancer site | cases assigned to more than one ED (RoI only) | cancer cases not assigned to an ED or ward | |||||||
|---|---|---|---|---|---|---|---|---|---|
|
|
| Ireland | RoI | NI | ||||
number | % RoI cases | % all cases | number | % | number | % | number | % | |
non-melanoma skin cancer | 3443 | 4.6% | 3.3% | 4896 | 4.7% | 2803 | 3.8% | 2093 | 6.9% |
breast | 1045 | 4.0% | 2.7% | 948 | 2.4% | 839 | 3.2% | 109 | 0.9% |
colorectal | 1136 | 4.5% | 3.0% | 985 | 2.6% | 885 | 3.5% | 100 | 0.8% |
lung | 783 | 3.5% | 2.3% | 808 | 2.4% | 749 | 3.4% | 59 | 0.5% |
prostate | 1282 | 5.2% | 3.9% | 1128 | 3.4% | 983 | 4.0% | 145 | 1.7% |
non-Hodgkin's lymphoma | 270 | 4.2% | 2.8% | 305 | 3.1% | 254 | 4.0% | 51 | 1.5% |
stomach | 256 | 4.1% | 2.7% | 270 | 2.9% | 250 | 4.1% | 20 | 0.6% |
melanoma of the skin | 280 | 4.3% | 3.1% | 365 | 4.0% | 281 | 4.3% | 84 | 3.1% |
bladder | 248 | 4.1% | 2.8% | 222 | 2.5% | 208 | 3.4% | 14 | 0.5% |
head and neck | 199 | 3.8% | 2.5% | 190 | 2.4% | 168 | 3.2% | 22 | 0.8% |
leukaemia | 258 | 4.6% | 3.4% | 247 | 3.2% | 230 | 4.1% | 17 | 0.8% |
pancreas | 243 | 4.9% | 3.5% | 173 | 2.5% | 164 | 3.3% | 9 | 0.4% |
kidney | 205 | 4.7% | 3.2% | 129 | 2.0% | 120 | 2.7% | 9 | 0.4% |
oesophagus | 203 | 4.8% | 3.2% | 169 | 2.7% | 151 | 3.6% | 18 | 0.9% |
ovary | 183 | 4.4% | 2.9% | 165 | 2.7% | 154 | 3.7% | 11 | 0.5% |
brain and other central nervous system | 168 | 4.4% | 3.2% | 155 | 2.9% | 150 | 4.0% | 5 | 0.3% |
corpus uteri | 129 | 3.8% | 2.5% | 133 | 2.5% | 113 | 3.4% | 20 | 1.1% |
cervix uteri | 75 | 2.8% | 2.0% | 90 | 2.4% | 81 | 3.0% | 9 | 0.8% |
all cancers in this report | 10406 | 4.4% | 3.0% | 11378 | 3.3% | 8583 | 3.6% | 2795 | 2.7% |
A census of population was carried out in NI in 2001, the only census between 1995 and 2007. This census provided population data, broken down by sex and age, for 582 wards in 26 district councils. Population estimates for each year were available by sex and age at district council level. Annual estimates for the wards were derived from these total annual estimates, using the 2001 census as the basis for the splits by ward. The estimates for each year were then averaged to give an estimated average population by ward for the 1995-2007 period. Over this period the wards had an average population of 2,913, ranging from 784 (Bushmills, Moyle) to 9,654 (Botanic, Belfast) (Table 2.3, Figure 2.1).
Table 2.3 Population distribution of NI wards and RoI EDs
number of areas | mean population | standard error of mean | standard deviation | minimum population | 25th percentile | median | 75th percentile | maximum population | |
NI wards | 582 | 2913 | 48 | 1147 | 784 | 2219 | 2618 | 3238 | 9654 |
RoI EDs | 3355 | 1161 | 34 | 1956 | 62 | 309 | 525 | 1146 | 33983 |
Figure 2.1 Population distribution of NI wards and RoI EDs
RoI | |
 |  |
Three censuses were carried out in RoI during the period of this report, in 1996, 2002 and 2006. These censuses provided population data, broken down by sex and age, for 3,422 EDs in 1996 and 2002, and for 3,409 EDs in 2006. Population data were derived from the census small area population statistics (SAPS) files for 1996, 2002 and 2006. Official CSO estimates of the total population split by sex and age (but not by ED) were available for each year from 1995 to 2007. Annual estimates for the EDs were derived from the appropriate census and the CSO total annual estimates–the 1996 census results were used as the basis for the ED populations for 1995, a linear interpolation of the 1996 and 2002 census counts was used for 1997-2001, a linear interpolation of the 2002 and 2006 census counts was used for 2003-2005, and the 2006 census results were used for 2007 estimates. The estimates for each year were then averaged to give an estimated average population by ED for the period 1995-2007.
The average ED population over the period was 1,161; ranging from 62 (Mountstuart, Co. Waterford) to 33,983 (Dundalk Urban, Co. Louth) (Table 2.3, Figure 2.1). Dundalk Urban District comprised a number of EDs in 2006 which were merged for the purposes of this atlas (see below); this merged area was the largest single population unit treated as an ED in RoI. The population of the largest single ED (Blanchardstown-Blakestown) was 23,179.
At each census, the population of a number of EDs was so low that the CSO considered these EDs "confidential", published only total population figures for them, and amalgamated them with one or more neighbouring EDs for the purpose of reporting age-specific population numbers. EDs were considered confidential by the CSO if they included either 15 households or less, or 50 persons or less. There were 12 such confidential EDs in 1996, 19 in 2002 and 32 in 2006. Three of the 2006 confidential EDs had been merged with different EDs in 2002 and so, to create an estimated population for each ED for 1995-2007, any EDs that had been merged during any of these censuses were combined. These are shown in Appendix table A2.1.
The definition of a small number of EDs, and therefore the associated SAPS data, changed between the 1996 and 2002 censuses. These changes consisted of splitting or amalgamation of areas, rather than any movement of boundaries. EDs which had changed in this way were combined for analysis, and the available age and sex distribution similarly combined (Appendix table A2.2). In addition, between 1996 and 2006 there was considerable population growth in a number of towns, many of which consisted of a single ED (urban part), with a surrounding ED (rural part). As the population of these towns increased, they expanded into the rural area, but the ED boundaries remained unchanged. Because of the uncertainty of geocoding of new buildings in these towns, the urban and rural EDs were combined for analysis (Appendix table A2.3). Finally, for the towns of Drogheda, Dundalk and Wexford, population splits were not available for all EDs for all censuses, and the affected EDs were also merged for analysis (Appendix table A2.4). The population of the largest merged ED (Dundalk Urban) was 33,983. This combining of areas gave a final total of 3,355 EDs.
As the formal definition of “urban” areas in Ireland (RoI and NI) does not include many areas at the periphery of towns and cities, urban and rural populations were distinguished by population density (Table 2.4), based on the estimated average number of inhabitants in 1995-2007. Three categories were created for analysis, with the cut-off points (<1 person/hectare, 1-15 persons/hectare, >15 persons/hectare) chosen to give an approximately equal population in each group.
Table 2.4 Distribution of cancer cases and estimated average population in 1995-2007, and number of EDs and wards, by population density tertiles
population density | no. of cancer cases* | estimated average population | % of total population | number of EDs and wards |
<1 person/ha | 121,810 | 2,004,451 | 36% | 2,892 |
1-15 persons/ha | 90,597 | 1,644,792 | 29% | 403 |
>15 persons/ha | 129,380 | 1,940,844 | 35% | 642 |
Total | 341,787 | 5,590,087 | 3,937 |
* All cancers included in this report.
A range of area-based socio-economic measures is available from the population censuses in NI and RoI. However, the majority of these, particularly those relating to occupation and social class, use different definitions in NI and RoI, and are not directly comparable. Three measures were identified as having a degree of compatibility and have been used for analysis in this report:
These socio-economic measures had to be changed from those in the RoI cancer atlas (Carsin et al., 2009), as the necessary information was not available from the 2001 NI census.
Wards and EDs were ranked according to increasing levels of each of these three variables and were divided into population quintiles, (i.e. each quintile contained as close to 20% of the population as possible). The 20% of the population resident in areas with the lowest percentage of, for instance, unemployment, was assigned to quintile 1 while the 20% resident in areas with the highest percentage was assigned to quintile 5. All measures were based upon data for men and women combined from the censuses of 2001 in NI and 2002 in RoI.
Overall, 40% of the NI 16-74 year old population was economically inactive compared to 34% in RoI. Of the economically active population 7% in NI were unemployed in the 2001 census compared to 8% in the 2002 RoI census (Northern Ireland Statistics and Research Agency, 2003; Central Statistics Office, 2003). While, overall, 20% of the population of the island was resident in each unemployment quintile, 30% of the NI population lived in the areas of highest unemployment, compared to 16% of the RoI population (Table 2.5).
Among 16-74 year olds in RoI, 87% did not have a university degree (or academic equivalent) compared to 84% in NI. 25% of the RoI population lived in the areas with the lowest level of tertiary-level education in Ireland, compared to 10% of the NI population.
41% of the NI population aged 75 years and over lived alone, compared to 31% in RoI. 39% of the NI population lived in areas with the highest level of elderly living alone, compared to 12% of the RoI population.
Table 2.5 Population and number of areas (wards and EDs) included in each area-based socio-economic category
| RoI | NI | Ireland | ||||||||
| Quintile Range | Number of areas | Pop* | % of total population | Number of areas | Pop* | % of total population | Number of areas | Pop* | % of total population | |
| Unemployment; % of economically active persons, aged 16-74, who were unemployed | ||||||||||
| Least unemployed (Q1) | 0.0% - 3.5% | 967 | 754,815 | 19% | 114 | 358,345 | 21% | 1,081 | 1,113,160 | 20% |
| Quintile 2 | 3.6% - 4.7% | 695 | 894,496 | 23% | 78 | 225,691 | 13% | 773 | 1,120,187 | 20% |
| Quintile 3 | 4.8% - 6.2% | 672 | 831,031 | 21% | 104 | 283,577 | 17% | 776 | 1,114,608 | 20% |
| Quintile 4 | 6.3% - 8.6% | 593 | 803,616 | 21% | 121 | 320,098 | 19% | 714 | 1,123,713 | 20% |
| Most unemployed (Q5) | 8.7% - 47.3% | 428 | 610,592 | 16% | 165 | 507,827 | 30% | 593 | 1,118,419 | 20% |
| Total | 3,355 | 3,894,549 | 582 | 1,695,538 | 3,937 | 5,590,087 | ||||
| Education; % of persons aged 16-74 without a university degree (or academic equivalent) | ||||||||||
| Least with no degree (Q1) | 44.5% - 81.0% | 239 | 691,541 | 18% | 123 | 425,072 | 25% | 362 | 1,116,612 | 20% |
| Quintile 2 | 81.1% - 86.2% | 319 | 682,943 | 18% | 146 | 434,777 | 26% | 465 | 1,117,720 | 20% |
| Quintile 3 | 86.3% - 89.5% | 557 | 714,096 | 18% | 149 | 402,893 | 24% | 706 | 1,116,989 | 20% |
| Quintile 4 | 89.6% - 92.7% | 978 | 847,567 | 22% | 110 | 271,190 | 16% | 1,088 | 1,118,757 | 20% |
| Most with no degree (Q5) | 92.8% - 100.0% | 1,262 | 958,403 | 25% | 54 | 161,606 | 10% | 1,316 | 1,120,009 | 20% |
| Total | 3,355 | 3,894,549 | 582 | 1,695,538 | 3,937 | 5,590,087 | ||||
| Elderly living alone; % of persons aged 75 and older living alone | ||||||||||
| Least 75+ living alone (Q1) | 0.0% -24.4% | 843 | 1,003,543 | 26% | 37 | 110,246 | 7% | 880 | 1,113,789 | 20% |
| Quintile 2 | 24.5% -30.6% | 681 | 897,794 | 23% | 83 | 222,320 | 13% | 764 | 1,120,114 | 20% |
| Quintile 3 | 30.7% -35.7% | 589 | 796,720 | 20% | 108 | 322,087 | 19% | 697 | 1,118,807 | 20% |
| Quintile 4 | 35.8% -42.5% | 663 | 745,285 | 19% | 134 | 373,596 | 22% | 797 | 1,118,882 | 20% |
| Most 75+ living alone (Q5) | 42.6% -100.0% | 579 | 451,207 | 12% | 220 | 667,288 | 39% | 799 | 1,118,495 | 20% |
| Total | 3,355 | 3,894,549 | 582 | 1,695,538 | 3,937 | 5,590,087 | ||||
* Annual average of combined 1995-2007 population.
The three socio-economic measures and population density had varying degrees of correlation. However while the correlation coefficients between several of the measures were statistically significant, none represented a high level of correlation. The highest correlation was a negative association between education and population density (-0.365) (Table 2.6).
Table 2.6 Correlation coefficients (Spearman’s rank) for ward/ED characteristics
% of economically active persons aged 16-74 who were unemployed | % of persons aged 16-74 without a university degree (or academic equivalent) | % of persons aged 75 and over living alone | |
Population density | 0.231 | -0.365 | 0.112 |
% of economically active persons aged 16-74 who were unemployed | 0.197 | 0.147 | |
% of persons aged 16-74 without a university degree (or academic equivalent) | 0.008 |
Map 2.3 shows Ireland divided into approximate population density tertiles (<1 person/hectare, 1-15 persons/hectare and >15 persons/hectare). As expected, only geographic areas at the centre of large towns and cities, such as Belfast and Dublin, fell into the highest tertile. The majority of wards/EDs in Ireland had a population density of less than 1 person/hectare.
Map 2.4 shows the percentage unemployed in each ED/ward by quintiles. Areas of highest unemployment were found in north and west Belfast, north-west Ireland (including Donegal, Derry and Strabane), the west of Ireland (including Mayo) and parts of Newry & Mourne and Louth.
Low levels of tertiary-level education (as illustrated in Map 2.5) were found in rural parts of RoI, north and west Belfast, north-east Dublin and south-west Dublin. High levels of tertiary education were found in south Belfast and surrounding areas, central and southern Dublin and surrounding areas, and other urban areas and their environs in RoI, such as parts of Cork, Galway and Limerick.
Areas with high proportions of elderly persons (aged 75 and over) living alone were fairly randomly spread across Ireland, as seen in Map 2.6. The proportion was relatively high in Dublin and Belfast city centres, but low in the surrounding areas.
Estimates of cancer incidence rates in 19 (mainly European) countries, of a level of economic development comparable to Ireland, were taken from the GLOBOCAN 2008 dataset (Ferlay et al., 2008). Data for NI is included in that for the UK in this dataset, so the incidence rates shown for both NI and RoI are based on 2005-2007 data from the respective cancer registry. For this reason, the ranking of RoI and NI relative to each other shown in these figures is not always the same as that shown in the summary section, or in the sections for each cancer titled “Small geographic area characteristics and cancer risk”. It should also be noted that, although countries are shown as ranked in descending order of incidence rates, the differences in rates between countries were often quite small and may not be statistically significant.
For some cancers, the definition of cancer site used in GLOBOCAN differed slightly from that used in this atlas. In these cases international comparisons between Ireland and other countries are based upon the GLOBOCAN definition. The exception to this was non-Hodgkin’s lymphoma, where the ICD code C96 was included in the GLOBOCAN definition, but omitted from the NI and RoI figures. A footnote to the comparison graphs is provided to indicate where such differences occur.
Maps 2.3-2.6 Ward/ED characteristics
 |  |
 |  |
In comparing cancer incidence between areas or over time, three important factors must be considered—the number of people at risk, their sex and their age. In this report, cancer incidence for men and women was considered separately, which deals with possible differences between sexes. The reason for correcting for the number of people at risk is obvious; the number of cases is divided by the number of people resident in the area during a specified period (as reported by the census) to produce an incidence rate.
Since the risk of developing cancer doubles with every eight or nine years of life, an area with an older population would be expected, all else being equal, to have more incident cancer cases than an area with a younger population. There are several different approaches available to adjust for differences in age; this atlas has used indirect standardization, which is the most appropriate method for small area comparisons, as it provides more stable rates than other standardization techniques, and works even if there is no population-at-risk in some age groups within the area (Estève et al., 1994). For each small area i, the national incidence rates for each age group j were applied to the population counts (N) in each age group, to calculate the total expected number of cancers (E) in the area. This can be compared to the number actually observed (O) in the area, in the form of an observed to expected ratio, or percentage. This is called the standardised incidence ratio, abbreviated to SIR. The SIR for any cancer for either men or women for Ireland as a whole is, by definition, 1 (or 100%), where for any small area (ED or ward) i:
![]() where
where ![]()
There are several types of geographical analysis of disease incidence:
Because the primary aim was to estimate risks precisely in each small area (ED or ward), disease mapping methodology was used.
Incidence rates, whether crude or standardised, are subject to high variability due to the small number of cases occurring in each small area, and the often small population-at-risk. In many instances, areas with small populations can appear to have a particularly high or low risk, purely by chance. The average population of an ED or ward in Ireland overall was about 1,420, but some were considerably smaller. One of the commonest cancers, colorectal cancer, had an incidence rate of 0.5 cases per 1,000 persons per year, so even over the 13-year period examined here, only about 9 cases would be expected in an average ED or ward, and most cancers analysed in this report have considerably lower incidence rates than this. With such small numbers, random variation is the major factor in the variation of incidence rates between EDs or wards, and this “noise” tends to obscure any other patterns. Therefore, simply mapping the SIRs for each ED or ward can be seriously misleading, as the SIRs tend to be more extreme in areas where the population is sparse. These areas are often the largest in area and can dominate a map visually. This is illustrated for colorectal cancer in men in Map 2.7.
The way of dealing with this problem involves "smoothing" the estimates of disease risk (Elliott et al., 1996). Smoothing removes the noise (i.e. it smoothes out the random variation) and shows more clearly the geographical pattern of the true underlying distribution of cancer rates—or the relative risks (RR). The effect of smoothing is illustrated in Map 2.8, which shows smoothed RRs for male colorectal cancer, compared with the unsmoothed SIRs in Map 2.7.
| Map 2.7 Colorectal cancer, crude standardised incidence ratios: males, 1995-2007 | Map 2.8 Colorectal cancer, smoothed relative risks: males, 1995-2007 |
 |  |
The principle of spatial smoothing is straightforward. If we assume that the risk of cancer does not vary much between areas which are close to each other, then differences between EDs or wards are more likely to be due to random variation than to real differences in risk. The smaller the population of the area, the larger will be the element of random variation and the crude SIR will be quite an unreliable indicator of real risk. Smoothing the SIR for an ED or ward allows us to strengthen the estimate for the ED or ward by “borrowing strength” from adjacent areas (local smoothing) and/or from the overall/national map (global smoothing) in order to increase the stability of the estimated RR. Therefore, smoothing adjusts risk estimates based on small numbers towards a local mean—based on the rates in the neighbouring areas—and also towards the national value.
Many methods have been proposed for smoothing disease rates (Elliott et al., 1996; Best et al., 2005). We have chosen to use a Bayesian approach (Best et al., 2005). The main advantage of Bayesian techniques is that they work well in situations of limited information and high uncertainty. They are better at accurately depicting the geographical pattern in risk than other techniques, such as non-hierarchical approaches, which are more likely to be visually misleading (Pascutto et al., 2000).
The SIRs were smoothed by estimating relative risks using conditional autoregressive models (CAR) (Clayton and Kaldor, 1987) based on a spatial Poisson model with two random effects, as follows:
![]()
![]()
where
![]() was the observed number of cancer cases in area i;
was the observed number of cancer cases in area i;
![]() was the expected number based on age-adjusted national incidence rates in area i;
was the expected number based on age-adjusted national incidence rates in area i;
![]() was the estimated relative risk in area i;
was the estimated relative risk in area i;
α was the intercept;
![]() was a random effect which models the unstructured heterogeneity; and
was a random effect which models the unstructured heterogeneity; and
![]() was a spatially structured random effect (which is given a CAR prior distribution).
was a spatially structured random effect (which is given a CAR prior distribution).
Use of CAR models is widespread in disease mapping and this particular model is considered to be appropriate in most situations (Lawson et al., 2000; Best et al., 2005). The suitability of the specific model above for Ireland was evaluated by comparing it with several alternative models which included covariates for population density and/or country. However, it was decided to use the basic model in this atlas as, while the alternative models were successful in detecting covariate effects, it was not clear what the covariates were actually markers for. Any effects due to socio-economic factors, for example, would be identified by means of the negative binomial regression analysis (section 2.3.3).
Other disease mapping methods (e.g. kernel smoothers, mixture models) seem to give poorer results than CAR (Lawson et al., 2000). Although risk estimates can be somewhat underestimated, CAR models have a high specificity (Richardson et al., 2004), and this conservative approach means that high or low estimates are more likely to be real. However, as with any smoothing method, it is possible that areas of genuinely high risk may be missed by smoothing with neighbouring areas. The method also assumes that risk varies smoothly at the scale studied, an assumption which may not be justified if risk factors vary considerably at a purely local level.
Models were fitted using Markov Chain Monte Carlo (MCMC) algorithms with WinBUGS software (Lunn et al., 2000). Estimates were checked to ensure convergence had been reached. A burn-in of 150,000 iterations was performed and the posterior distributions were derived using one in three iterations from the subsequent 10,000 iterations of 2 chains.
Ireland has a number of off-shore islands which form EDs but which have no neighbours (i.e. adjacent areas). Smoothing is based on a shared boundary between EDs, and the absence of such a boundary means that the risk for islands cannot be smoothed in the same way as that for mainland EDs. A similar situation arises with a number of headlands and small peninsulas, which share a boundary with only one other ED. It is common for such EDs or wards to appear as “hotspots” on smoothed maps. To minimise this problem, we created artificial “neighbours” for islands and those headlands which had only one neighbour, by assigning the nearest mainland EDs or wards as “additional neighbours”, so that each island and headland had a minimum of two neighbours (Appendix table A2.5). The “additional neighbours” were given a weighting half that of true neighbours in the smoothing algorithm.
Relative risks (RR) were mapped for each cancer site individually using ArcMap 9.3. For those cancers which affect both sexes, maps are included for both sexes combined and for men and women separately. County and district council boundaries are shown faintly on the maps to help the reader with geographical orientation; a map of these is on page 4 (Map 2.1). To aid orientation, a map is also provided at the same scale, showing the same boundaries, as well as some towns and cities on the island (Map 2.2). To facilitate comparisons between cancer sites, each map is shown using the same colour ramp, which ranges from dark green for an estimated RR less than 0.50 to dark blue for a RR higher than 2.00 (i.e. the same colour represents the same value of RR on each map). The grid from 0.50-1.00 was based on the assumption of normality of the estimated relative risks so that approximately equal numbers would fall into each interval. The grid from 1.00-2.00 was chosen as the reciprocal of the 0.50-1.00 intervals (e.g. the reciprocal of 0.50-0.55 is 1.82-2.00) as this was considered appropriate for ratios (relative risks). This scale is different from that used in the RoI atlas (Carsin et al., 2009) and so the maps are not directly comparable.
Appendix table A3.1 contains summary information from the mapping of each cancer site, including average numbers of cases per ED and ward, and ranges of SIRs and smoothed RRs.
A count of the number of cases of cancer by type and sex was available for each ward/ED. Relating these counts to the ward/ED characteristics is traditionally done by modelling the count data using Poisson regression. However a key assumption behind this approach is that the mean and variance of the counts being modelled are the same. Deriving the mean number of cancer cases diagnosed in each small geographic area, and the variance between areas in these counts, illustrates that this assumption is not valid and that the data is over-dispersed; that is, the variance is greater than the mean (Table 2.7) (Breslow, 1984).
Table 2.7 Mean and variance in the number of cancer cases diagnosed in each ward/ED: 1995-2007
cancer | males | females | ||
mean | variance | mean | variance | |
non-melanoma skin cancer | 14.2 | 347.5 | 12.5 | 334.7 |
breast | - | - | 9.8 | 186.5 |
colorectal | 5.4 | 48.9 | 4.3 | 35.0 |
lung | 5.3 | 58.7 | 3.3 | 30.7 |
prostate | 8.4 | 108.3 | - | - |
non-Hodgkin’s lymphoma | 1.3 | 3.7 | 1.2 | 3.4 |
stomach | 1.5 | 5.0 | 0.9 | 2.7 |
melanoma of the skin | 0.9 | 2.5 | 1.4 | 5.3 |
bladder | 1.6 | 5.4 | 0.6 | 1.4 |
head and neck | 1.4 | 5.3 | 0.6 | 1.2 |
leukaemia | 1.2 | 2.9 | 0.8 | 1.9 |
pancreas | 0.9 | 1.9 | 0.9 | 2.3 |
kidney | 1.0 | 2.7 | 0.6 | 1.3 |
oesophagus | 1.0 | 2.5 | 0.6 | 1.3 |
ovary | - | - | 1.6 | 5.7 |
brain and other central nervous system | 0.8 | 1.6 | 0.6 | 1.1 |
cervix uteri | - | - | 1.0 | 3.1 |
corpus uteri | - | - | 1.3 | 4.1 |
Although a great deal of this variance may be explained by the differing population sizes of each geographic area, which is adjusted for in a Poisson regression model, we decided to use a modification of Poisson regression, known as negative binomial regression, to adjust more fully for the over-dispersion. This model produces a relative risk (RR) for each categorical variable included in the model, relative to a baseline value. For example, if RoI is taken as the baseline (by definition, RR=1) in a variable indicating which country the geographic area is in, then if NI has a relative risk greater than 1, this means that the incidence of cancer is higher in NI than RoI; conversely a relative risk lower than 1 means that incidence is lower in NI than RoI. Five small area characteristics were examined for a relationship to cancer incidence using this approach—country, population density tertile, and quintiles of unemployment, third-level education and elderly living alone (see section 2.2.4.3).
It has already been noted (section 2.2.4.3) that the variables we are studying are not completely independent of each other. Therefore, if we see a relationship between cancer risk and a specific variable (for instance level of unemployment), part of this relationship might be due to another factor, such as the average age of the population, which would influence both cancer rates and unemployment levels. For this reason, measures of the effect of each variable must be adjusted for the effects of the others (see section 2.3.1). The most important adjustment is for age, as cancer risk rises rapidly with age. Two comparisons were made between NI and RoI, one of which was adjusted for age alone, and the other for age, population density, unemployment, education and percentage of elderly living alone. All other relative risks reported were adjusted for the effects of all the other variables. Thus, risk estimates are reported for:
The risk estimates with 95% confidence intervals and tests of statistical significance are given in full for each site in Appendix 1. Summary figures are presented in each chapter.
A series of summary measures was computed for each cancer site. The incidence of each cancer is expressed in terms of the average number of new cases each year between 1995 and 2007, and as a percentage of all new cancer cases, both including and excluding non-melanoma skin cancer.
Estimated annual percentage rate of change in the number of cases was calculated over the period 1995-2007 (13 years) by taking the 12th root of the total percentage growth rate (12 years of growth).

Cumulative risk to age 74 ( is the risk of developing a specified cancer or cancers up to and including age 74, in the absence of competing risks (Estève et al, 1994). This was calculated as follows:
![]()
where, if x is one of 15 five-year age groups from 0 to 74:

tx=age-specific incidence rate
The cumulative risk is given as a percentage and also as a ratio (e.g. a cumulative risk of 4% is expressed as 1 in 25).
15-year prevalence was estimated as the total number of individuals diagnosed between 1/1/1994 and 31/12/2008 who were still alive on 31/12/2008. Numbers are given for those who were aged under 65 years on 31/12/2008, and for those who were aged 65 years or older on that date.
Non-melanoma skin cancer (NMSC) was the most common cancer in Ireland, accounting for 27% of all malignant neoplasms (Table 3.1). The average number of new cases diagnosed each year was 3,777 in women and 4,294 in men. During 1995-2007, the number of new cases increased by approximately 3% per annum; since 2002 it has been increasing by around 6% in RoI.
The risk of developing NMSC before the age of 75 was 1 in 12 for women and 1 in 8 for men and was slightly higher in RoI than in NI for both men and women. At the end of 2008, 11,629 women and 12,375 men aged under 65, and 30,748 women and 31,937 men aged 65 and over, were alive up to 15 years after their cancer diagnosis.
Table 3.1 Summary information for non-melanoma skin cancer in Ireland, 1995-2007
Ireland | RoI | NI | ||||
females | males | females | males | females | males | |
% of all new cancer cases | 27% | 28% | 28% | 29% | 24% | 27% |
average number of new cases per year | 3777 | 4294 | 2666 | 3080 | 1111 | 1215 |
cumulative risk to age 74 | 8.6% | 12.2% | 9.3% | 12.9% | 7.1% | 10.5% |
15-year prevalence (1994-2008) | 42377 | 44312 | 29736 | 31028 | 12641 | 13284 |
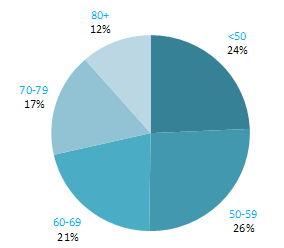
The incidence of NMSC increased with increasing age (Figure 3.1). The age distribution was similar for men and women and for RoI and NI. Only approximately 10% of cases occurred in those aged under 50 years and the largest number of cases for both sexes presented in the 70–79 age group.
Figure 3.1 Age distribution of non-melanoma skin cancer cases in Ireland, 1995-2007, by sex

No reliable data are available on international variations in non-melanoma skin cancer incidence.
Table 3.2 Risk factors for non-melanoma skin cancer, by direction of association and strength of evidence
Increases risk | Decreases risk | |
Convincing or probable | Sun exposure1,2 | |
| Skin colour2 | |
| Ability to tan2 | |
| Childhood freckling2 | |
| Presence of benign sun damage in the skin2 | |
| Sunbed/sunlamp use3 | |
| Immune suppression4 and some immunosuppressive drugs5 | |
| Infection with human papilloma viruses (HPV)6 | |
| Human immunodeficiency virus, type 1 (HIV-1)6 | |
| Methoxsalen5,7 | |
| Arsenic and inorganic arsenic compounds8 | |
| Ionizing radiation9 | |
Possible | Statins10 | |
1 International Agency for Research on Cancer, 1992; 2 Armstrong and Kricker, 2001; 3 Karagas et al., 2002; 4 Saladi and Persaud, 2005; 5 International Agency for Research on Cancer, 2011a; 6 International Agency for Research on Cancer, 2011b; 7 together with UV light; 8 Straif et al., 2009; 9 El Ghissassi et al., 2009; 10Kuoppala et al., 2008 | ||
Individuals who are immune suppressed, such as organ transplant recipients or those with AIDS, have a greatly increased risk of developing NMSC. Positivity for the human immunodeficiency virus, type 1 (HIV-1) is a cause of NMSC. Some immunosuppressive drugs—including azathioprine and ciclosporin—which are used to prevent organ rejection following transplant, or to treat autoimmune diseases such as rheumatoid arthritis and Crohn’s disease, are recognised to cause skin cancer. Risk of NMSC is also increased by exposure to the drug methoxsalen, which is used to treat some skin conditions, in combination with UV light. Residues of arsenic from agriculture, mining and industrial practices can end up in drinking water. Arsenic is carcinogenic (International Agency for Research on Cancer, 1987; International Agency for Research on Cancer, 2004a) and ingestion of arsenic and inorganic arsenic compounds causes NMSC. Low-dose ionizing radiation exposure (e.g. for benign skin conditions such as acne) increases risk of BCC.The two main types of non-melanoma skin cancer are squamous cell carcinoma (SCC) and basal cell carcinomas (BCC). Both types are caused by exposure to ultraviolet (UV) radiation present in sunlight. Occupational sunlight exposure has been mainly associated with SCC and recreational exposure with BCC. Individuals with a lighter skin colour, less ability to tan, and who had freckles as a child, are at increased risk, as are those with solar keratoses (benign sun damage to the skin). Independently of sun exposure, use of artificial tanning devices which emit UV radiation, such as sunbeds or sunlamps, has been associated with raised risk of BCC and, especially, SCC.
Human papilloma viruses (HPV) infect mucosal and cutaneous epithelia. Infection with particular HPV types (genus-beta types and specifically HPV5 and HPV8) may be causally related to NMSC (International Agency for Research on Cancer, 2011b). People who use statins may have an increased risk of NMSC (although the possibility that the association could be due to different levels of contact with health services among users and non-users of statins cannot be discounted).
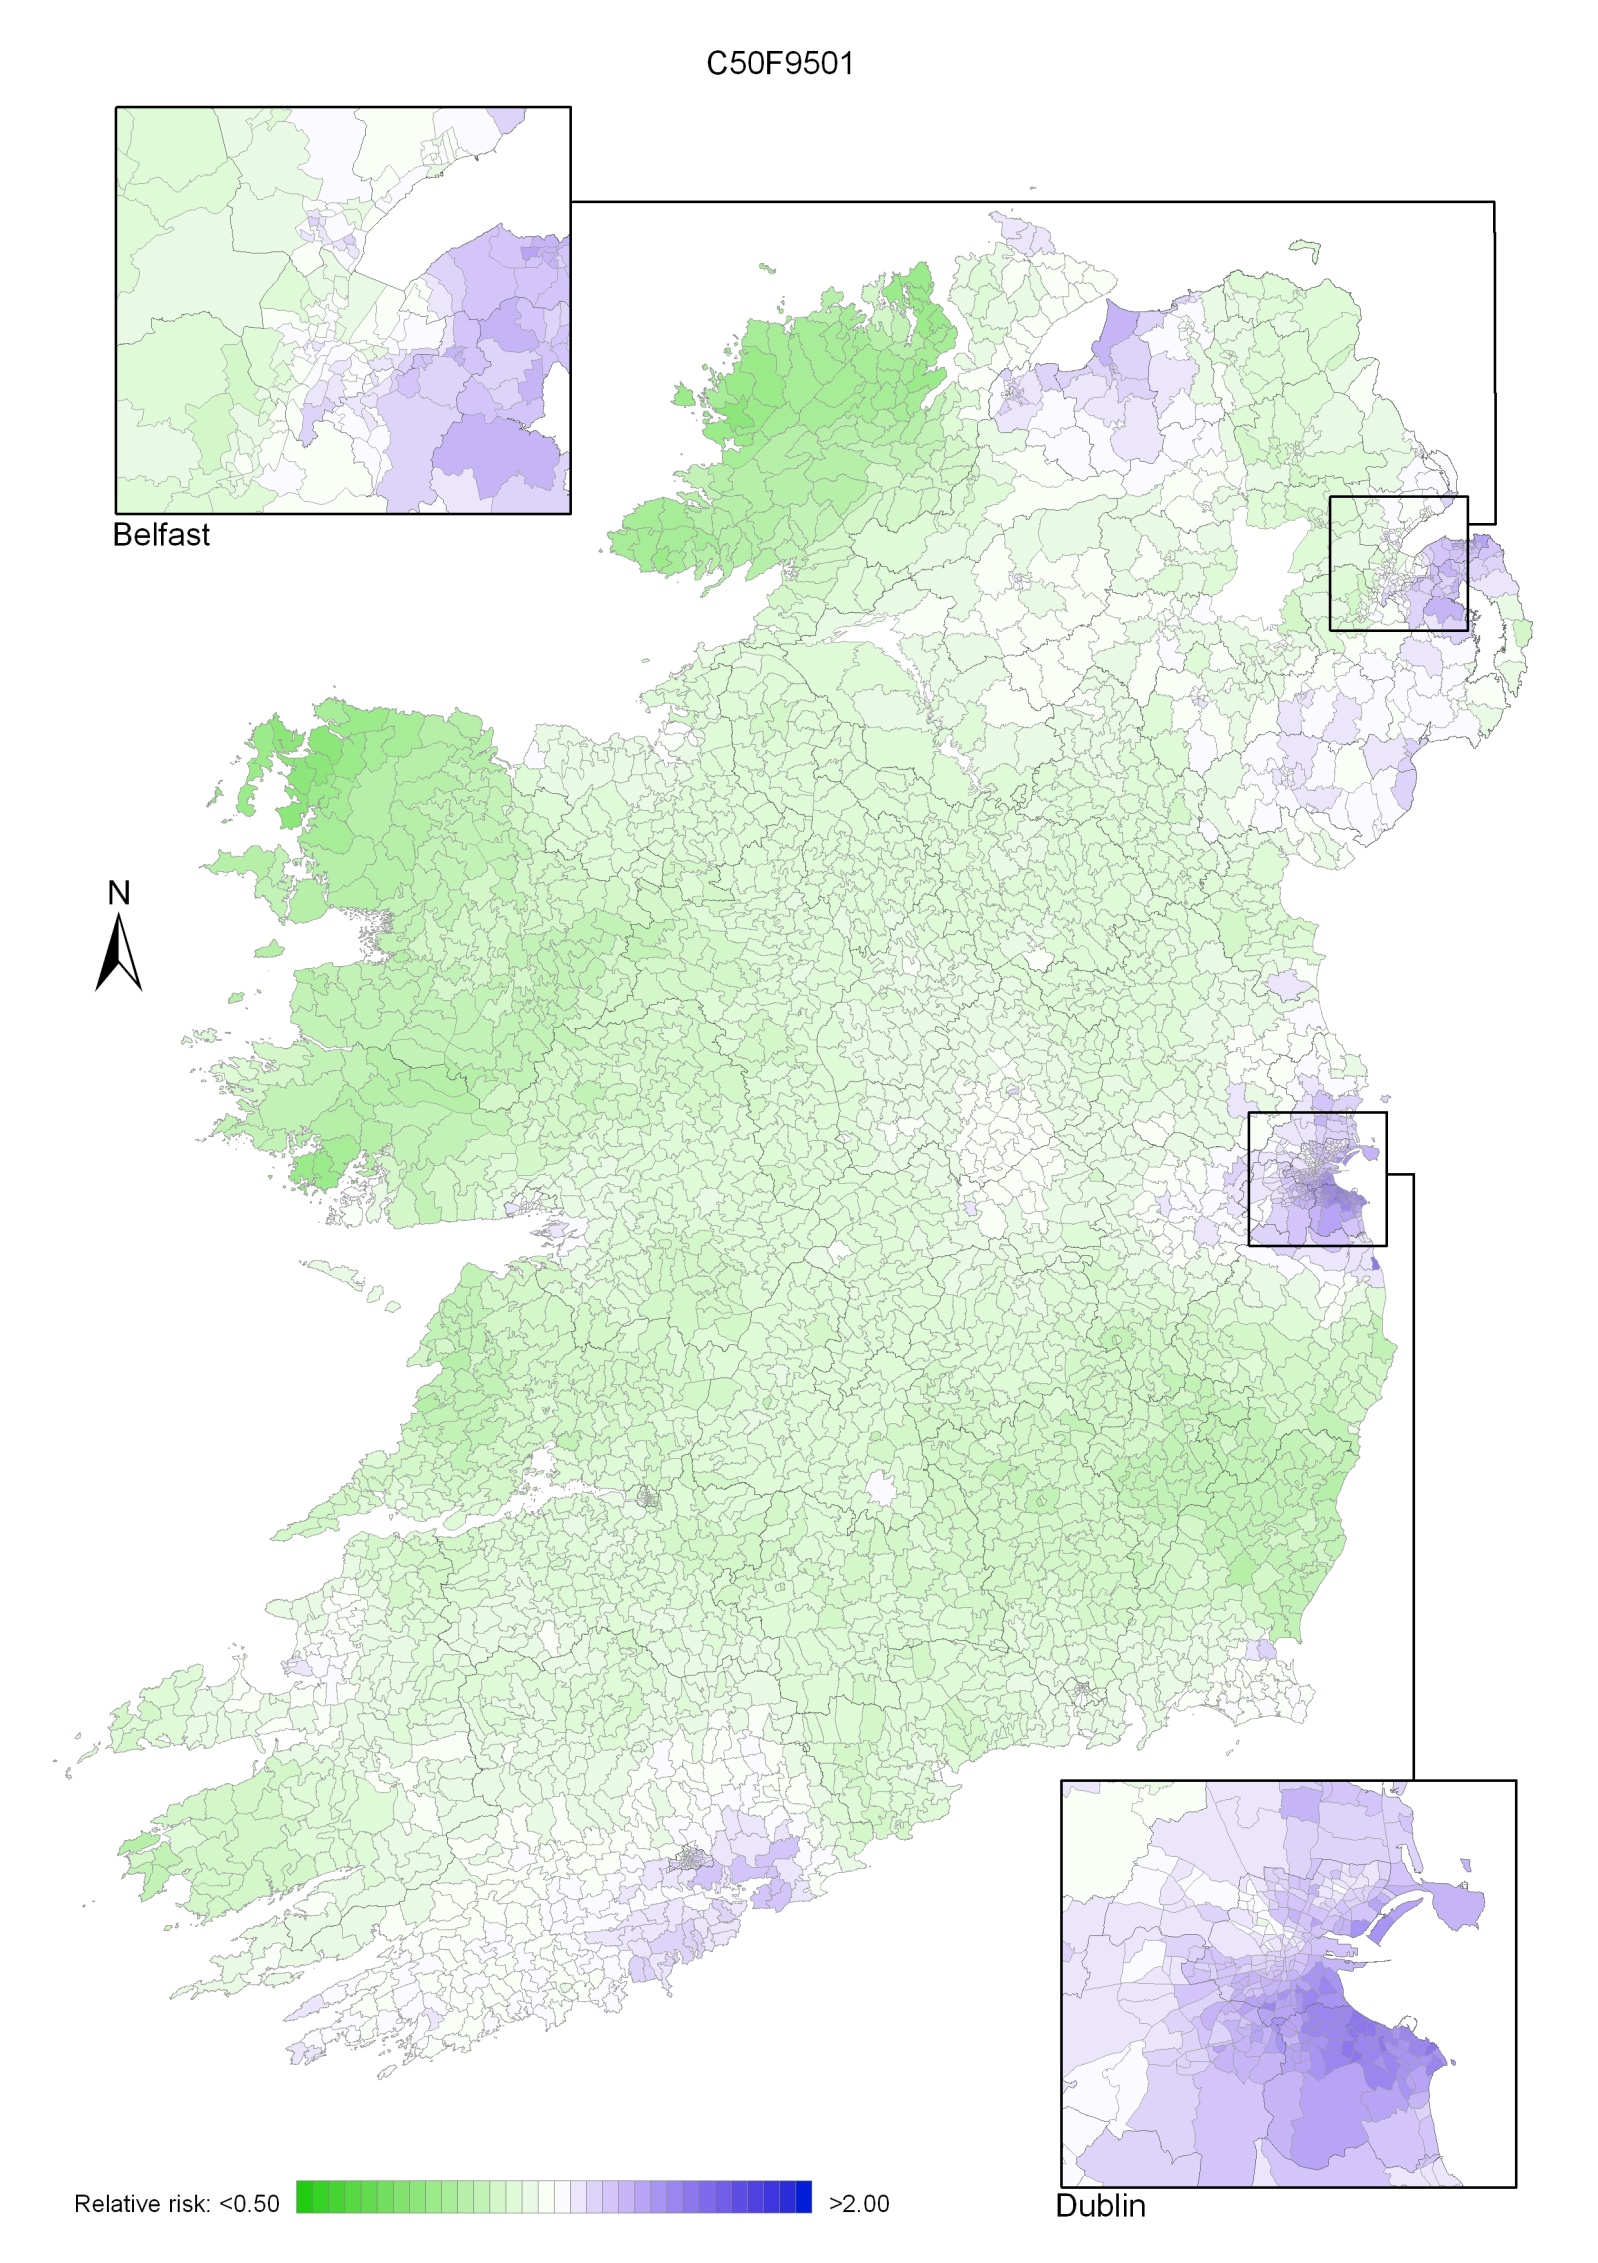
Non-melanoma skin cancer had a strong geographical pattern, which was similar for men and women (Maps 3.1-3.3).
Regions of high relative risk were mainly seen in coastal areas, particularly along the east coast from Down to Wicklow, the south and west coasts from Waterford to Mayo and in Sligo (men) and Donegal. Areas of higher relative risk were also seen around the cities of Dublin, Waterford, Cork, Limerick and Galway.
Map 3.1 Non-melanoma skin cancer, smoothed relative risks: both sexes

Map 3.2 Non melanoma skin cancer, smoothed relative risks: males

Map 3.3 Non melanoma skin cancer, smoothed relative risks: females

The average number of new cases diagnosed each year was 2,965 in women and 20 in men. Breast cancer was the most common cancer in women in Ireland, accounting for 29% of all malignant neoplasms, excluding non-melanoma skin cancer (Table 4.1). During 1995-2007, the number of new cases diagnosed in women increased by approximately 3% per annum, 4% in RoI and 1% in NI. From 2002 to 2007, annual increases of 3% in RoI and 4% in NI were observed.
The risk of developing breast cancer up to the age of 74 was 1 in 12 for women and 1 in 1,621 for men and was slightly higher in RoI than in NI. At the end of 2008, 17,167 women and 53 men aged under 65, and 13,987 women and 128 men aged 65 and over, were alive up to 15 years after their cancer diagnosis.
Table 4.1 Summary information for breast cancer in Ireland, 1995-2007
Ireland | RoI | NI | ||||
females | males | females | males | females | males | |
% all new cancer cases | 21% | 0.1% | 21% | 0.1% | 21% | 0.1% |
% all new cancer cases excluding non-melanoma skin cancer | 29% | 0.2% | 29% | 0.2% | 28% | 0.2% |
average number of new cases per year 1995-2007 | 2965 | 20 | 1990 | 14 | 975 | 6 |
average number of new cases per year 1995-2001 | 2665 | 19 | 1762 | 12 | 903 | 7 |
average number of new cases per year 2002-2007 | 3315 | 20 | 2257 | 16 | 1058 | 4 |
cumulative risk to age 74 | 8.4% | 0.06% | 8.4% | 0.07% | 8.3% | 0.05% |
15-year prevalence (1994-2008) | 31154 | 181 | 20827 | 123 | 10327 | 58 |
The remainder of this chapter relates only to breast cancer in women.
The proportion of breast cancers which occurred in women aged 60 and over was lower than for most other cancers (Figure 4.1). Almost one quarter of all cases occurred in women aged under 50, and a further quarter in those aged 50–59. Just 12% of cases were diagnosed in those aged over 80 years. This pattern was similar for RoI and NI.
Figure 4.1 Age distribution of female breast cancer cases in Ireland, 1995-2007
The incidence of breast cancer in women in RoI and NI was close to the median of the 21 countries shown. Age-standardised rates in both countries were slightly lower than in the UK (Figure 4.2). Rates were highest in Belgium and Denmark and lowest in Poland, Russia and Japan.
Figure 4.2 Estimated incidence rate per 100,000 in 2008 for selected developed countries compared to 2005-2007 incidence rate for RoI and NI: female breast cancer
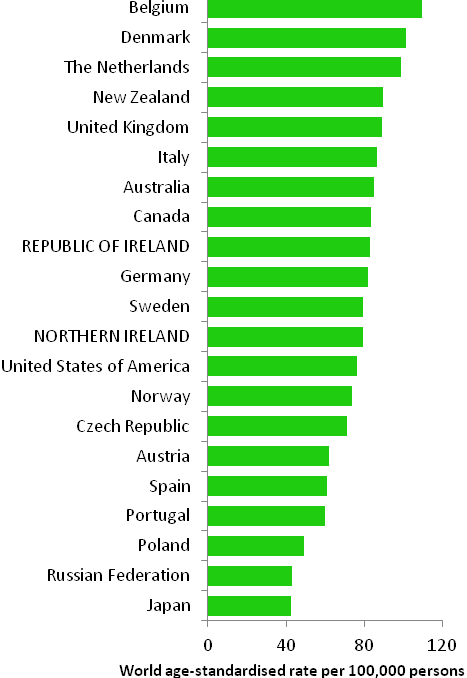
Source: GLOBOCAN 2008 (Ferlay et al., 2008) (excluding RoI and NI data, which is derived from cancer registry data for 2005-2007)
Table 4.2 Risk factors for breast cancer, by direction of association and strength of evidence
| Increases risk | Decreases risk |
Convincing or probable | Family history of breast cancer1,2 | Breastfeeding18,19 |
| Nulliparity and low parity2,3 | Physical activity18 |
| Late age at first pregnancy2,3 | Greater body fat (pre-menopausal cancer)18 |
| Late natural menopause2,3 | Tamoxifen and raloxifene5,20,21 |
| Early menarche2,3 | |
| Oral contraceptives4,5 | |
| Hormone replacement therapy5 | |
| Diethylstilbestrol5,6 | |
| Greater body fatness, abdominal fatness and weight gain in adulthood (post-menopausal cancer)7,8,9 | |
| Alcohol10,11 | |
| Smoking11 | |
| Ionizing radiation12, 13 | |
| Benign breast disease14 | |
| High socio-economic status15 | |
Possible | Red meat (pre-menopausal cancer)16,17 | Dairy food22 |
| Higher (own) birthweight 17 | Isoflavones from soya foods23 |
Vitamin D24,25,26 | ||
Dietary fibre27 | ||
Aspirin and other non-steroidal anti-inflammatory drugs28,29 | ||
1 First degree relative(s) with breast cancer; 2 Veronesi et al., 2005; 3 Key et al., 2001; 4 combined oestrogen-progestogen formulations; 5 International Agency for Research on Cancer, 2011a; 6 exposure during pregnancy; 7 World Cancer Research Fund / American Institute for Cancer Research, 2007; 8 Suzuki et al., 2009; 9 Vrieling et al., 2010; 10 Suzuki et al., 2008; 11 Secretan et al., 2009; 12 El Ghissassi et al., 2009; 13 Jansen-van der Weide et al., 2010; 14 Zhou et al., 2011; 15 Faggiano et al., 1997; 16 Taylor et al., 2009; 17 Xu et al., 2009; 18 International Agency for Research on Cancer, 2002; 19 Collaborative Group on Hormonal Factors in Breast Cancer, 2002; 20 in pre-menopausal women at high breast cancer risk; 21 Wickerham et al., 2009; 22 Dong et al., 2011a; 23 Dong & Qin, 2011; 24 intake and blood levels; 25 Chen et al., 2010; 26 Yin et al., 2010; 27 Dong et al., 2011b; 28 Takkouche et al., 2008; 29 Zhao et al., 2009 | ||
Breast cancer is a heterogeneous disease, comprising several distinct subgroups defined on the basis of hormonal receptor status and/or morphology. Recently interest has grown in distinguishing between risk factors for different subtypes (see, for example, Suzuki et al., 2008; Reeves et al., 2009; Suzuki et al., 2009; Vrieling et al., 2010; Yang et al., 2011). Up to 10% of breast cancer cases are hereditary and a woman's chance of developing the disease is increased if any of her first degree female relatives had breast cancer, particularly if more than one relative was affected at a young age (Veronesi et al., 2005). By age 70, women who carry BRCA1 gene mutations have a 65% chance of developing breast cancer, while those who carry BRCA2 mutations have a 45% risk (Antoniou et al., 2003). Family history may interact with other factors to modify risk, for example, exposure to low doses of radiation such as x-rays (Jansen-van der Weide et al., 2010) or history of benign breast disease (Zhou et al., 2011). Other than genetic factors, the major determinant of breast cancer risk is lifetime exposure to oestrogen (Table 4.2). Higher endogenous oestrogen exposure, as well as exogenous oestrogens, increases risk. In contrast, in pre-menopausal women at high risk of breast cancer, the anti-oestrogenic drugs tamoxifen and raloxifene reduce the chances of developing the disease by about half.
| Figure 4.3 Adjusted relative risks (with 95% confidence intervals) of breast cancer by socio-economic characteristics of geographic area of residence: females | |
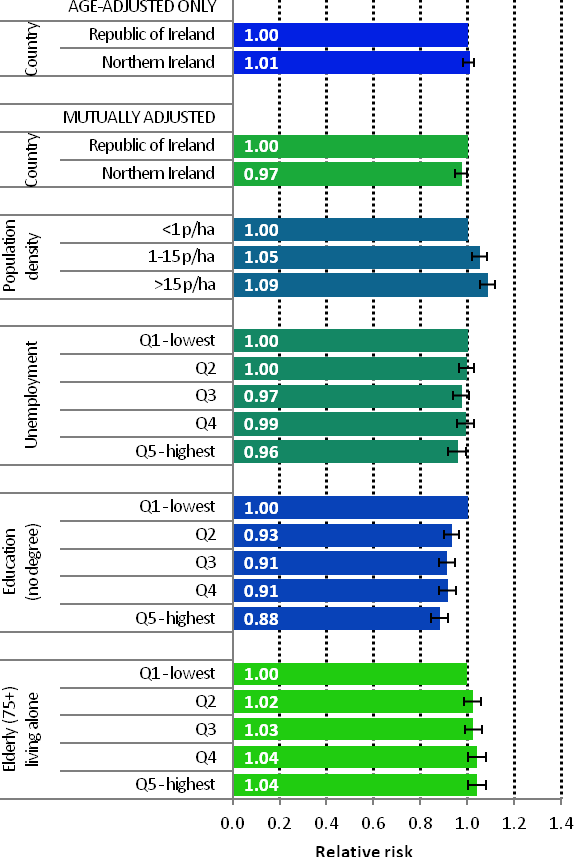 | The risks of breast cancer in women in RoI and NI were similar in 1995-2007; however, after adjustments for population density and socio-economic factors, the risk of breast cancer was lower in NI than in RoI (RR=0.97, 95%CI=0.95-1.00) (Figure 4.3) The risk of breast cancer increased with increasing population density. Women resident in areas with 1-15 persons per hectare (p/ha) had a 5% greater risk of breast cancer than those resident in the least densely populated areas, while those resident in the most densely populated areas had a 9% greater risk. Breast cancer risk was inversely related to both unemployment and educational attainment. Compared to areas with low levels of unemployment and high levels of degree level education, those areas with high levels of unemployment and less degree-level education, had a 4% and 12% lower risk of breast cancer respectively. Areas with the highest proportion of elderly living alone had a 4% greater risk of breast cancer. |
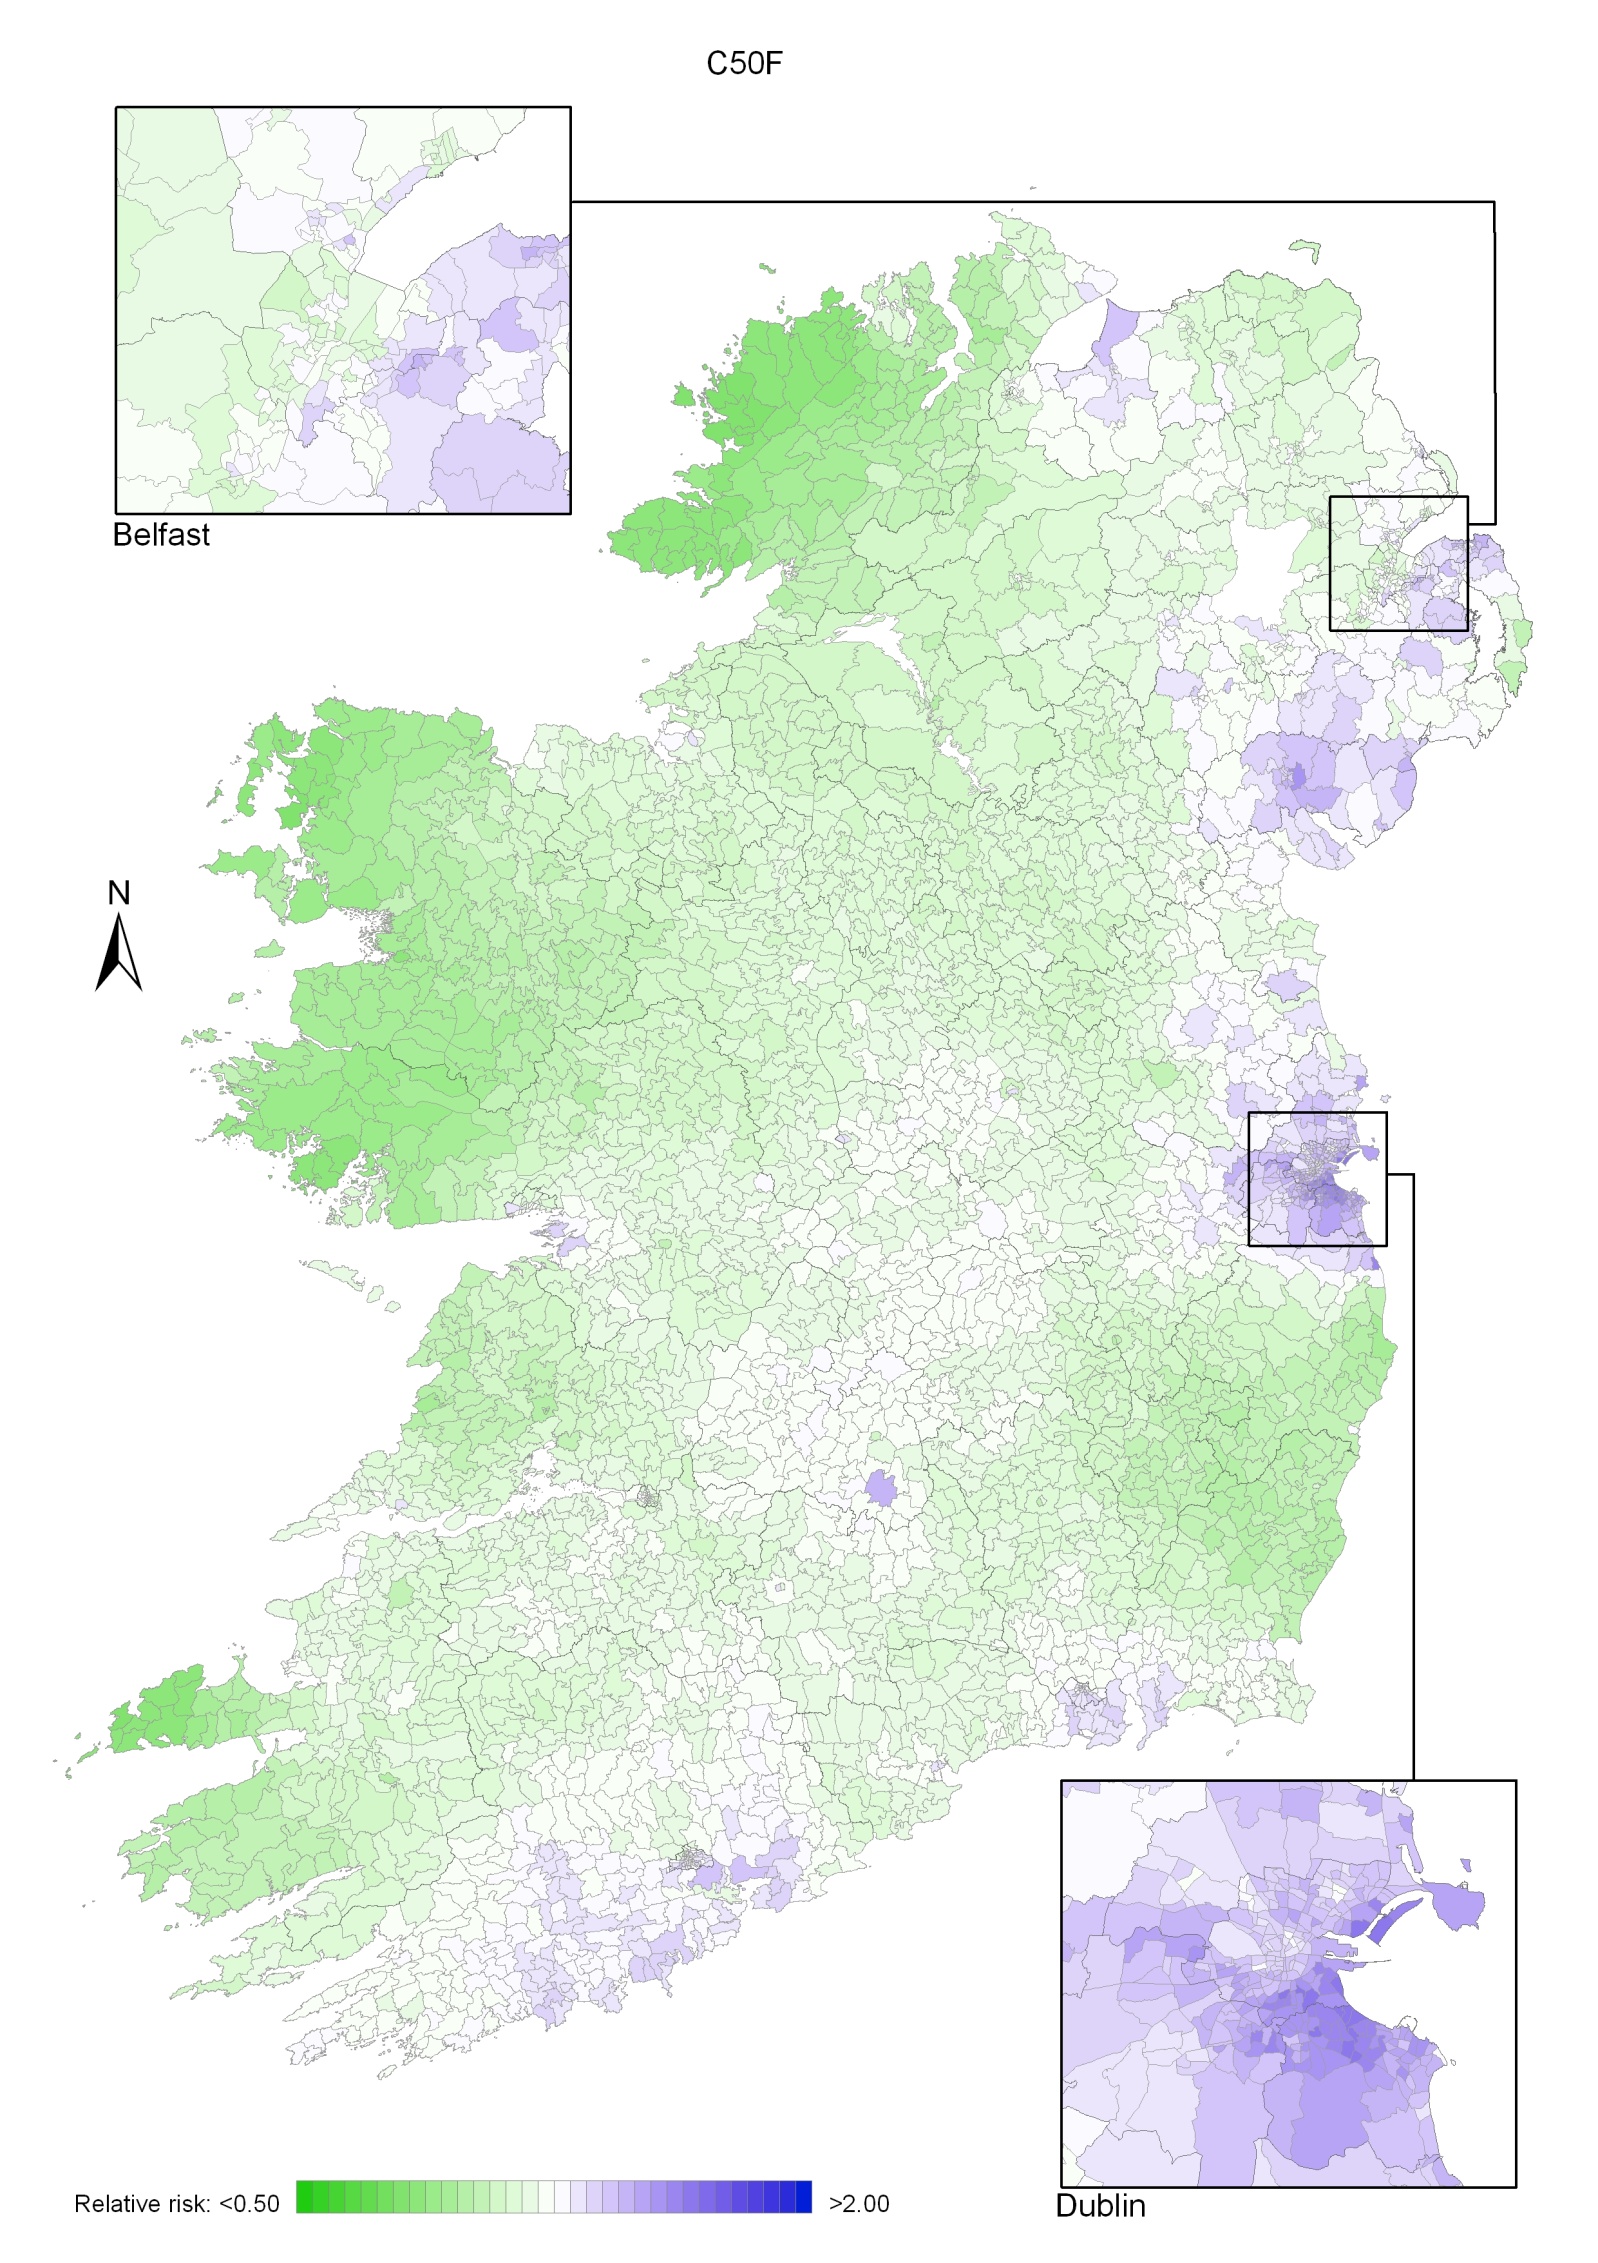
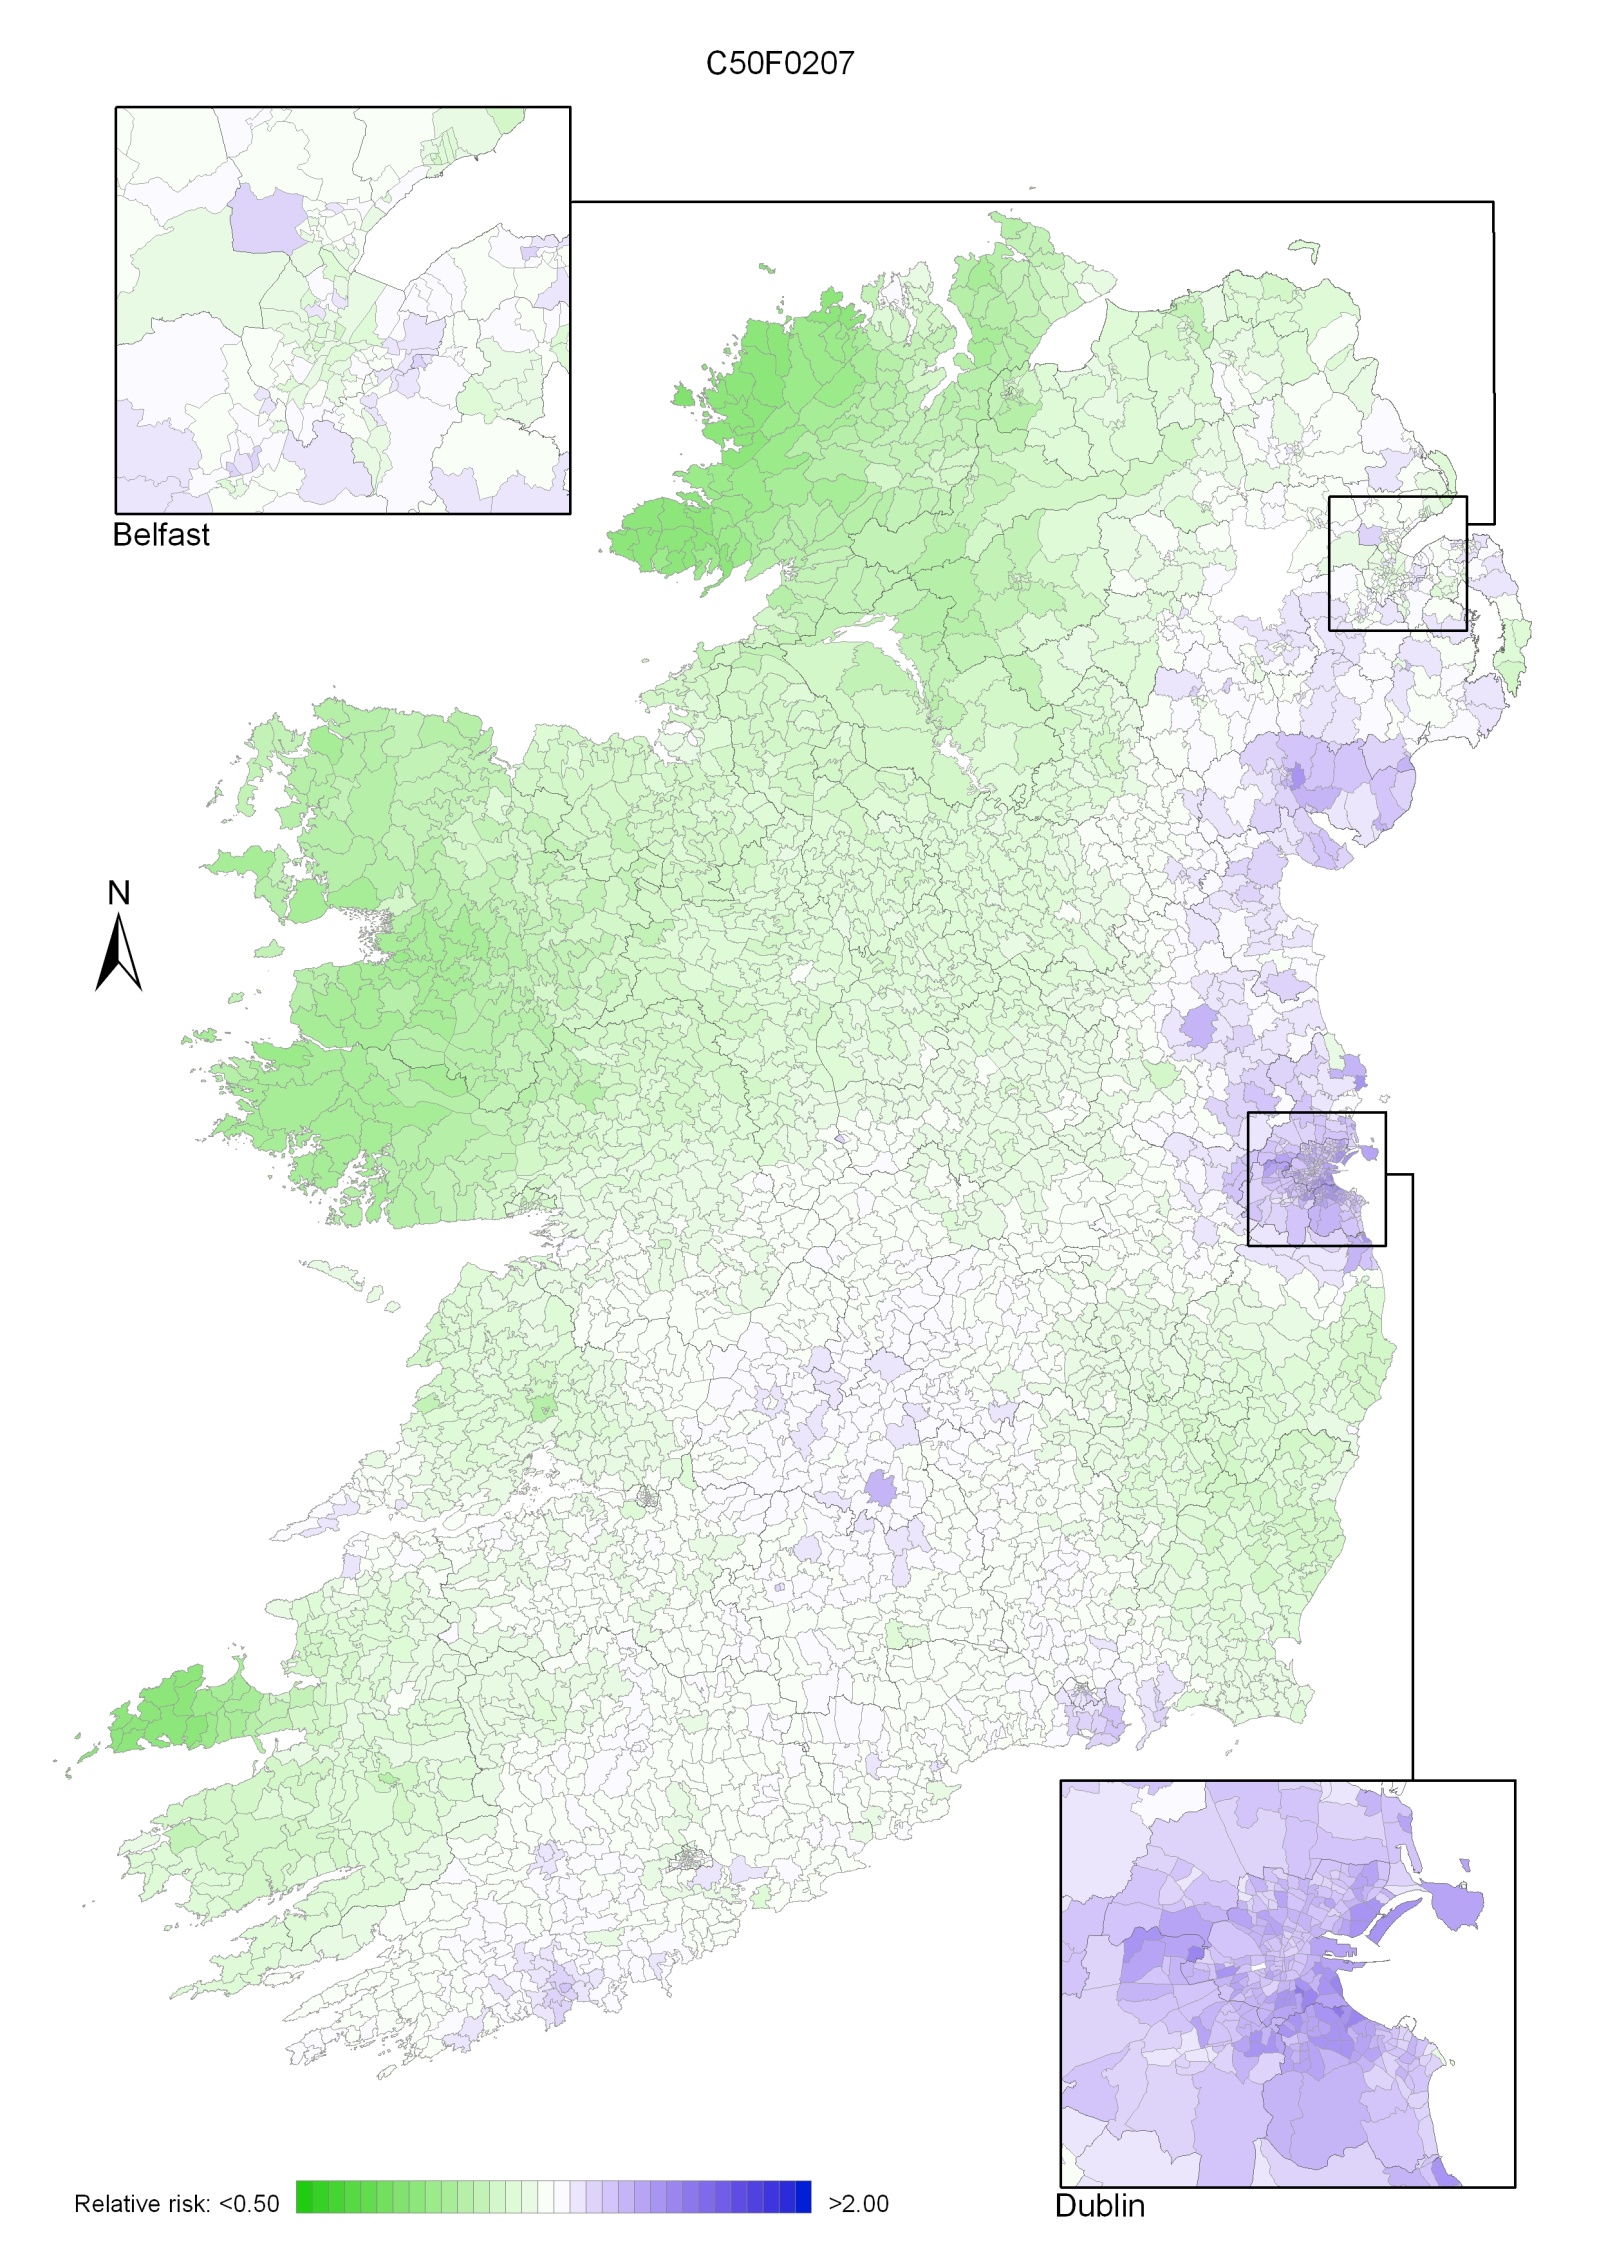
The geographical variation in relative risk of breast cancer was fairly modest (Maps 4.1-4.3).
Taking 1995-2007 overall, areas of higher relative risk existed around Dublin and Newry and Mourne and, to a lesser extent, Down, North Down, Ards, Limavady, and much of Munster (Map 4.1).
In the period 1995-2001, the areas of higher risk were in the major urban areas of east Belfast (including North Down), Dublin, Cork and Derry, and also in Limavady, Down, Ards and Castlereagh (Map 4.2).
In 2002-2007 the variation was somewhat more pronounced, with areas of higher relative risk extending in a band from Newry and Mourne to Dublin (Map 4.3). Areas in the west and north-west had consistently low relative risks throughout.
Map 4.1 Breast cancer, smoothed relative risks: females 1995-2007
Map 4.2 Breast cancer, smoothed relative risks: females 1995-2001
Map 4.3 Breast cancer, smoothed relative risks: females 2002-2007
Colorectal cancer was the second most common cancer in Ireland. It accounted for 13% of all malignant neoplasms, excluding non-melanoma skin cancer, in women and 15% in men (Table 5.1). The annual average number of new cases diagnosed was 1,307 in women and 1,631 in men. 63% of these cancers arose in the colon and 37% in the rectum. During 1995-2007, the number of new cases increased, on average, by approximately 2% per annum, but during 2002-2007 increased by 4% per annum. The patterns of increase were similar for RoI and NI.
The risk of developing colorectal cancer up to the age of 74 was 1 in 32 for women and 1 in 20 for men and was similar for NI and RoI. At the end of 2008, 2,335 women and 2,787 men aged under 65, and 6,137 women and 7,205 men aged 65 and over, were alive up to 15 years after their colorectal cancer diagnosis.
Table 5.1 Summary information for colorectal cancer in Ireland, 1995-2007
Ireland | RoI | NI | ||||
female | male | female | male | female | male | |
% of all new cancer cases | 9% | 11% | 9% | 10% | 10% | 11% |
% of all new cancer cases excluding non-melanoma skin cancer | 13% | 15% | 12% | 15% | 13% | 15% |
average number of new cases per year | 1307 | 1631 | 849 | 1114 | 458 | 517 |
cumulative risk to age 74 | 3.2% | 5.1% | 3.1% | 5.1% | 3.2% | 5.0% |
15-year prevalence (1994-2008) | 8472 | 9992 | 5487 | 6789 | 2985 | 3203 |
Approximately half of colorectal cancers were diagnosed in those aged 70 and older—51% of men and 58% of women (Figure 5.1). The age distribution was similar for both sexes, although there was a higher proportion of cases in men aged 60–69 (29%, compared to 22% in women) and a higher proportion in women aged 80 and older (26%, compared to 17% in men).
Figure 5.1 Age distribution of colorectal cancer cases in Ireland, 1995-2007, by sex
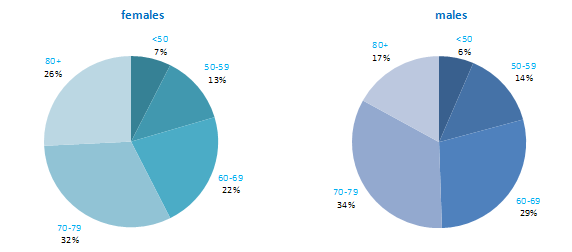
The incidence of colorectal cancer among both men and women in RoI and NI was close to the median for the countries shown. Rates were highest in New Zealand among women and in the Czech Republic for men (Figure 5.2).
Figure 5.2 Estimated incidence rate per 100,000 in 2008 for selected developed countries compared to 2005-2007 incidence rate for RoI and NI: colorectal cancer | |
| females | males |
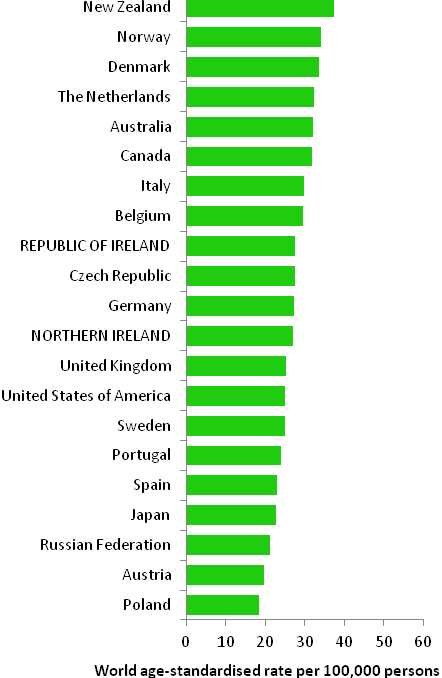 | 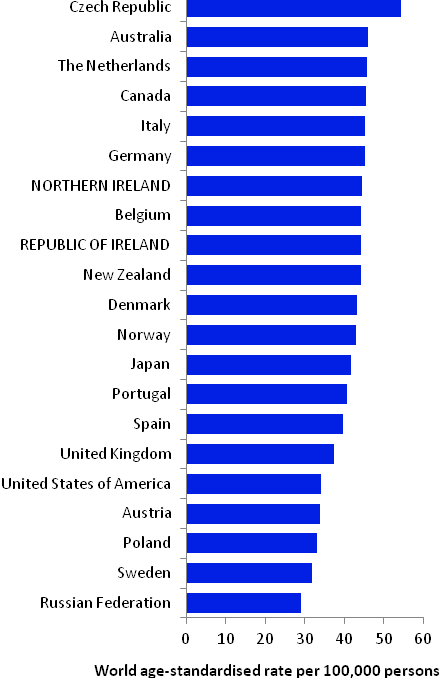 |
Source: GLOBOCAN 2008 (Ferlay et al., 2008) (excluding RoI and NI data, which is derived from cancer registry data for 2005-2007) | |
Table 5.2 Risk factors for colorectal cancer, by direction of association and strength of evidence
Increases risk | Decreases risk | |
Convincing or probable | Family history of colorectal cancer1,2 | Physical activity5,6,13 |
| Tobacco smoking3,4 | Hormone replacement therapy14 |
| Alcohol4 | Oral contraceptives14,15 |
| Greater body fatness, in particular, abdominal fatness5,6 | Aspirin and other non-steroidal anti-inflammatory drugs16 |
| Red and processed meat6 | Foods containing dietary fibre6 |
| Asbestos7 | Garlic6 |
| Ionizing radiation3,8 | |
Possible | Disinfection by-products in drinking water9 | Non starchy vegetables6,17 |
Helicobacter pylori infection10 | Fruit6,17 | |
Insulin-like growth factor-1 (IGF-1)11 | Folate18 | |
Diabetes12 | Fish6 | |
Coffee19 | ||
Vitamin B620,21 | ||
Soya22,23 | ||
Milk, dairy and/or calcium24 | ||
Vitamin D25,26 | ||
| ||
1 First degree relative(s) with colorectal cancer; 2 Johns and Houlston, 2001; 3 colon cancer only; 4 Secretan et al., 2009; 5 International Agency for Research on Cancer, 2002; 6 World Cancer Research Fund / American Institute for Cancer Research, 2007; 7 Straif et al., 2009; 8 El Ghissassi et al., 2009; 9 Rahman et al., 2010; 10 Zhao et al., 2008; 11 Rinaldi et al., 2010; 12 Larsson et al., 2005; 13 Harriss et al., 2009; 14 International Agency for Research on Cancer, 2011a; 15 Bosetti et al., 2009; 16 International Agency for Research on Cancer, 1997; 17 International Agency for Research on Cancer, 2003; 18 Kennedy et al., 2011; 19 Galeone et al., 2010; 20 intake and blood levels; 21 Larsson et al., 2010; 22 in women only; 23 Yan et al., 2010; 24 Huncharek et al., 2009; 25 blood levels; 26 Yin et al., 2009 | ||
Up to 10% of colorectal cancers are hereditary and most are due to the genetic syndromes of familial adenomatous polyposis (FAP) and hereditary non-polyposis colorectal cancer (HNPCC) (Hawkins and Ward, 2001). Excluding these syndromes, individuals who have a first degree relative with colorectal cancer have around a two-fold increased risk of developing the disease themselves.
Lifestyle factors are extremely important in colorectal cancer (Table 5.2). Smoking is causally related to colon, but not rectal, cancer. Alcohol is a cause of both colon and rectal cancers. Higher levels of body fatness, and in particular central adiposity, are positively related to risk. In a recent meta-analysis, each 5kg/m2 increment in body mass index was associated with an 18% increase in risk; the association appears stronger for colon than rectal cancer, for men than women, and in studies adjusting for physical activity (Ning et al., 2010). In contrast, physical activity is consistently inversely associated with colon cancer, in particular, and risk decreases in a dose-response fashion with increased frequency or intensity of activity. Regular use of aspirin or other non-steroidal anti-inflammatory drugs may reduce colorectal cancer risk by up to half. In addition, risk is decreased in women taking hormone replacement therapy and is likely also to be lower in those who have taken oral contraceptives.
Many studies have found increased risk in individuals who have higher intakes of processed meats (preserved by smoking, curing or salting, such as ham, bacon or salami) and red meats. In contrast, higher intake of various other dietary components may be associated with lower risk, including garlic; fruit; fish; non-starchy vegetables; milk, dairy products or calcium; coffee; soya and soya foods; and foods containing dietary fibre or the B vitamin folate.
Figure 5.3 Adjusted relative risks (with 95% confidence intervals) of colorectal cancer by socio-economic characteristics of geographic area of residence: males
| MalesAmong men there was no significant difference in risk of colorectal cancer between RoI and NI when adjusted for age alone. However, after adjustment for age and socio-economic factors colorectal cancer risk was lower in NI than in RoI (RR=0.92, 95%CI=0.89-0.96) (Figure 5.3). Male colorectal cancer was positively associated with population density, with men resident in the most densely populated areas 14% more likely to develop colorectal cancer than those in the least densely populated areas. Similarly, unemployment was associated with male colorectal cancer, with a steady increase in risk as unemployment in an area increased. Colorectal cancer risk was not related to area-based educational attainment. Persons resident in areas with the highest proportion of persons aged 75 and over living alone had a 10% greater risk of colorectal cancer than those resident in areas with the lowest proportion. |
Figure 5.4 Adjusted relative risks (with 95% confidence intervals) of colorectal cancer by socio-economic characteristics of geographic area of residence: females
| FemalesThere was no significant difference between RoI and NI in the risk of colorectal cancer for women when adjusted for age, or when adjusted for age and socio-economic factors (Figure 5.4). While female colorectal cancer risk was associated with population density, the association was weaker than for men, with the relative risk 4% greater in the most, compared to the least, densely populated areas. Neither unemployment nor educational attainment was associated with female colorectal cancer risk. Areas with higher proportions of persons aged 75 and over living alone had a greater risk of female colorectal cancer. This relationship was slightly stronger for women than men. |
Although the geographical variation in relative risk was fairly modest, there were distinct areas of higher relative risk for colorectal cancer for both men and women (Maps 5.1-5.3).
The pattern for both sexes combined showed a higher relative risk around Cork city and county, with a diffuse pattern in the north extending in a band from Donegal across to Dublin and to a lesser extent in south Waterford and Wexford (Map 5.1).
The pattern for men also showed higher relative risk around Cork and extending south-west, with a second area of higher relative risk in the east, centred on Louth, Meath, Dublin, Newry and Mourne and Down (Map 5.2). There were some smaller areas of higher risk in Waterford, Wexford, Mayo and Derry.
For women, areas of higher risk were principally in the north between east Donegal and north-east Louth, as well as in Dublin city and in Cork city and surrounds. Areas of low relative risk were mostly located in the west (Map 5.3).
Map 5.1 Colorectal cancer, smoothed relative risks: both sexes
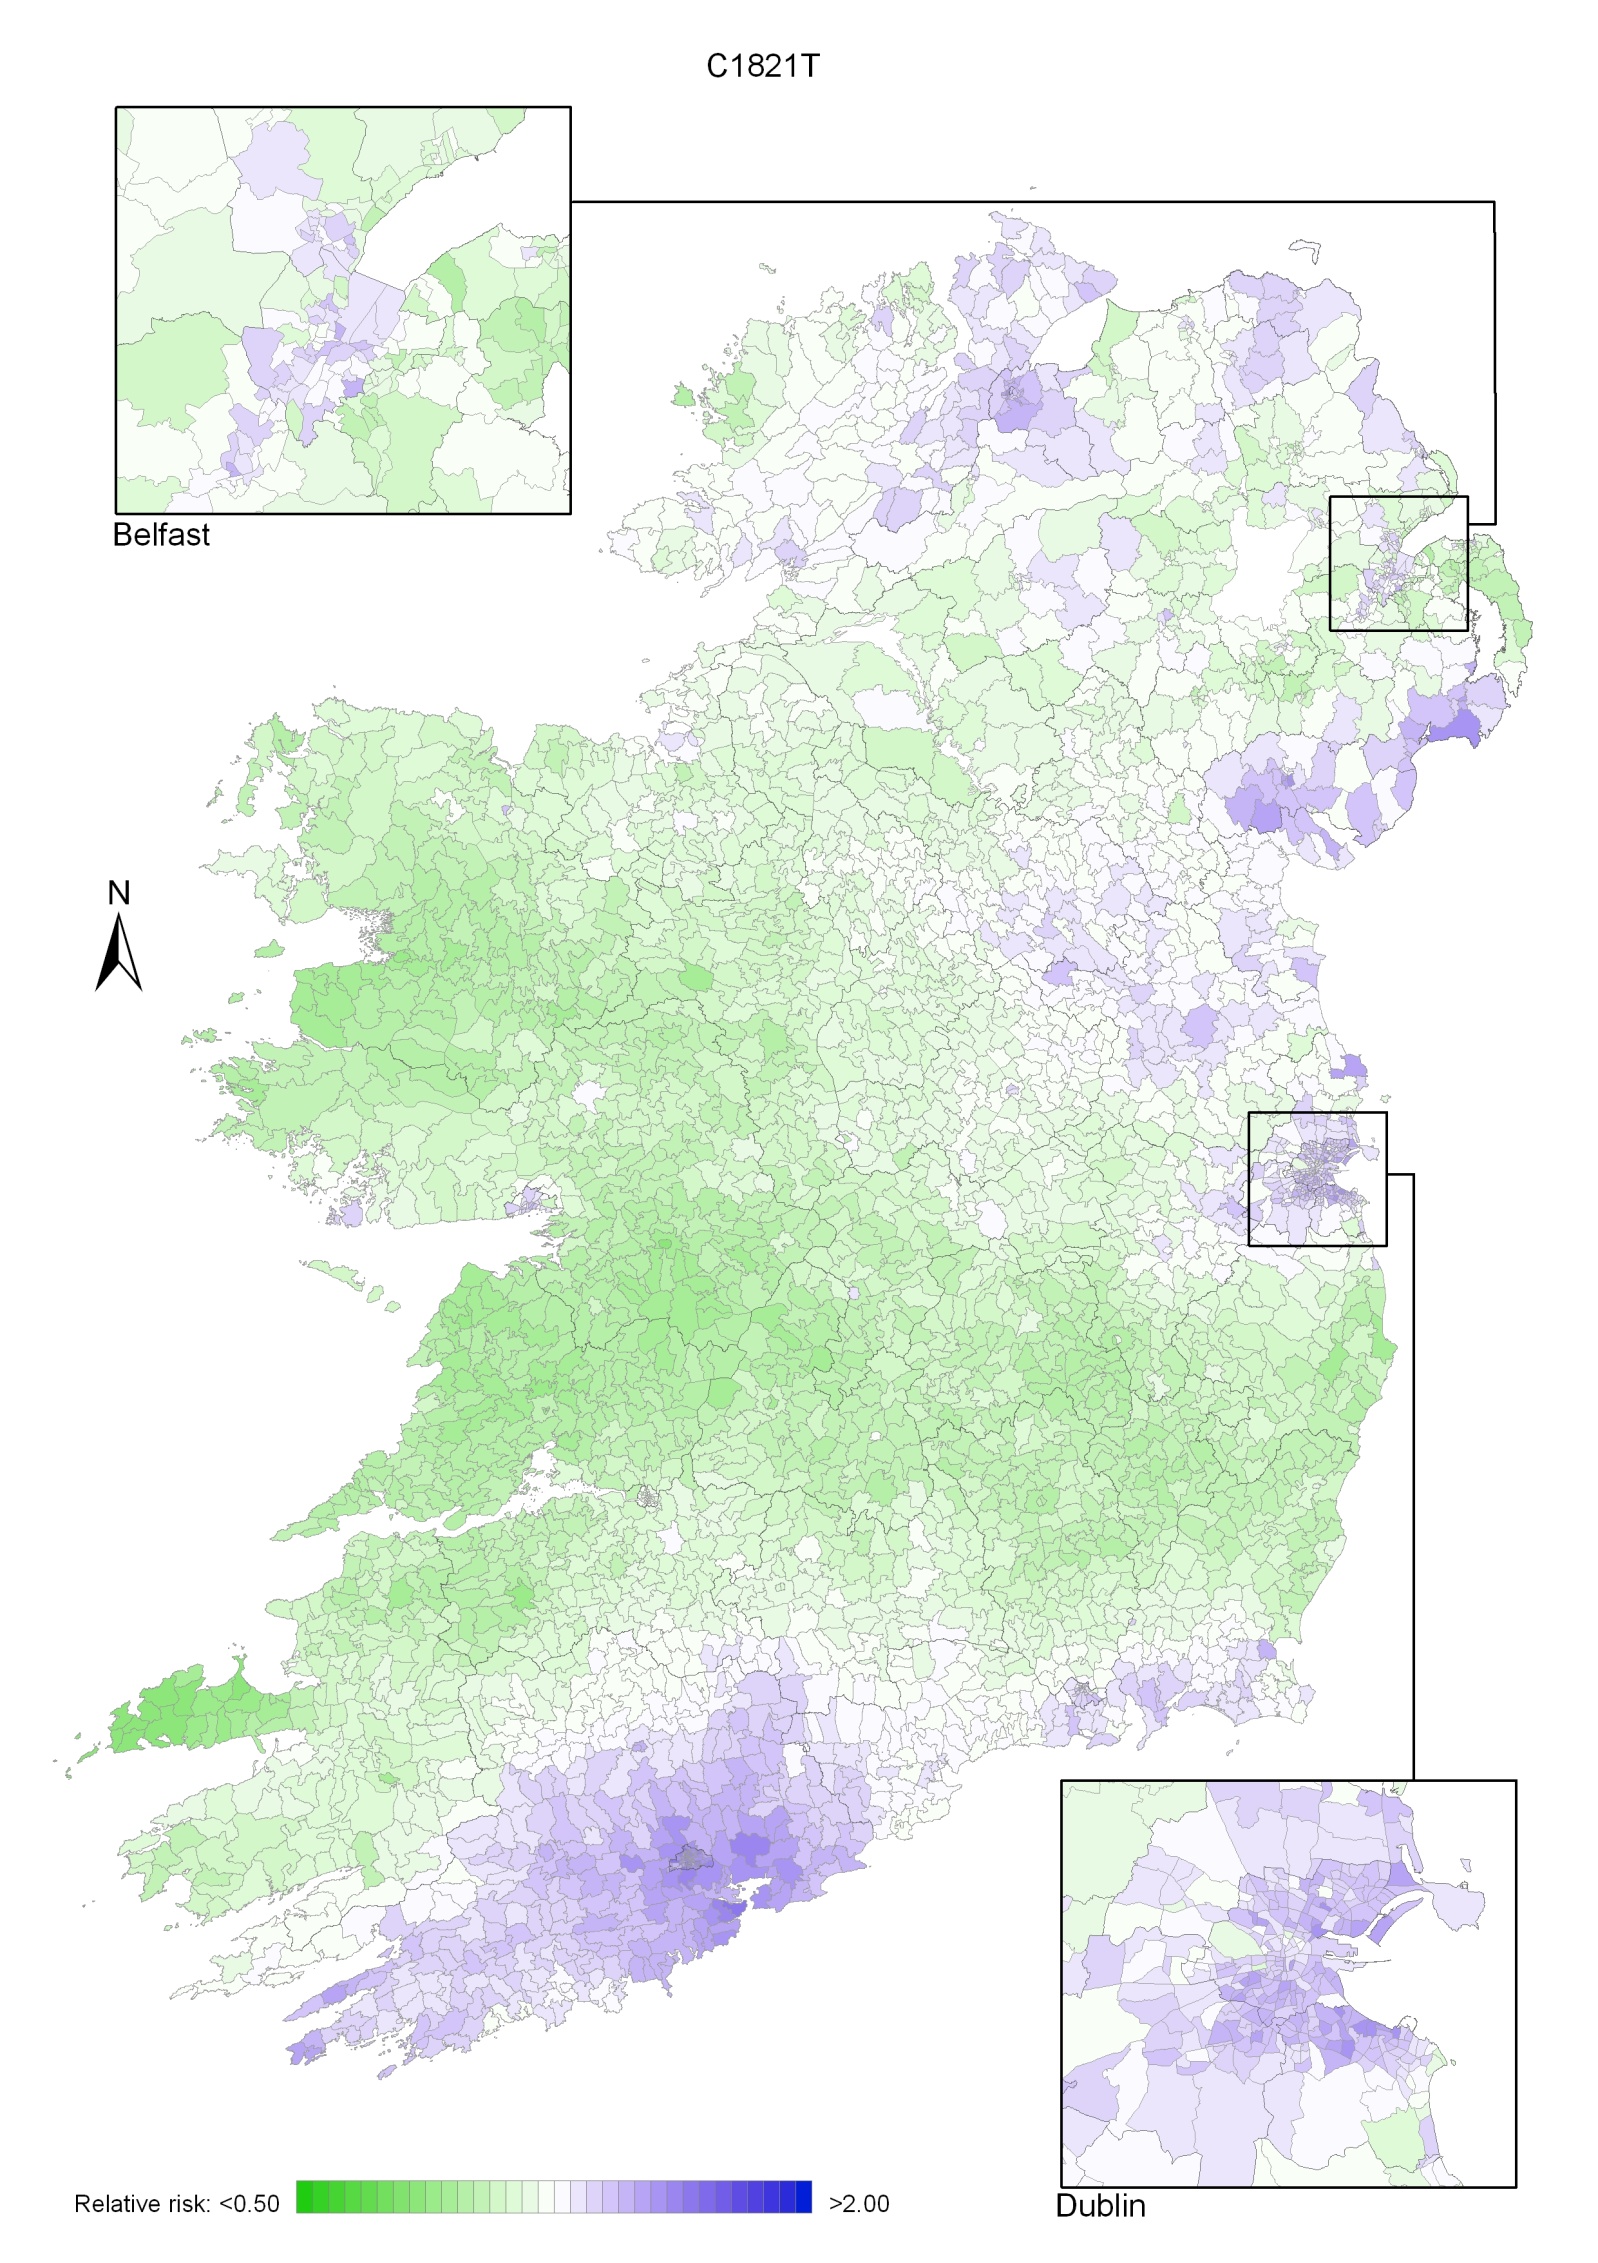
Map 5.2 Colorectal cancer, smoothed relative risks: males
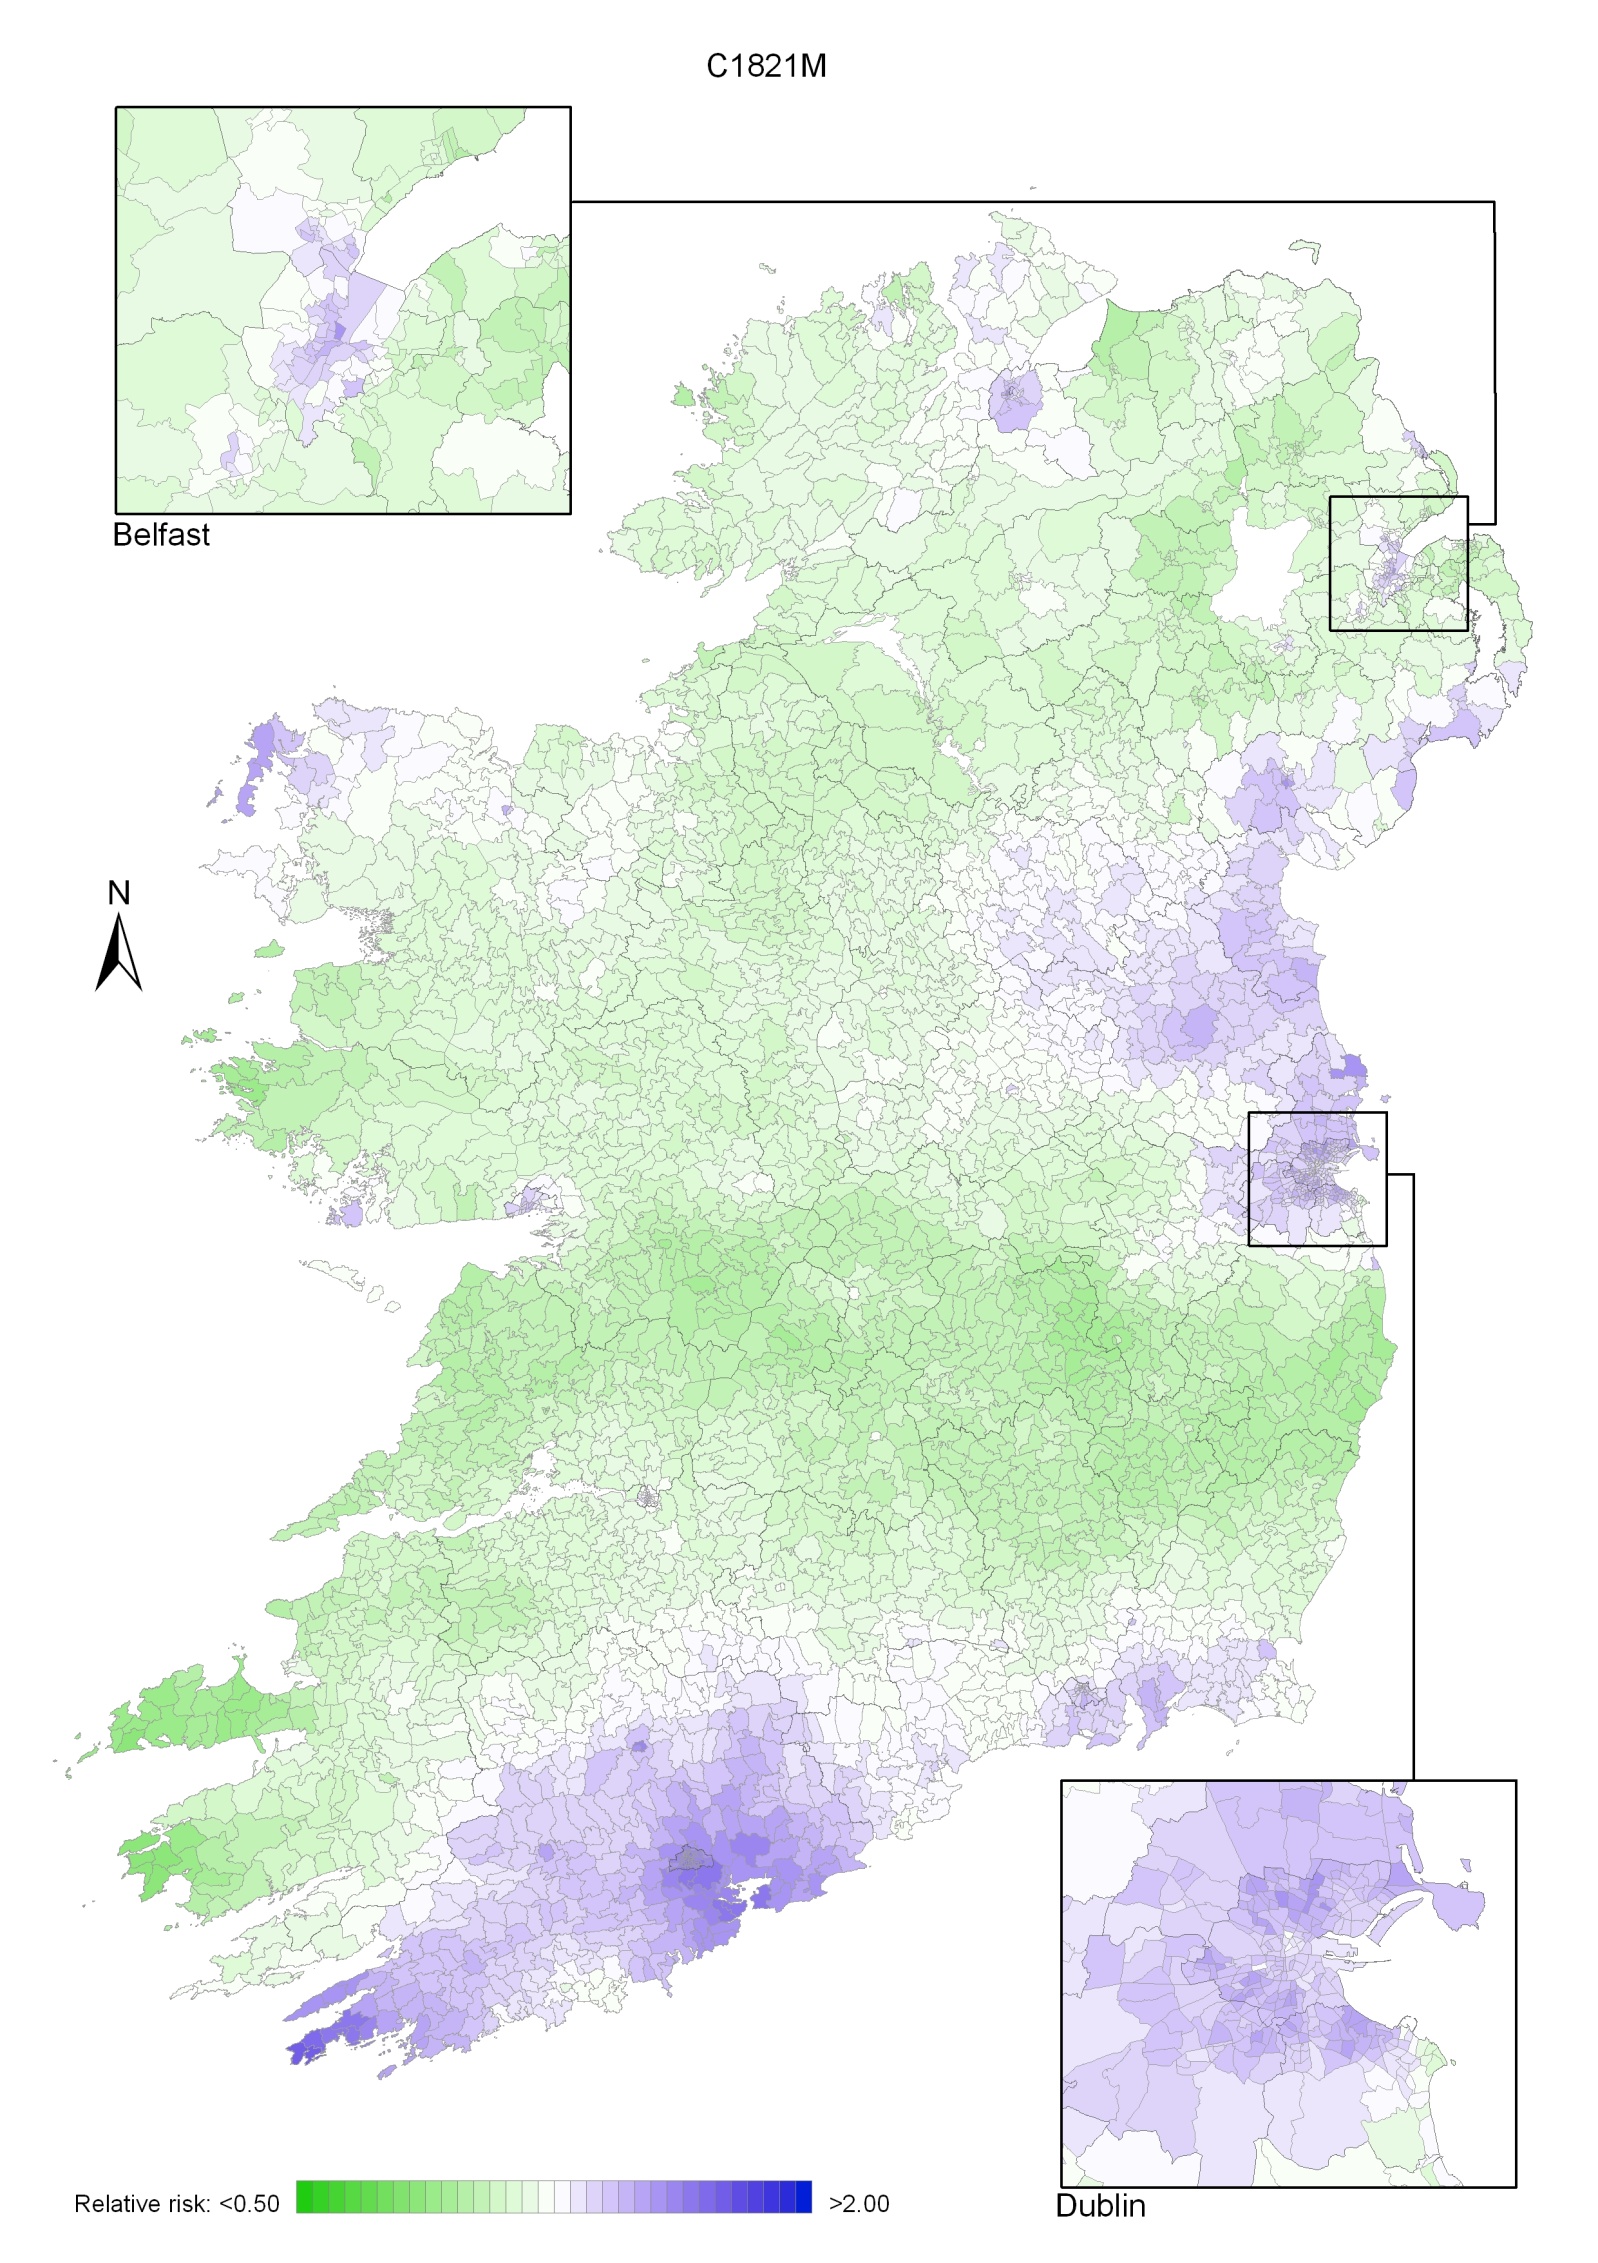
Map 5.3 Colorectal cancer, smoothed relative risks: females
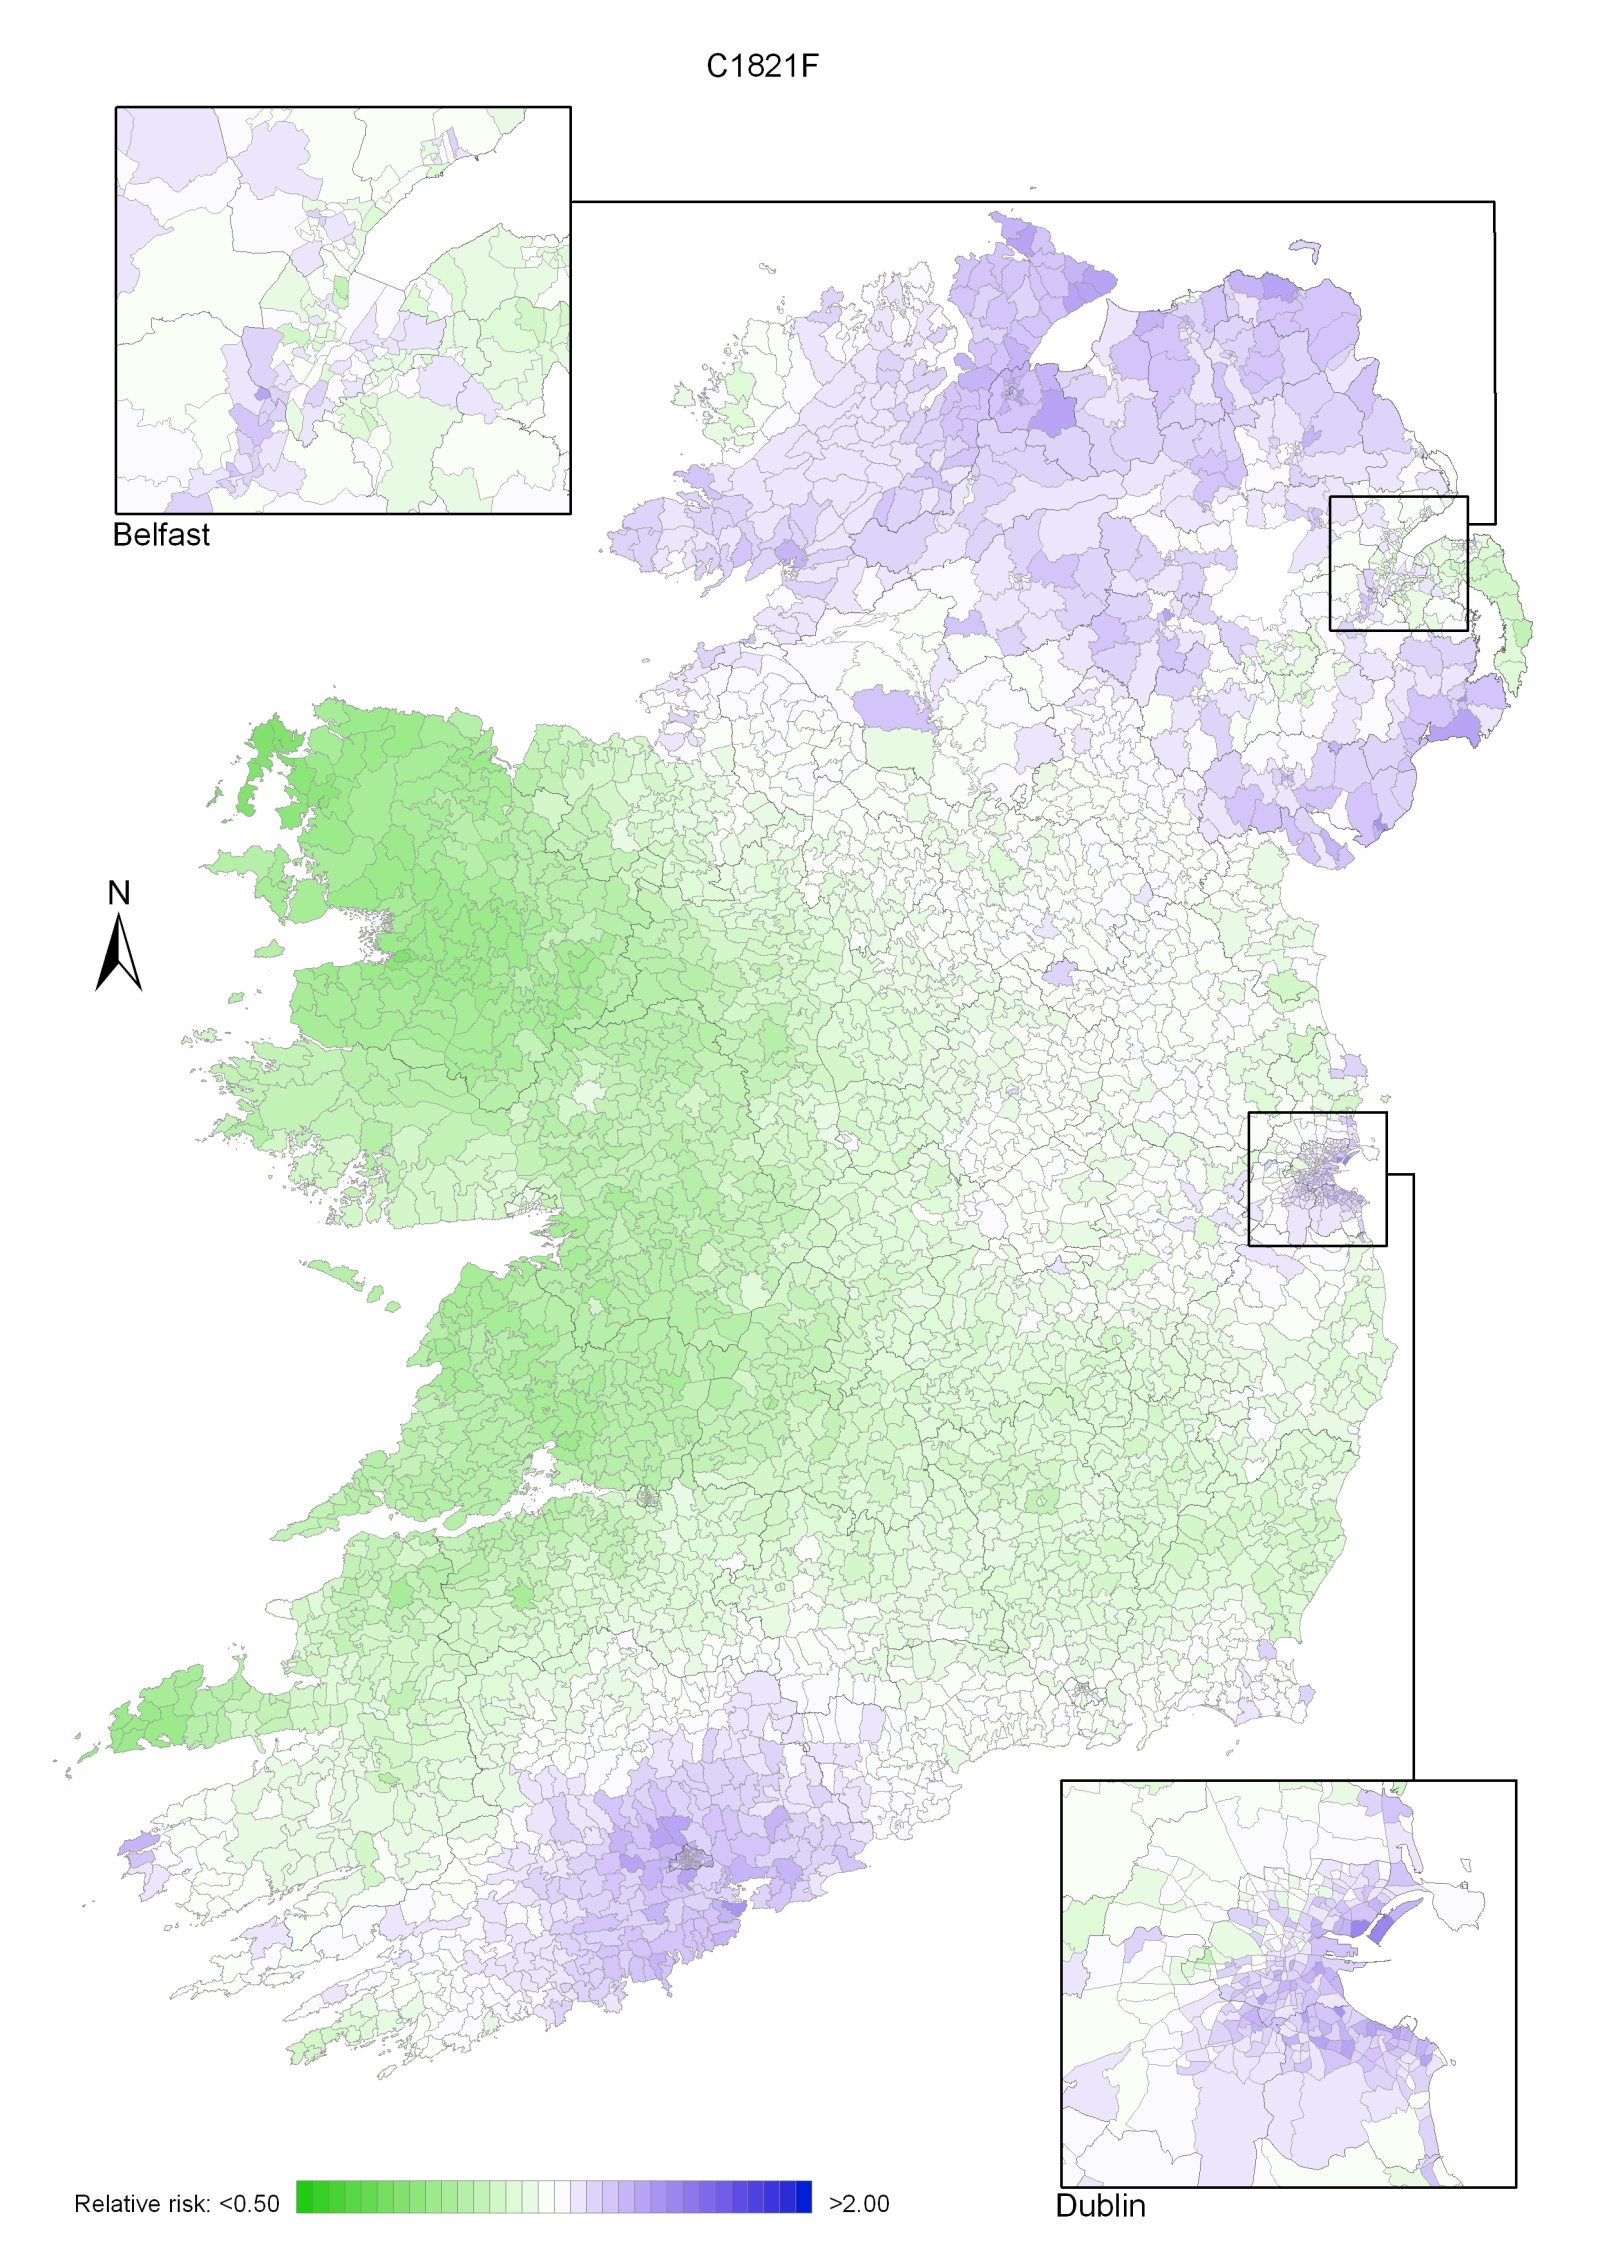
Lung cancer was the third most common cancer in Ireland, accounting for 10% of all malignant neoplasms, excluding non-melanoma skin cancer, in women and 15% in men (Table 6.1). The average number of new lung cancer cases diagnosed each year was 1,000 in women and 1,602 in men. During 1995-2007, the number of new cases diagnosed increased by approximately 3% per annum for women and 1% for men.
The risk of developing lung cancer up to the age of 74 was 1 in 37 for women and 1 in 20 for men, and was higher in NI than in RoI for both males and women. At the end of 2008, 708 women and 768 men aged under 65, and 1,330 women and 1,577 men aged 65 and over, were alive up to 15 years after their lung cancer diagnosis.
Table 6.1 Summary information for lung cancer in Ireland, 1995-2007
Ireland | RoI | NI | ||||
females | males | females | males | females | males | |
% of all new cancer cases | 7% | 11% | 7% | 10% | 8% | 12% |
% of all new cancer cases excluding non-melanoma skin cancer | 10% | 15% | 9% | 14% | 10% | 16% |
average number of new cases per year | 1000 | 1602 | 649 | 1052 | 351 | 551 |
cumulative risk to age 74 | 2.7% | 5.1% | 2.6% | 4.9% | 2.9% | 5.5% |
15-year prevalence (1994-2008) | 2038 | 2345 | 1394 | 1565 | 644 | 780 |
Lung cancer is mostly a disease of older people—the majority of cases occurred in those aged 70 and over (Figure 6.1). Less than 5% of cases presented in persons aged under 50.
Figure 6.1 Age distribution of lung cancer cases in Ireland, 1995-2007, by sex
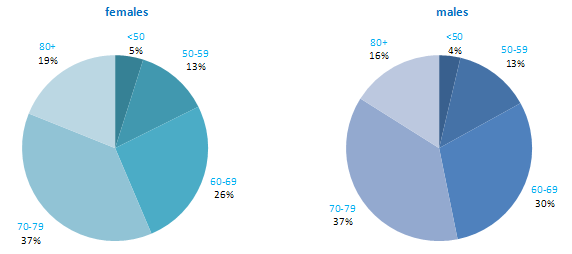
Incidence rates for lung cancer varied considerably among developed countries, particularly among men (Figure 6.2). Poland demonstrated the highest male rates, while USA, Denmark and Canada had the highest female rates. Rates were lowest among men in Sweden, and in Portugal and Russia among women. Lung cancer risk in both RoI and NI was close to the median compared to other developed countries for men, but was slightly above the median for women.
Figure 6.2 Estimated incidence rate per 100,000 in 2008 for selected developed countries compared to 2005-2007 incidence rate for RoI and NI: lung cancer | |
| females | males |
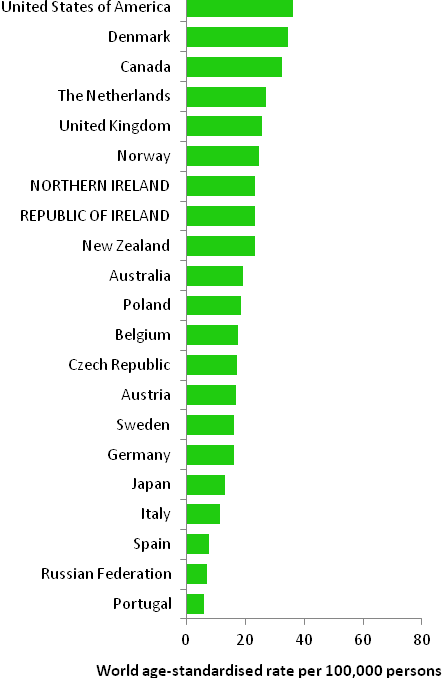 | 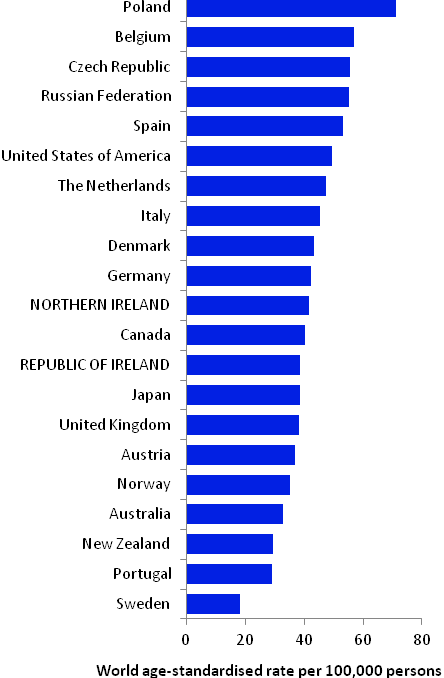 |
Source: GLOBOCAN 2008 (Ferlay et al., 2008) (excluding RoI and NI data, which is derived from cancer registry data for 2005-2007) | |
Table 6.2 Risk factors for lung cancer, by direction of association and strength of evidence
Increases risk | Decreases risk | |
Convincing or probable | Tobacco smoking and involuntary (passive) smoking1 | Fruit18 |
| Radon2 | |
| Ionizing radiation2 | |
| Arsenic and arsenic compounds; asbestos; beryllium and beryllium compounds; cadmium and cadmium compounds; chromium compounds; nickel compounds; silica dust; and polycyclic aromatic hydrocarbons (PAHs)3-7 | |
| Employment as a painter8 | |
| Beta-carotene supplements9,10 | |
| History of tuberculosis11 | |
| Indoor emissions from household combustion of coal1,12 | |
| Low socio-economic status13 | |
| Family history of lung cancer14,15 | |
Possible | Alcohol16 | Physical activity18,25 |
Coffee17 | Non-starchy or cruciferous vegetables18,26 | |
Low body fatness/leanness18 | Flavonoids from foods27 | |
Infection with chlamydia pneumoniae or Helicobacter pylori19,20 | Green tea28 | |
Occupational exposure to diesel motor exhaust or organic dust21,22 | Employment in cotton textile and agriculture industries29 | |
Hormone replacement therapy23,24 | Aspirin and other non-steroidal anti-inflammatory drugs30 | |
| ||
1 Secretan et al., 2009; 2 El Ghissassi et al., 2009; 3 Celik et al., 2008; 4 Baan et al., 2009; 5 Lacasse et al., 2009; 6 Straif et al., 2009; 7 main route of exposure is occupational; 8 Guha et al., 2010; 9 in current smokers; 10 Tanvetyanon and Bepler, 2008; 11 Liang et al., 2009; 12 Hosgood et al., 2010; 13 Sidorchuk et al., 2009; 14 one or more relative(s) with lung cancer; 15 Lissowska et al., 2010; 16 Uehara and Kiyohara, 2010; 17 Tang et al., 2010; 18 World Cancer Research Fund / American Institute for Cancer Research, 2007; 19 Zhan et al., 2011; 20 Zhuo et al., 2009; 21 Olsson et al., 2011; 22 Peters et al., 2011; 23 in non-smoking women; 24 Greiser et al., 2010; 25 International Agency for Research on Cancer, 2002; 26 Lam et al., 2009; 27 Tang et al., 2009a; 28 Tang et al., 2009b; 29 Lenters et al., 2010; 30 Bosetti et al., 2006 | ||
Smoking is the principal cause of lung cancer (Table 6.2). In populations with prolonged cigarette use, 90% of lung cancer cases are due to cigarette smoking (International Agency for Research on Cancer, 2004b). Risk increases with younger age at smoking commencement and longer duration of smoking. Stopping smoking, at any age but particularly so before middle age, avoids most of the subsequent risk (Peto et al., 2000). In addition, involuntary exposure to tobacco smoke (passive smoking) is a cause of lung cancer in those who have never smoked. The consistent relationship between higher lung cancer risk and lower socio-economic status probably reflects social class variations in tobacco exposure.
The chances of developing lung cancer are increased in those exposed to radon, ionizing radiation and a variety of chemicals and compounds. Various lifestyle factors (such as alcohol intake, physical activity, leanness and aspects of diet) may be related to lung cancer, but it is not always possible to rule out the possibility that the associations are due to a residual effect of smoking.
Figure 6.3 Adjusted relative risks (with 95% confidence intervals) of lung cancer by socio-economic characteristics of geographic area of residence: males
| MalesAmong men lung cancer risk was higher in NI than RoI (RR=1.11, 95%CI=1.06-1.16) (Figure 6.3). This difference disappeared when adjusted for population density and socio-economic characteristics. There was a strong association between population density and lung cancer for men, with the risk 54% greater in high density than in low density areas. Electoral wards and districts with the highest levels of unemployment had higher rates of male lung cancer than those with the lowest levels. The relative risk between the highest and lowest quintiles was 1.40 (95%CI=1.32-1.49). A strong association also existed between lower educational attainment and male lung cancer. Men in areas with the poorest education levels had a 32% greater risk of lung cancer than men living in the areas with the highest level of educational attainment. Areas with the highest proportions of elderly living alone also had an elevated risk of lung cancer among men. |
Figure 6.4 Adjusted relative risks (with 95% confidence intervals) of lung cancer by socio-economic characteristics of geographic area of residence: females
| FemalesAmong women, lung cancer risk was higher in NI compared to RoI (RR=1.07, 95%CI=1.01-1.13) (Figure 6.4). However, adjusting for population density and socio-economic factors reversed this relationship, with risk lower in NI (RR=0.92, 95%CI=0.88-0.97). For women the association between lung cancer and population density was greater than for men, with lung cancer risk 74% higher in high density compared to low density areas. Lung cancer among women was higher in areas of high unemployment, lower levels of degree level education and with a high proportion of elderly living alone. The relative risk for people living in areas with the highest proportion of these indicators was 45%, 23% and 9% respectively, compared to the areas with the lowest proportion of these indicators. |
The geographical pattern of the relative risk of lung cancer was similar for men and women (Maps 6.1-6.3).
For both sexes combined, areas of higher relative risk were seen in Leinster, including Dublin (north and west), Kildare, Carlow, Longford, Louth, Wicklow, Wexford and Westmeath. Belfast city, Derry and Donegal also showed higher relative risk; other scattered areas of higher risk included Cork, Galway, Waterford, Newry and Mourne, Down, Ards, Carrickfergus, Larne and Moyle. In Dublin, the risk was higher in the north and south-west of the city and, in Belfast, in the central city area (Map 6.1).
In Dublin city, the risk was higher on the north side and, in Belfast, in the north and west areas. The pattern for men was similar to that for both sexes combined, due to the higher incidence in men compared to women (Map 6.2).
The pattern for women showed higher relative risk in Leinster, concentrated in Dublin, Kildare, Carlow, Wicklow, Wexford and Louth, and in the Belfast and Derry areas. There were some smaller areas of higher risk in Donegal, Carrickfergus, Newry and Mourne and Down (Map 6.3).
Map 6.1 Lung cancer, smoothed relative risks: both sexes
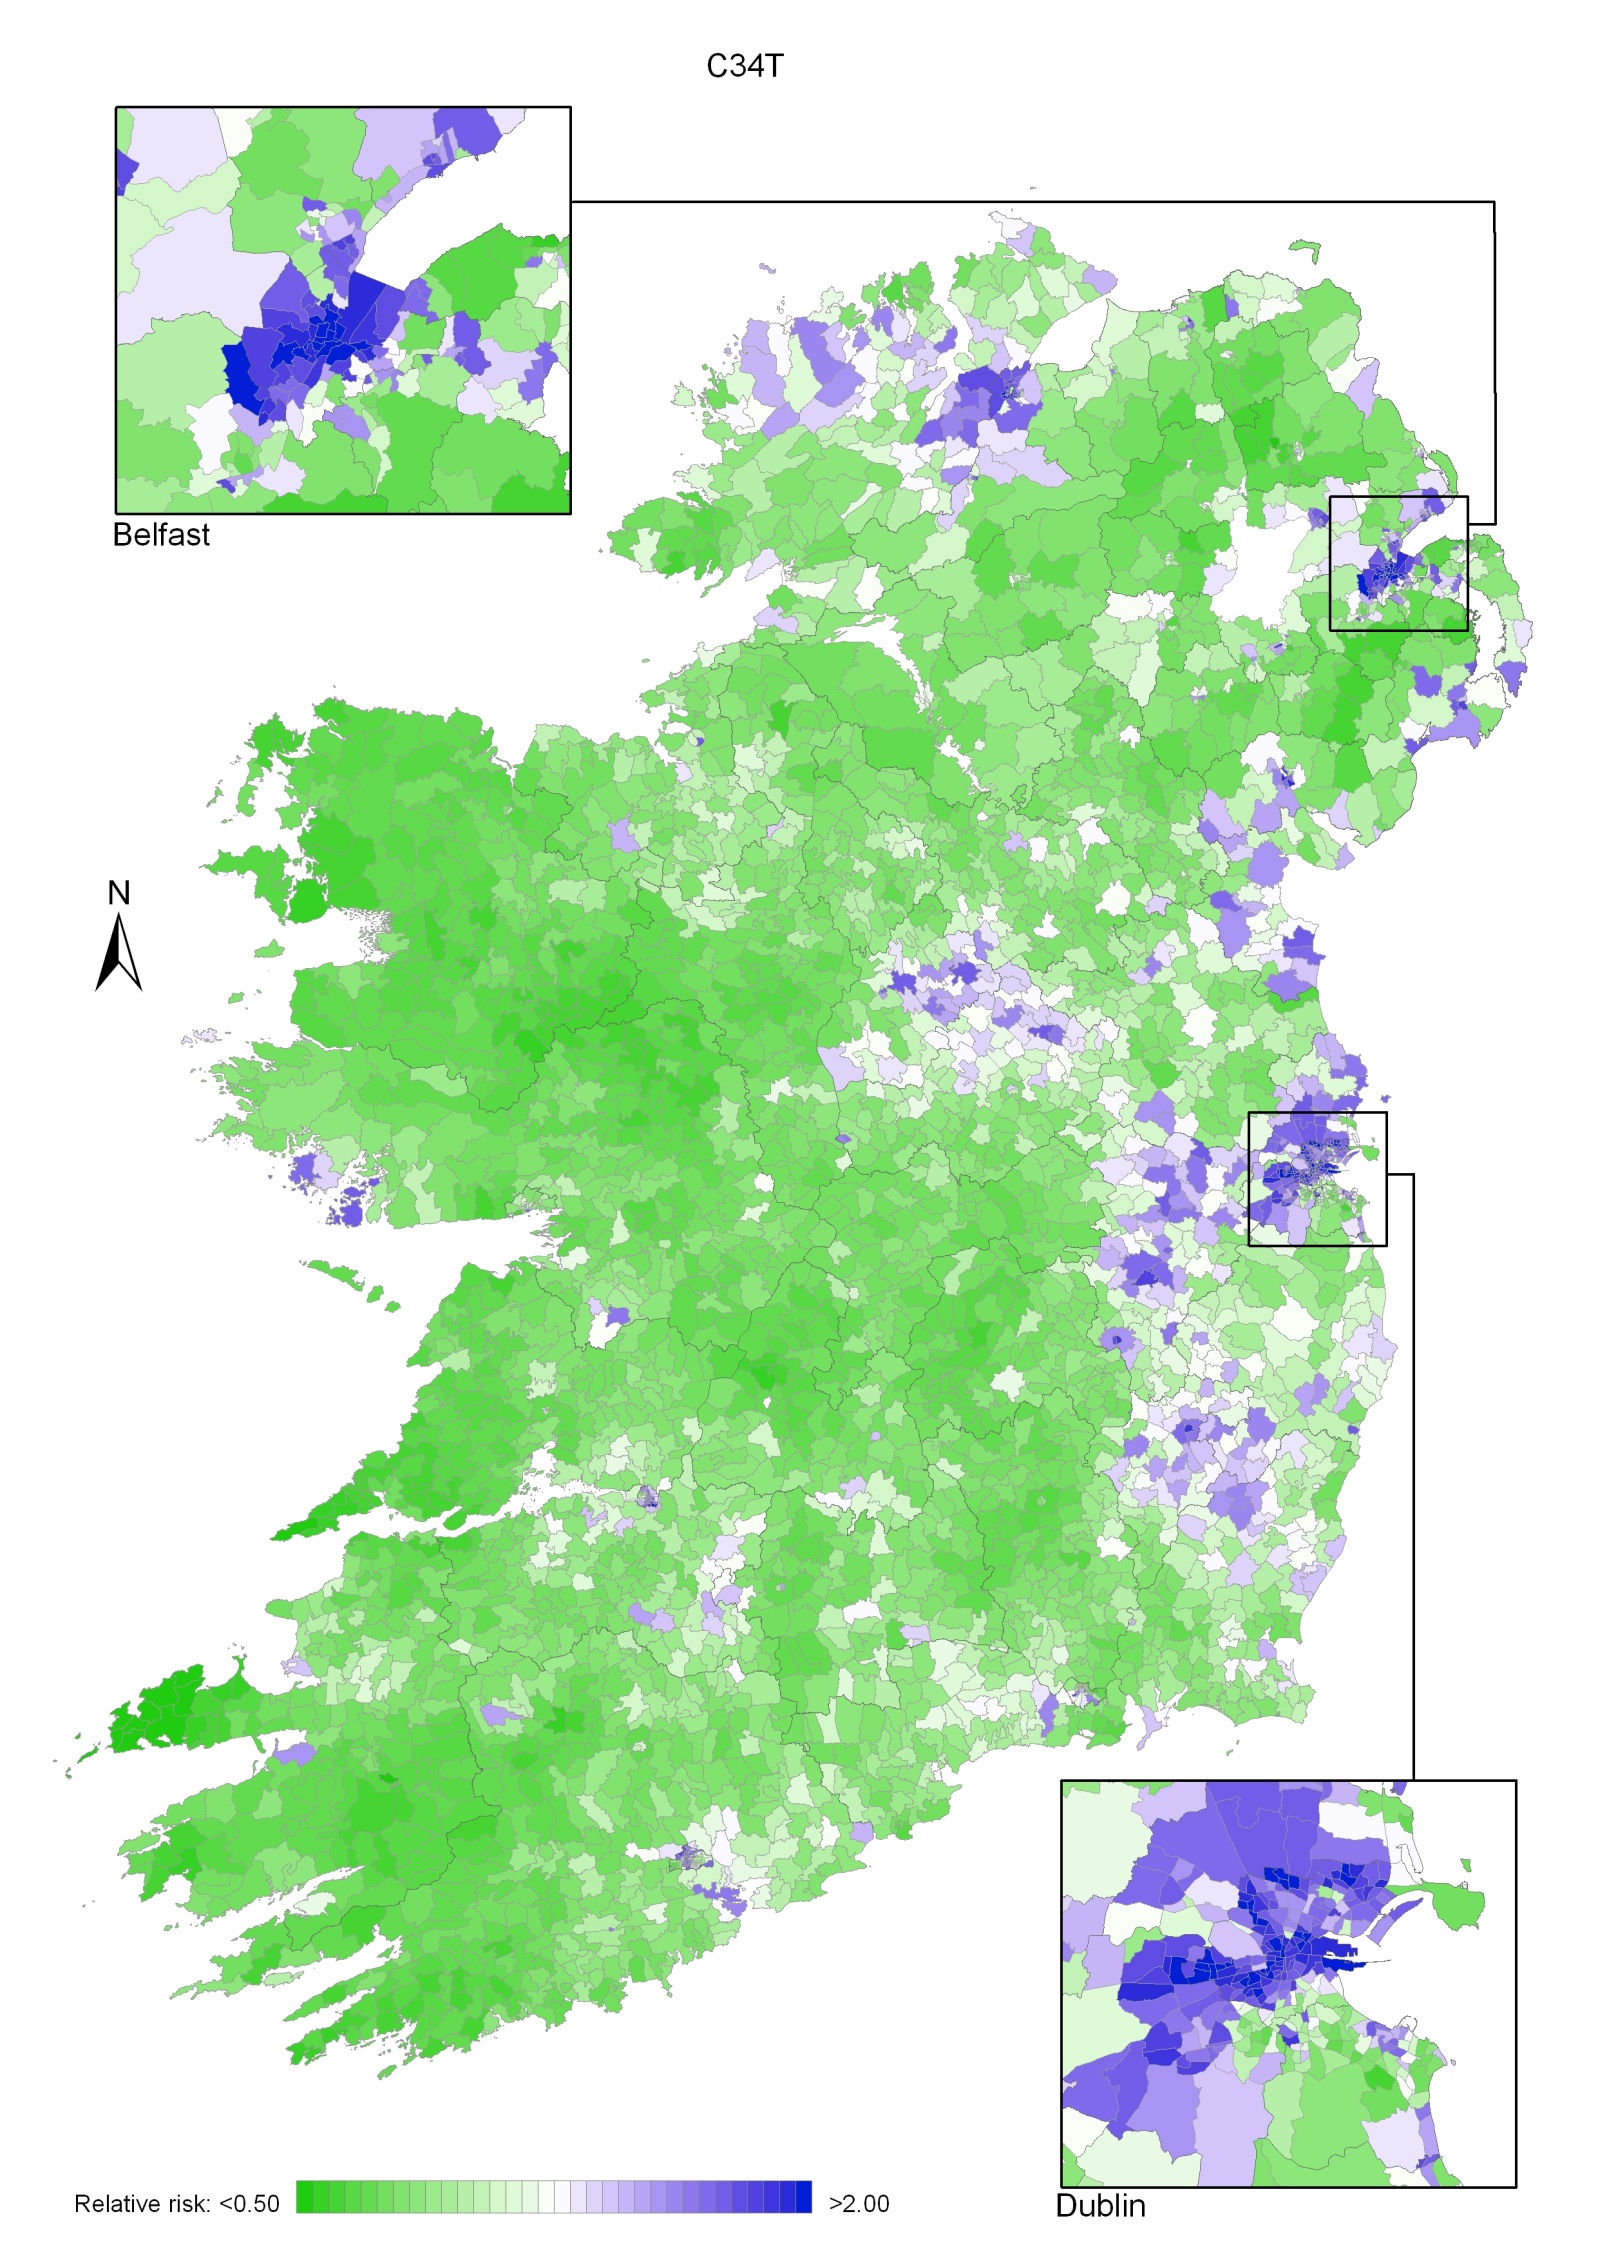
Map 6.2 Lung cancer, smoothed relative risks: males
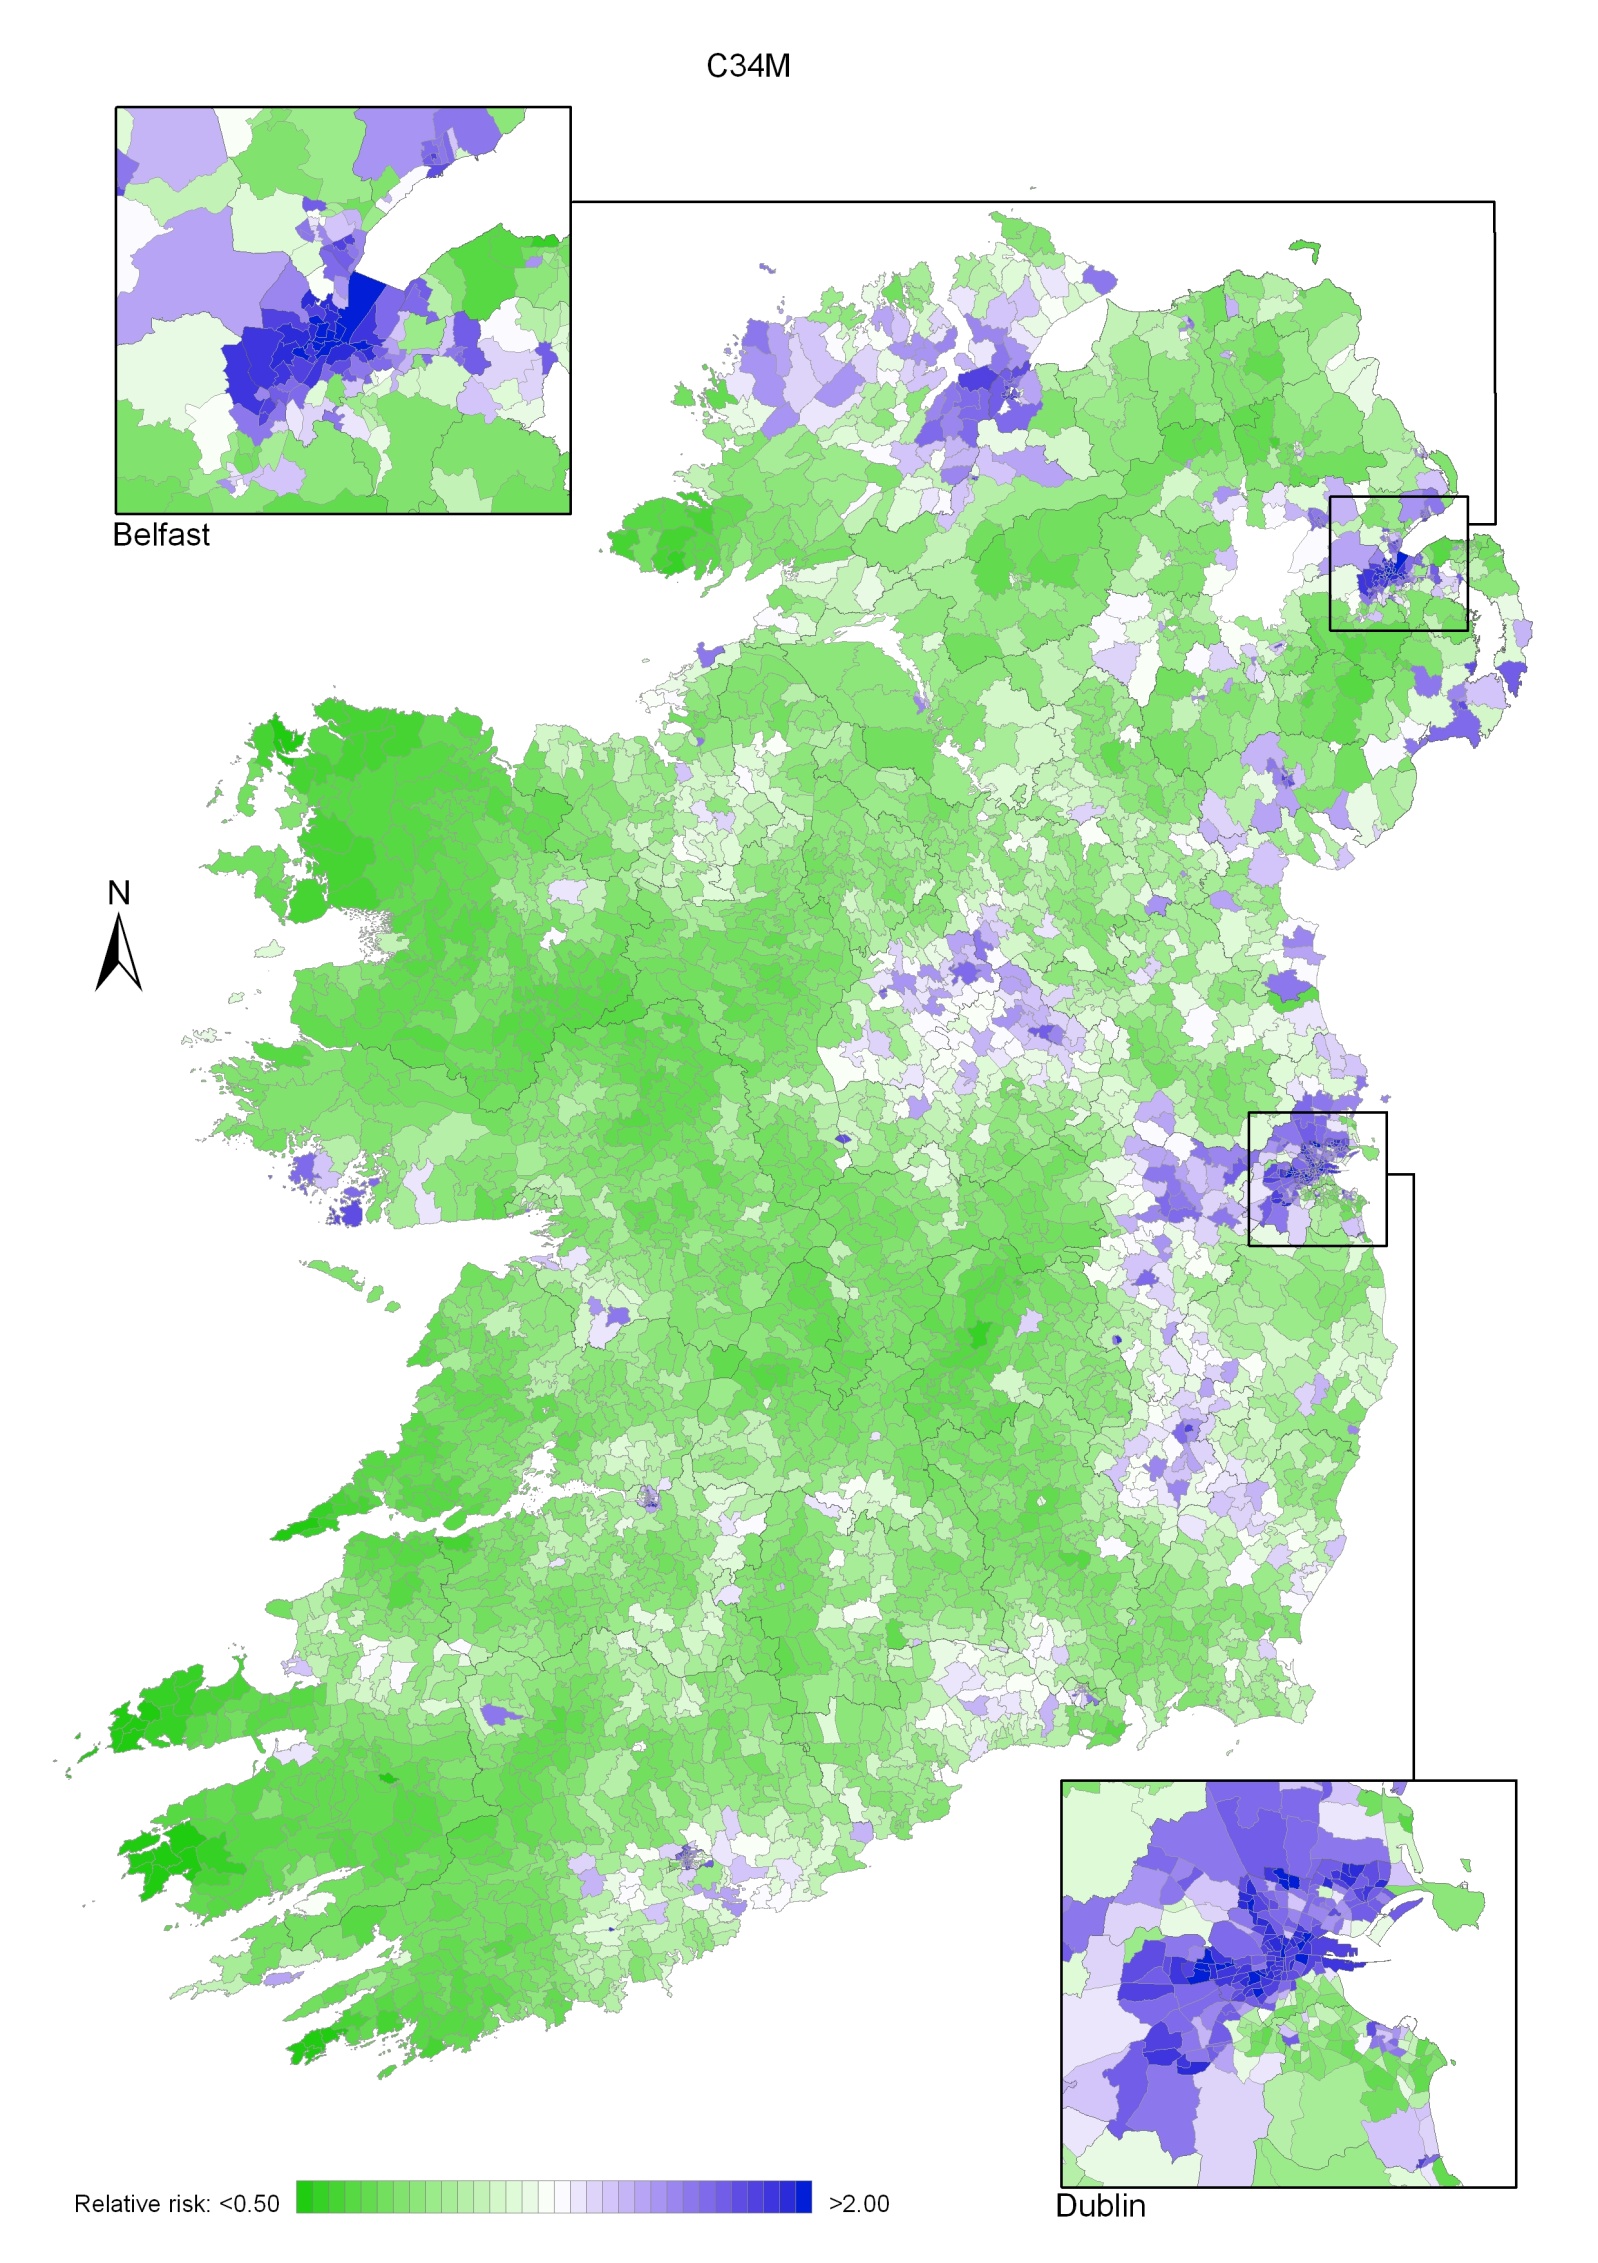
Map 6.3 Lung cancer smoothed relative risks: females
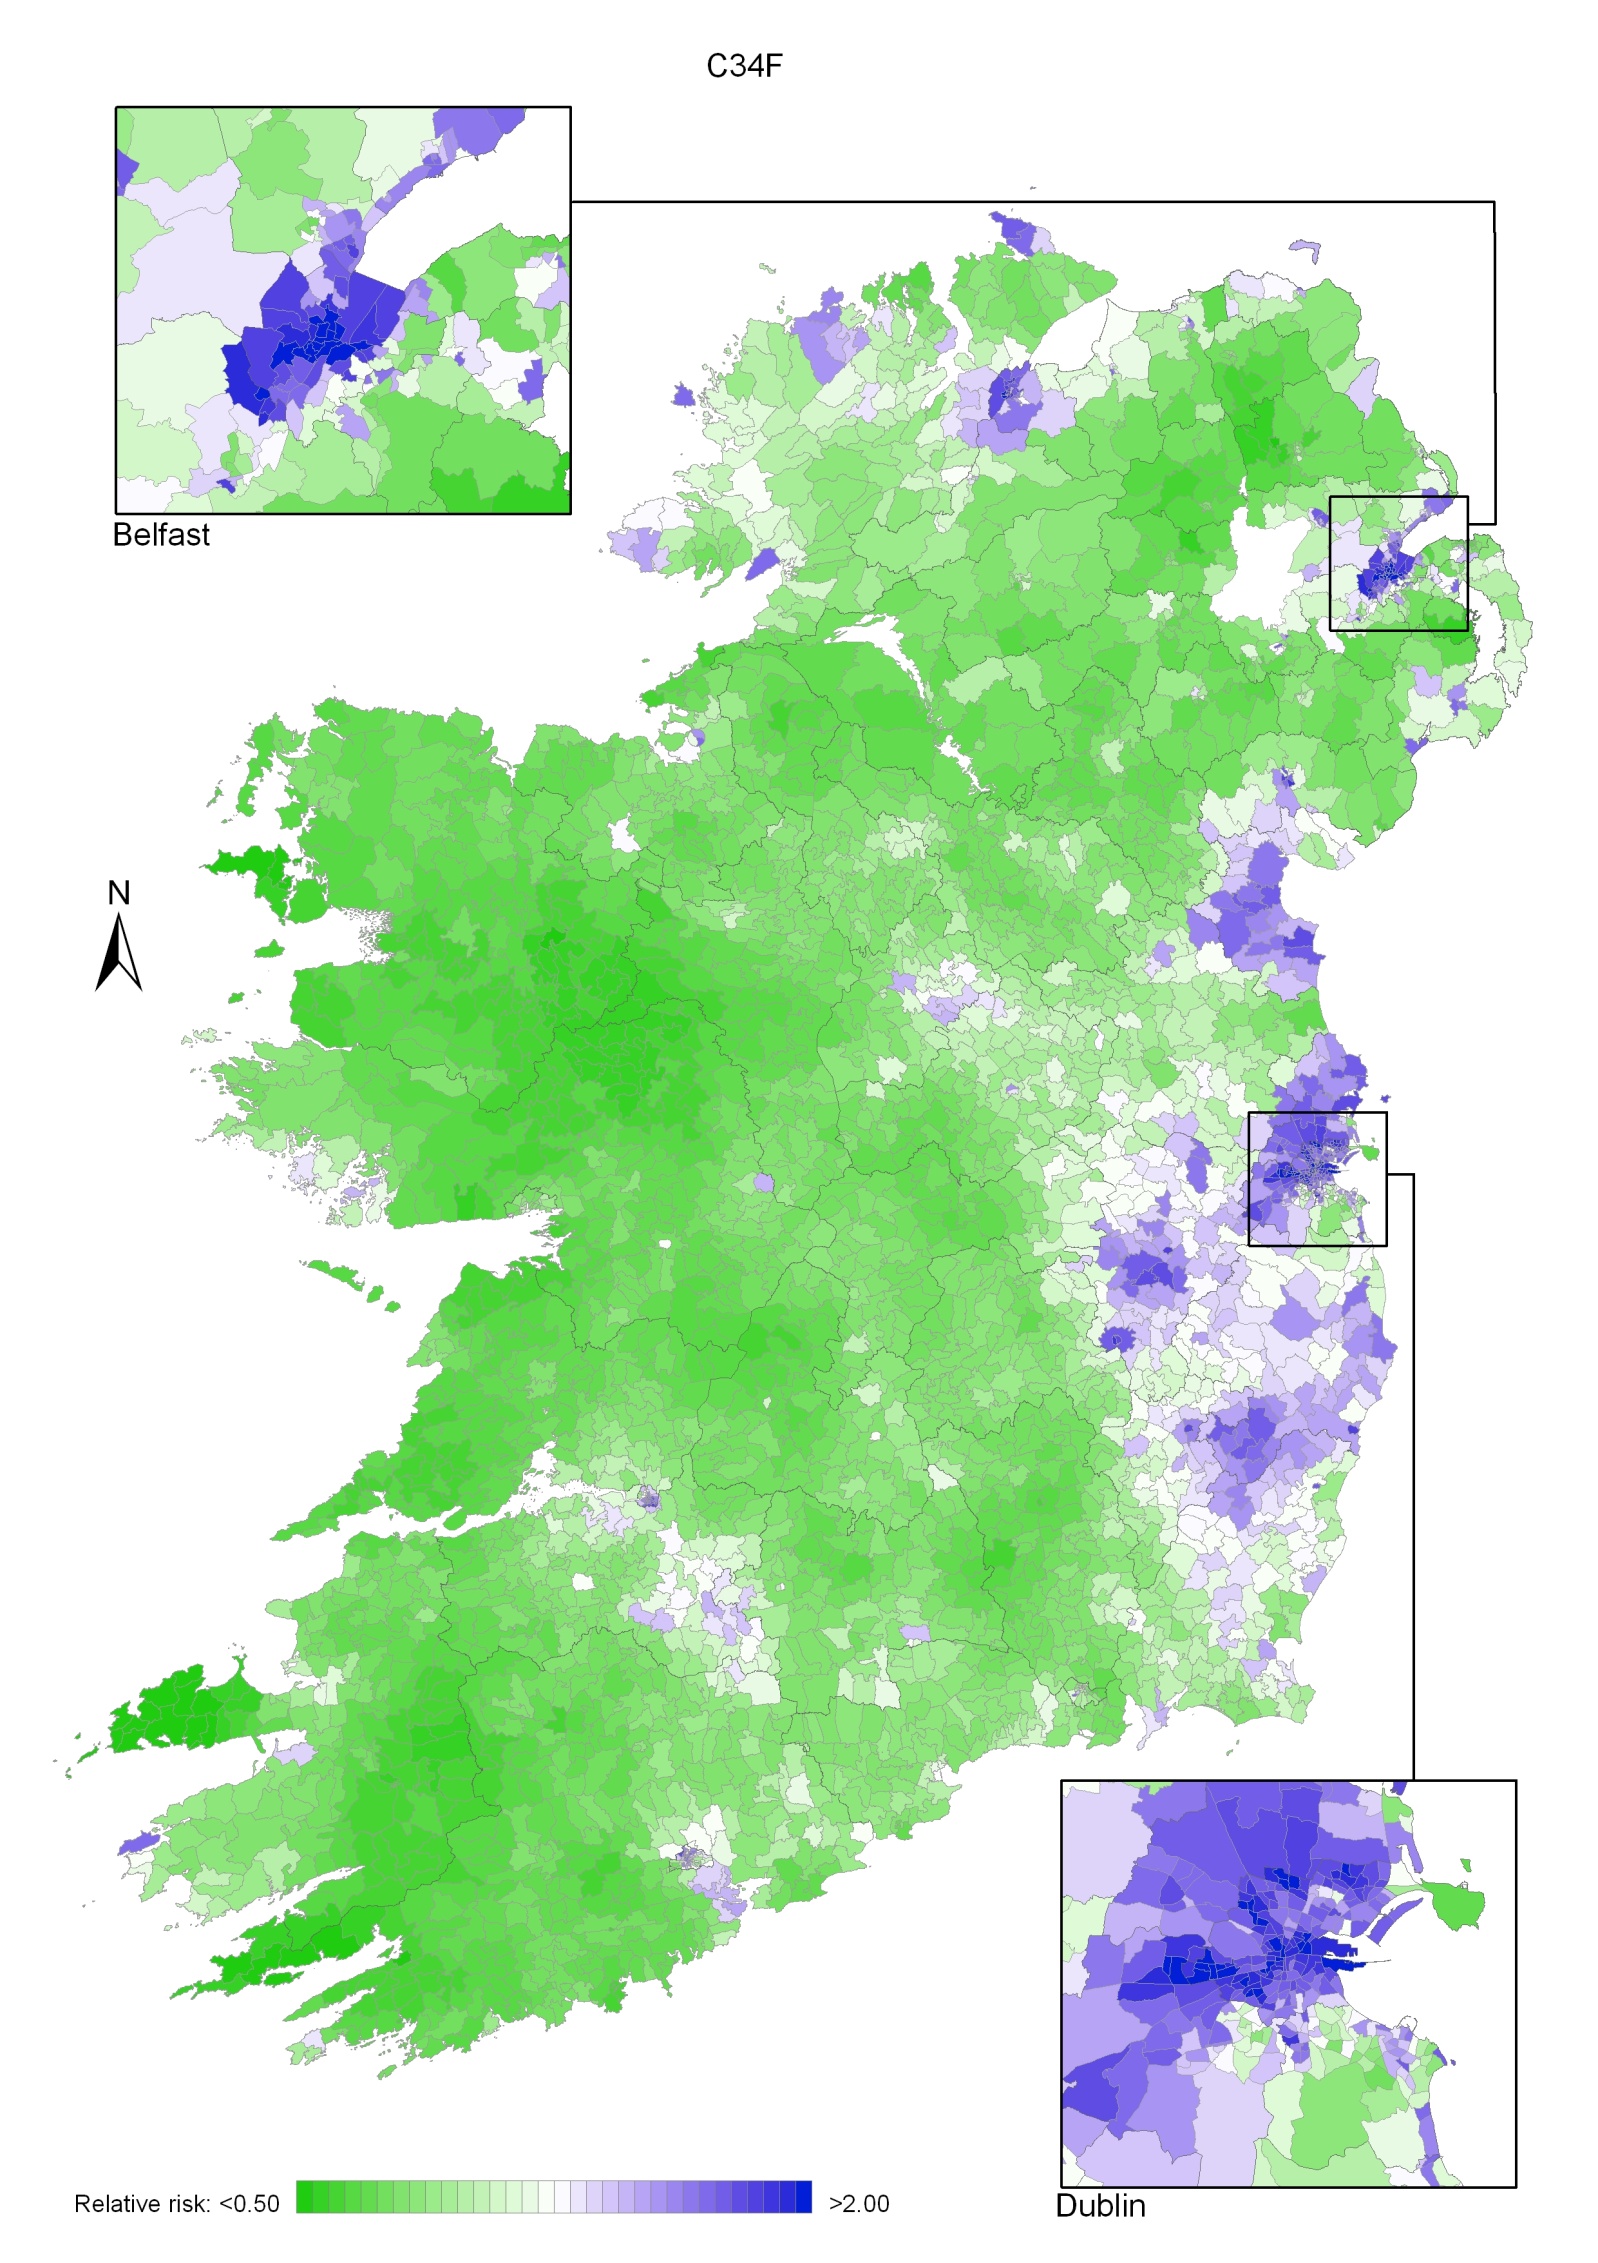
Prostate cancer was the most common cancer in men, accounting for 23% of all malignant neoplasms, excluding non-melanoma skin cancer, in men in Ireland (Table 7.1). The average number of new cases diagnosed each year was 2,550. Between 1995 and 2007, the number of new cases more than doubled, increasing by approximately 7% per annum. From 1995 to 2001, the number of new cases diagnosed per annum rose by approximately 9% in RoI and by 2% in NI. From 2002 to 2007 the annual increase was 5% in RoI and 6% in NI.
The risk of developing prostate cancer up to the age of 74 was 1 in 13 and was higher in RoI than in NI. At the end of 2008, 5,235 males aged under 65 and 17,829 aged 65 and over were alive up to 15 years after their prostate cancer diagnosis.
Table 7.1 Summary information for prostate cancer in Ireland, 1995-2007
Ireland | RoI | NI | |
% all new cancer cases | 17% | 18% | 14% |
% all new cancer cases excluding non-melanoma skin cancer | 23% | 25% | 19% |
average number of new cases per year 1995-2007 | 2550 | 1900 | 649 |
average number of new cases per year 1995-2001 | 1955 | 1439 | 517 |
average number of new cases per year 2002-2007 | 3243 | 2439 | 804 |
cumulative risk to age 74 | 8.0% | 8.9% | 6.0% |
15-year prevalence (1994-2008) | 23064 | 17430 | 5634 |
Prostate cancer is predominantly a disease of old age. Just over 1% of cases presented in those aged under 50, while 87% occurred in those aged 60 and older (Figure 7.1). Age at diagnosis was slightly older in NI than in RoI, with 60% aged 70 and over at diagnosis in NI compared with 53% in RoI.
Figure 7.1 Age distribution of prostate cancer cases in Ireland, 1995-2007
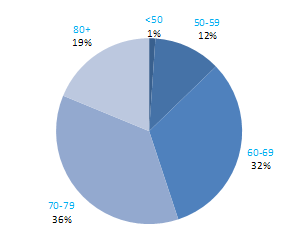
Considerable variation exists in prostate cancer incidence rates among developed countries. Estimates for 2008 ranged from 105 per 100,000 men in Australia to 23 per 100,000 in Japan (Figure 7.2). The rate in RoI was in the upper third of the range, while that in NI was in the lower third.
Figure 7.2 Estimated incidence rate per 100,000 in 2008 for selected developed countries compared to 2005-2007 incidence rate for RoI and NI: prostate cancer
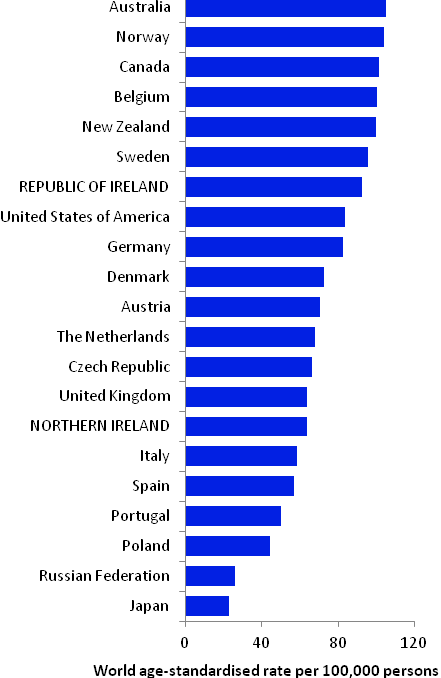
Source: GLOBOCAN 2008 (Ferlay et al., 2008) (excluding RoI and NI data, which is derived from cancer registry data for 2005-2007)
Table 7.2 Risk factors for prostate cancer, by direction of association and strength of evidence
Increases risk | Decreases risk | |
Convincing or probable | Family history of prostate cancer1,2 | Foods containing lycopene8,9 |
| Height/tallness3 | |
| Arsenic and arsenic compounds4 | |
| Cadmium and cadmium compounds4 | |
Possible | Obesity (aggressive prostate cancer)5 | Obesity (non-aggressive prostate cancer)5 |
Tobacco smoking6 | Selenium or foods containing selenium9,10 | |
Insulin-like growth factor-1 (IGF-1)7 | Soya and soya food products11,12 | |
Aspirin and other non-steroidal anti-inflammatory drugs13 | ||
| ||
1 One or more relative(s) with prostate cancer; 2 Bruner et al., 2003; 3 Zuccolo et al., 2008; 4 Straif et al., 2009; 5 Giovannucci and Michaud, 2007; 6 Huncharek et al., 2010; 7 Rowlands et al., 2009; 8 lycopene is a carotenoid found in tomatoes and tomato products, such as soup and puree; 9 World Cancer Research Fund / American Institute of Cancer Research, 2007; 10 Jiang et al., 2010; 11 Hwang et al., 2009; 12 Yan and Spitznagel, 2009; 13 Mahmud et al., 2010 | ||
The chances of a man developing prostate cancer are approximately doubled if he has a relative with the disease. Despite extensive study, relatively few other risk factors for prostate cancer have been firmly established (Table 7.2). Taller men appear to have higher risk, although height per se is unlikely to affect a man’s chances of developing the cancer: instead it probably points to relevant childhood exposures. One possibility is that the association operates through the insulin-like growth factor system, which plays a key role in cell proliferation, differentiation and apoptosis. Positive associations have been reported between prostate cancer and circulating levels of insulin-like growth factor 1.
There is limited evidence that exposure to arsenic and inorganic arsenic compounds (through occupational inhalation or ingestion in food or drinking water) and cadmium and cadmium compounds (via occupational use), are a cause of prostate cancer.
Some aspects of diet may influence risk. Higher intake of the carotenoid lycopene is associated with decreased risk in many studies. Risk may be reduced in men, especially those from Asian populations, who consume more tofu and soya food products. While observational studies suggest that higher intake of selenium or selenium-rich foods is also inversely associated with prostate cancer, two trials found no effect of selenium supplementation.
Obesity may be associated with reduced risk of non-aggressive prostate cancer but, since the opposite has been suggested for aggressive disease, the observations could be due to a detection bias relating to the ability to detect prostate cancer in obese men (Buschemeyer and Freedland, 2007). While current smoking per se does not appear to be associated with risk, risk may be elevated among smokers with higher levels of exposure. Meta-analyses suggest the possibility that regular use of aspirin and other non-steroidal anti-inflammatory drugs could be associated with reduced risk of prostate cancer overall, and of advanced cancers specifically, but there are inconsistencies and limitations in the evidence.
Figure 7.3 Adjusted relative risks (with 95% confidence intervals) of prostate cancer by socio-economic characteristics of geographic area of residence | |
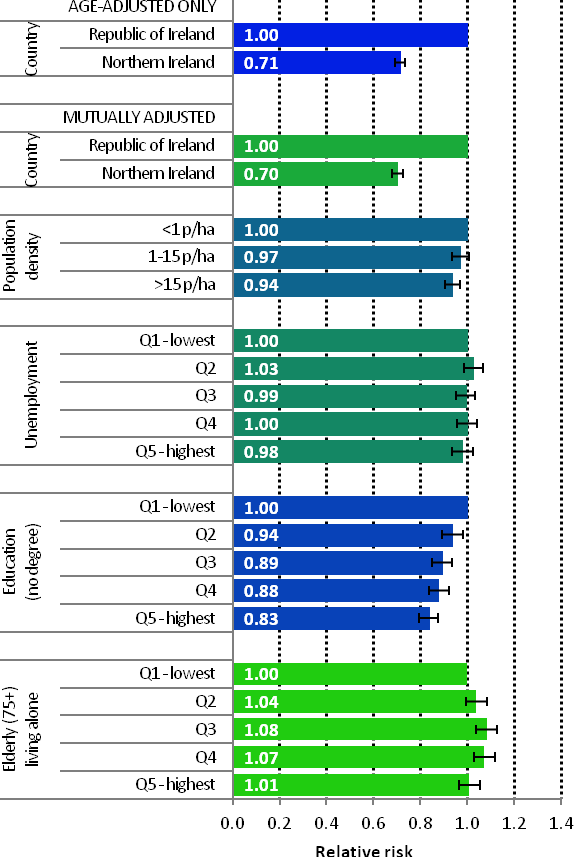 | The risk of prostate cancer in NI was 29% lower than in RoI, with variations between the two countries with regard to socio-economic factors and population density having a minimal impact on this difference (Figure 7.3). There was a weak relationship between prostate cancer and population density, with men living in the least densely populated areas at greater risk. Unemployment was not associated with prostate cancer risk. The strongest area-based factor in prostate cancer risk was education; men resident in areas with a smaller proportion of people with degree level qualifications had a 17% reduced risk compared to those living in areas with the highest proportion of people with degree level qualifications. Men resident in the 3rd and 4th quintiles of the proportion of elderly people living alone indicator had the highest risk of prostate cancer. |
For the period 1995-2007, prostate cancer exhibited a strong geographical pattern with a number of discrete areas of higher risk, mainly in the west.
For all time periods, relative risk was lower in NI than in RoI (Map 7.1).
During 1995-2001, the relative risk tended to be higher in the south and east of Ireland. Areas of higher risk were also found in Donegal, Sligo, Galway, Clare and north Kerry (Map 7.2).
During 2002-2007 risk tended to be higher in a number of areas in the west and north-west, including Donegal and across the midlands to the east coast (Map 7.3). Risk was higher in the south of Dublin city compared to the central and northern parts.
Map 7.1 Prostate cancer, smoothed relative risks: 1995-2007
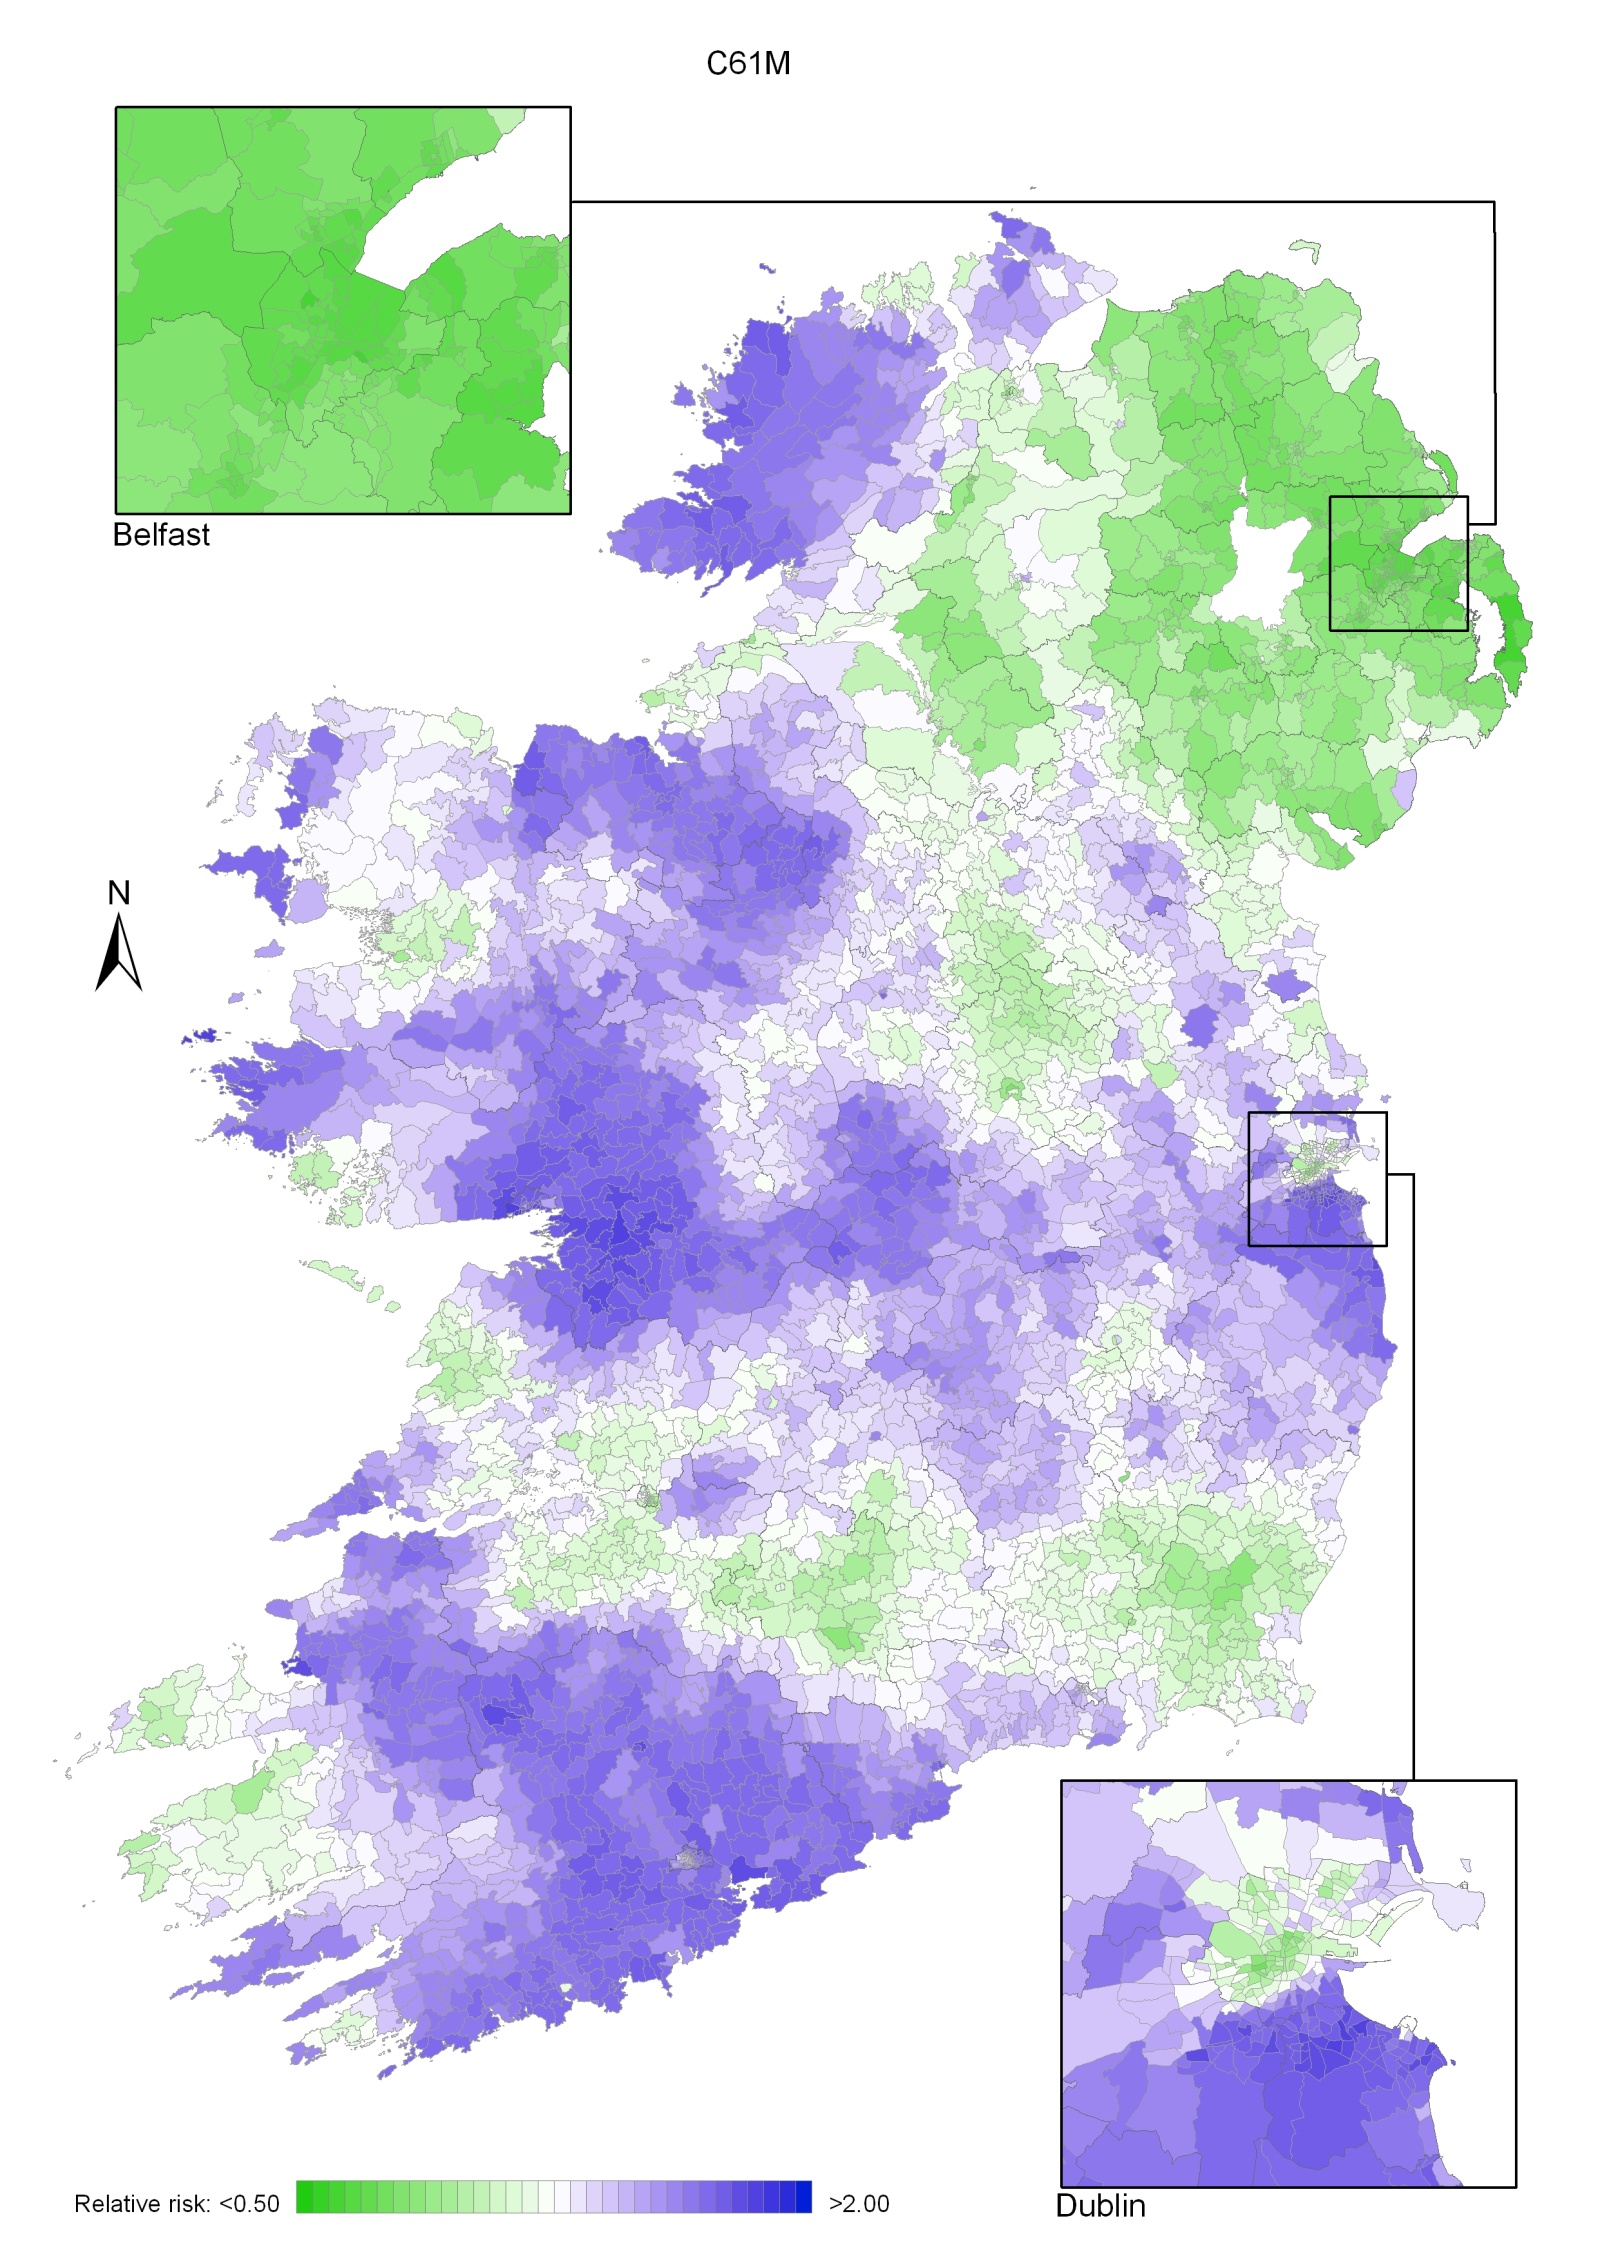
Map 7.2 Prostate cancer, smoothed relative risks: 1995-2001
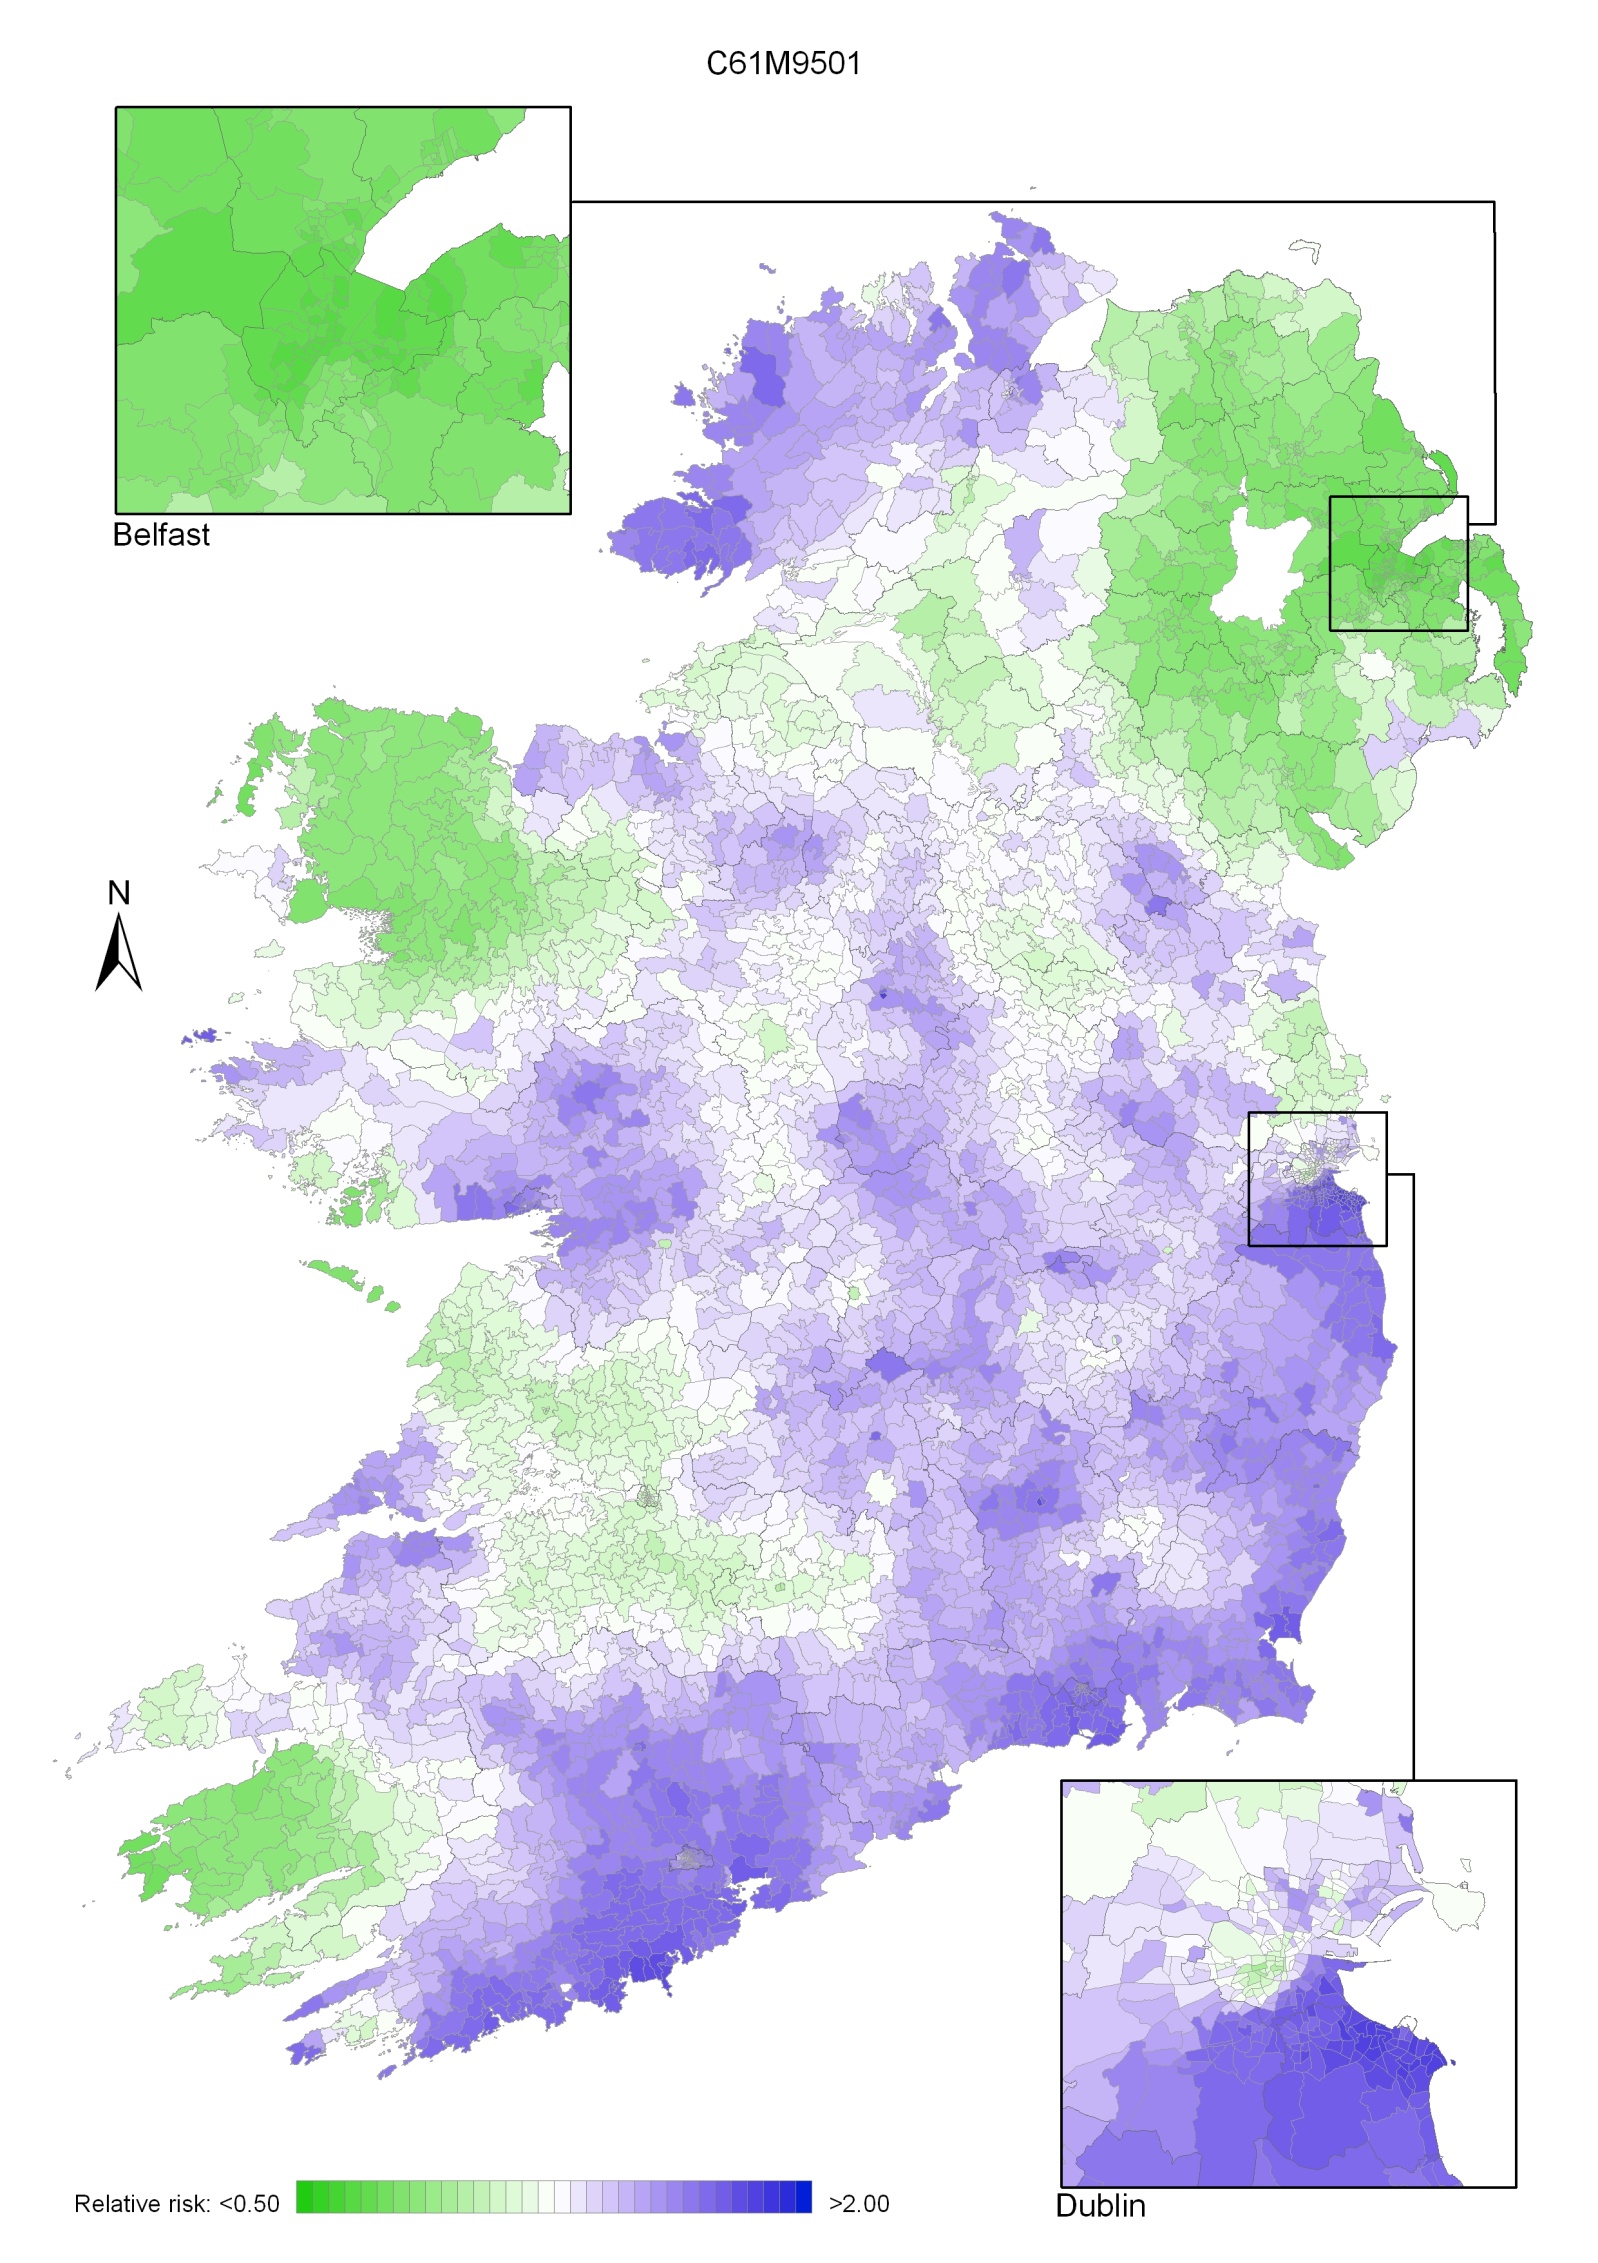
Map 7.3 Prostate cancer, smoothed relative risks: 2002-2007
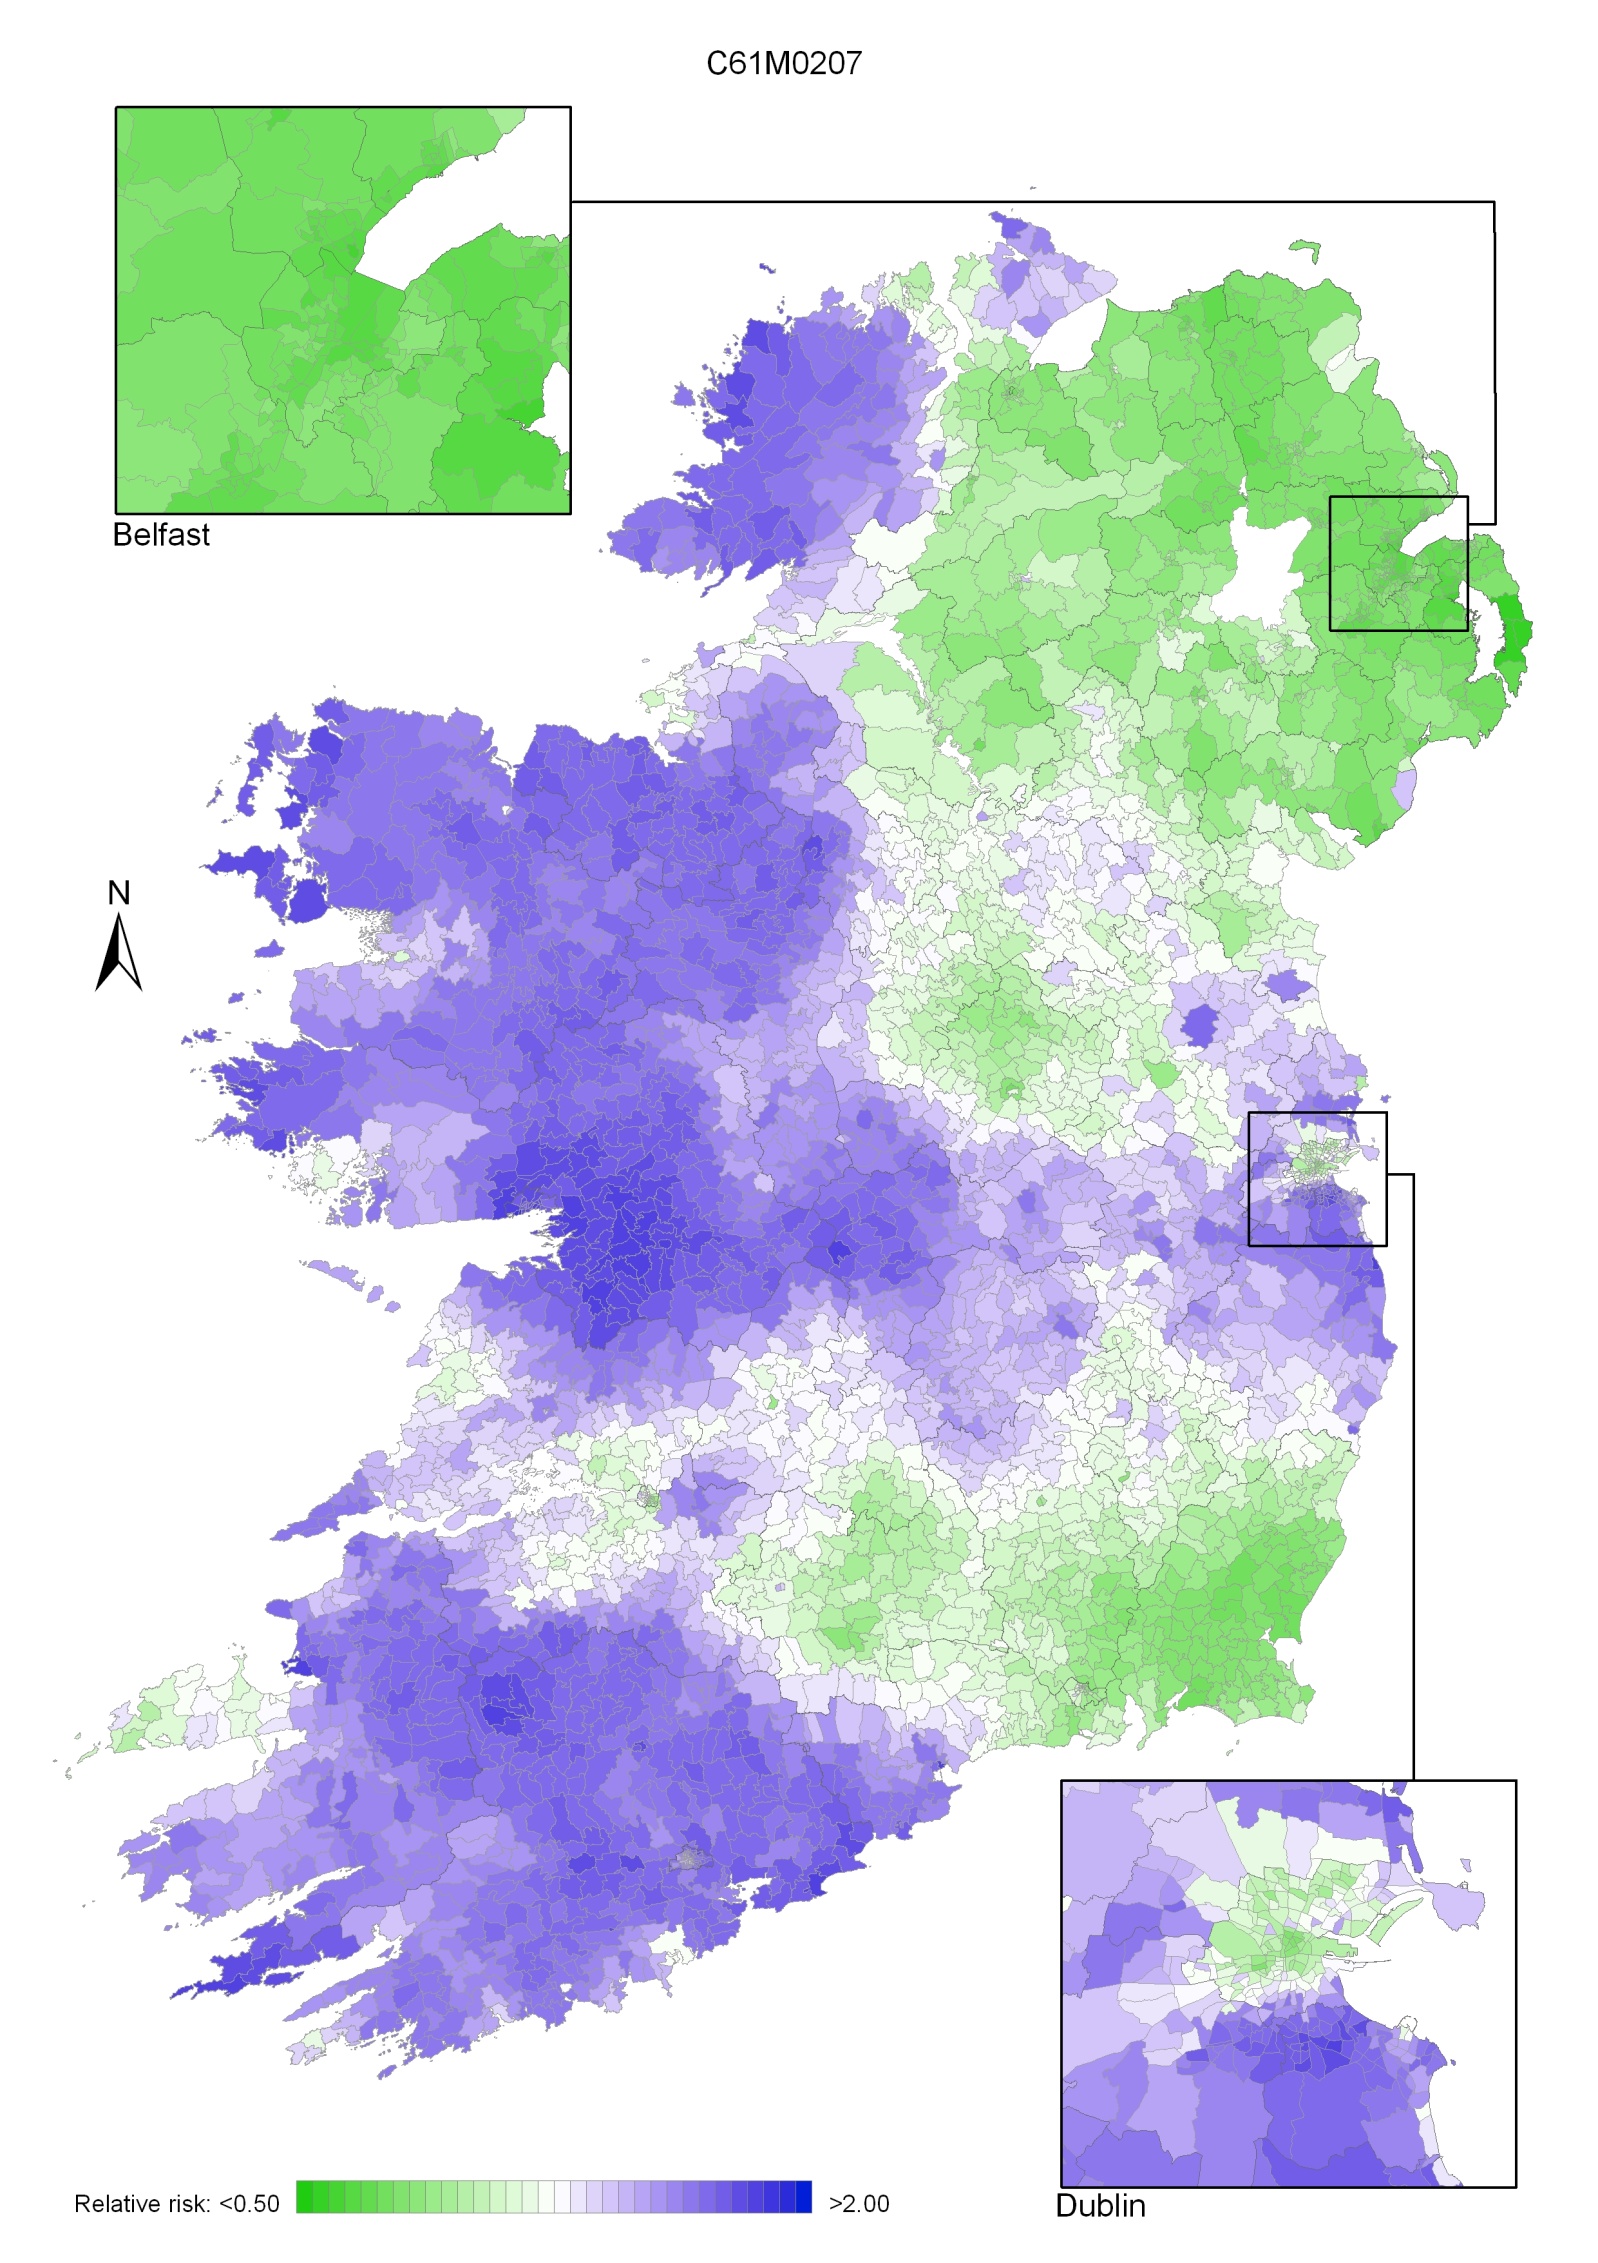
Non-Hodgkin’s lymphoma (NHL) consists of a group of more than 20 different malignant lymphoproliferative diseases that originate from lymphocytes. NHL was the fifth most common cancer in Ireland, accounting for 3.4% of all malignant neoplasms, excluding non-melanoma skin cancer, in women and 3.6% in men (Table 8.1). The average number of new cases diagnosed each year was approximately 354 in women and 392 in men. During 1995-2007, the number of new cases diagnosed increased by approximately 3% per annum overall.
The risk of developing NHL up to the age of 74 was 1 in 102 for women and 1 in 80 for men, and was higher in NI than in RoI for both males and females. At the end of 2008, 1,255 females and 1,607 males aged under 65, and 1,477 females and 1,266 males aged 65 and over, were alive up to 15 years after their NHL diagnosis.
Table 8.1 Summary information for non-Hodgkin’s lymphoma in Ireland, 1995-2007
Ireland | RoI | NI | ||||
females | males | females | males | females | males | |
% of all new cancer cases | 2.5% | 2.6% | 2.3% | 2.5% | 2.9% | 2.8% |
% of all new cancer cases excluding non-melanoma skin cancer | 3.4% | 3.6% | 3.2% | 3.5% | 3.8% | 3.8% |
average number of new cases per year | 354 | 392 | 224 | 265 | 130 | 127 |
cumulative risk to age 74 | 1.0% | 1.2% | 0.9% | 1.2% | 1.1% | 1.3% |
15-year prevalence (1994-2008) | 2732 | 2873 | 1782 | 1944 | 950 | 929 |
Age at diagnosis of NHL was younger for men than for women—43% of cases presented in men under 60 compared to 33% of women (Figure 8.1). Approximately 17% of women and 10% of men were aged 80 years or older at diagnosis. Age at diagnosis was also slightly younger in RoI than in NI.
Figure 8.1 Age distribution of non-Hodgkin’s lymphoma cases in Ireland, 1995-2007, by sex
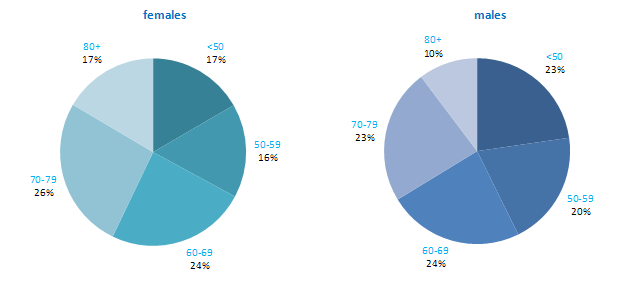
Among developed countries the USA had the highest incidence rate of NHL for men and women, while Canada had the second highest rates for both sexes. Both RoI and NI had close to median rates of the disease for men and women, while Poland, Russia and Japan had the lowest rates.
Figure 8.2 Estimated incidence rate per 100,000 in 2008 for selected developed countries compared to 2005-2007 incidence rate for RoI and NI: non-Hodgkin’s lymphoma | |
| females | males |
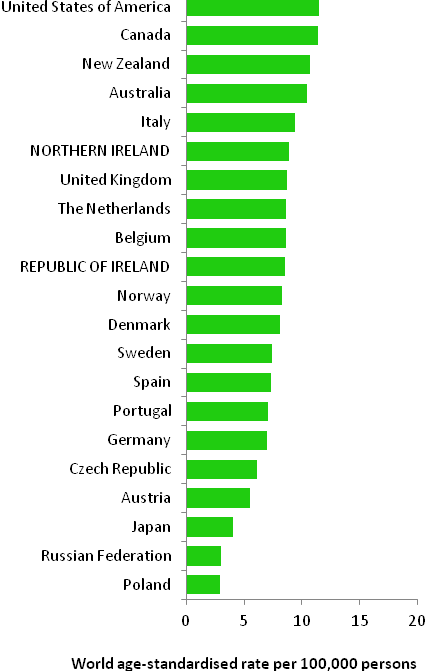 | 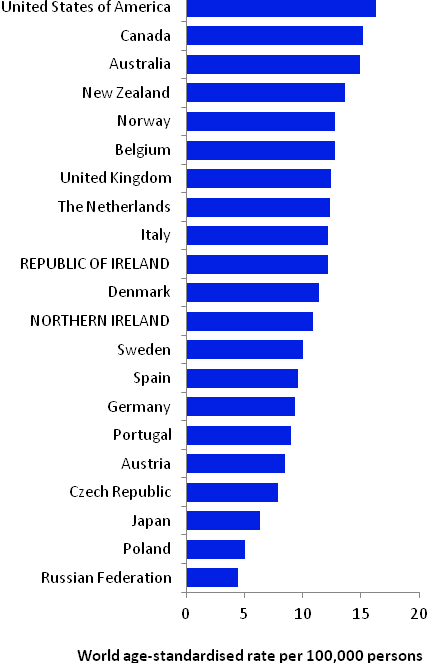 |
Source: GLOBOCAN 2008 (Ferlay et al., 2008) (excluding RoI and NI data, which is derived from Cancer Registry data for 2005-2007) NOTE: NHL was defined in GLOBOCAN by ICD10 codes C82-C85 & C96. In the atlas we have included codes C82-C85 only in the definition of NHL (see Table 2.1.) The data for NI and RoI in Figure 8.2 retain this definition, while those for other countries include C96. Due to changes in case definition, inclusion of C96 in the RoI data would have artificially inflated the incidence figures. | |
Table 8.2 Risk factors for non-Hodgkin’s lymphoma, by direction of association and strength of evidence
Increases risk | Decreases risk | |
Convincing or probable | Immune deficiency1,2,3 | |
| Some auto-immune disorders4 | |
| Various infections, including human immunodeficiency virus, type1 (HIV-1), Epstein-Barr Virus (EBV), human T-cell lymphotrophic virus type 1 (HTLV-1), hepatitis C (HCV), and Helicobacter pylori5 | |
| Occupational exposure to benzene, ethylene oxide, and formaldehyde6,7 | |
| Employment in the rubber manufacturing industry6 | |
| Family history of NHL, Hodgkin’s lymphoma or leukaemia8,9 | |
Possible | Occupational exposure to pesticides and trichloroethylene10,11 | Sun exposure16 |
Tobacco smoking12 | Allergic conditions and/or atopy17,18 | |
Overweight/obesity13,14,15 | ||
1 individuals with a weakened immune system; users of immunosuppressive drugs; 2 Grulich and Vajdic, 2005; 3 Grosse et al., 2009; 4 Ekstrom Smedby et al., 2008; 5 Bouvard et al., 2009; 6 Baan et al., 2009; 7 National Toxicology Program, 2008; 8 one or more first degree relative(s) affected; 9 Wang et al., 2007; 10 Mandel et al., 2006; 11 US Department of Health and Human Services, 2011; 12 Morton et al., 2005; 13 Larsson and Wolk, 2007; 14 Renehan et al., 2008; 15 Willett et al., 2008; 16 Kricker et al., 2008; 17 hay fever, asthma, food allergy, but not eczema; 18 Vajdic et al., 2009 | ||
Although lymphomas may occur in children, the following description of risk factors relates to NHL in adults.
The best described risk factor for NHL is immune deficiency (Table 8.2). Individuals who have had organ transplants, or who take immunosuppressive drugs to prevent organ rejection or to treat various autoimmune conditions (e.g. azathioprine and ciclosporin) have a high risk of NHL. Risk is also increased in individuals with some auto-immune disorders, including Sjorgen syndrome, systemic lupus and haemolytic anaemia. A variety of infection—including human immunodeficiency virus, type 1 (HIV-1) which causes AIDS, Epstein-Barr virus (EBV), which is a common member of the herpesvirus family, and hepatitis C virus (HCV)—can cause NHL, often acting via effects on immunosuppression or inflammation.
Occupational exposure to ethylene oxide (an organic compound used in the manufacture of products like polyethylene), benzene (an industrial solvent and precursor to basic industrial chemicals including drugs, plastics, synthetic rubber, and dyes) and formaldehyde (used in the production of industrial resins that are then used in the manufacture of products such as adhesives and binders for wood products, plastic and synthetic fibres) are all associated with NHL. Those exposed to pesticides through their work, or to tricholoroethylene, a hydrocarbon commonly used as an industrial solvent, may also have increased risk of NHL, but the evidence is less certain. Workers in the rubber manufacturing industry are also at increased risk, but due to the complexity of exposures in this industry, the causative agents have not yet been identified.
Risk of NHL is increased by around 50% in those who report first-degree relatives with NHL, Hodgkin’s lymphoma or leukaemia. In terms of lifestyle factors, current smoking may increase the risk of follicular lymphomas, but not other subtypes. A modest positive association between weight and NHL risk is evident in meta-analyses, but this may be limited to particular subtypes and/or to obese individuals. Increased recreational sun exposure may be associated with a modestly reduced risk of particular types of NHL, while individuals with allergic conditions, such as hay fever or asthma, or atopy may have slightly reduced risk of B-cell NHL.
Figure 8.3 Adjusted relative risks (with 95% confidence intervals) of non-Hodgkin’s lymphoma by socio-economic characteristics of geographic area of residence: males
| MalesAmong men there was little variation in risk of NHL across Ireland, by population density or socio-economic factors. In particular, differences between NI and RoI were not statistically significant (Figure 8.3). |
Figure 8.4 Adjusted relative risks (with 95% confidence intervals) of non-Hodgkin’s lymphoma by socio-economic characteristics of geographic area of residence: females
| FemalesAs for men, there was little variation in risk of female NHL across Ireland by population density or socio-economic factors (Figure 8.4). However risk of NHL among women was 14% greater in NI than in RoI. This difference was not reduced by adjustment for population density or socio-economic factors. |
The geographical variation in relative risk of NHL was fairly modest. For both sexes combined, there was an area of higher relative risk in the north-east, extending to Dublin, but the remainder of the country showed only modest variation (Map 8.1).
The same area of higher risk occurred for men but was less prominent (Map 8.2). The map for men also showed areas of higher relative risk in Kerry and Galway.
Women showed higher relative risk in the north-east of the island extending southwards to Dublin; this was more pronounced than for men (Map 8.3).
Map 8.1 Non-Hodgkin’s lymphoma, smoothed relative risks: both sexes
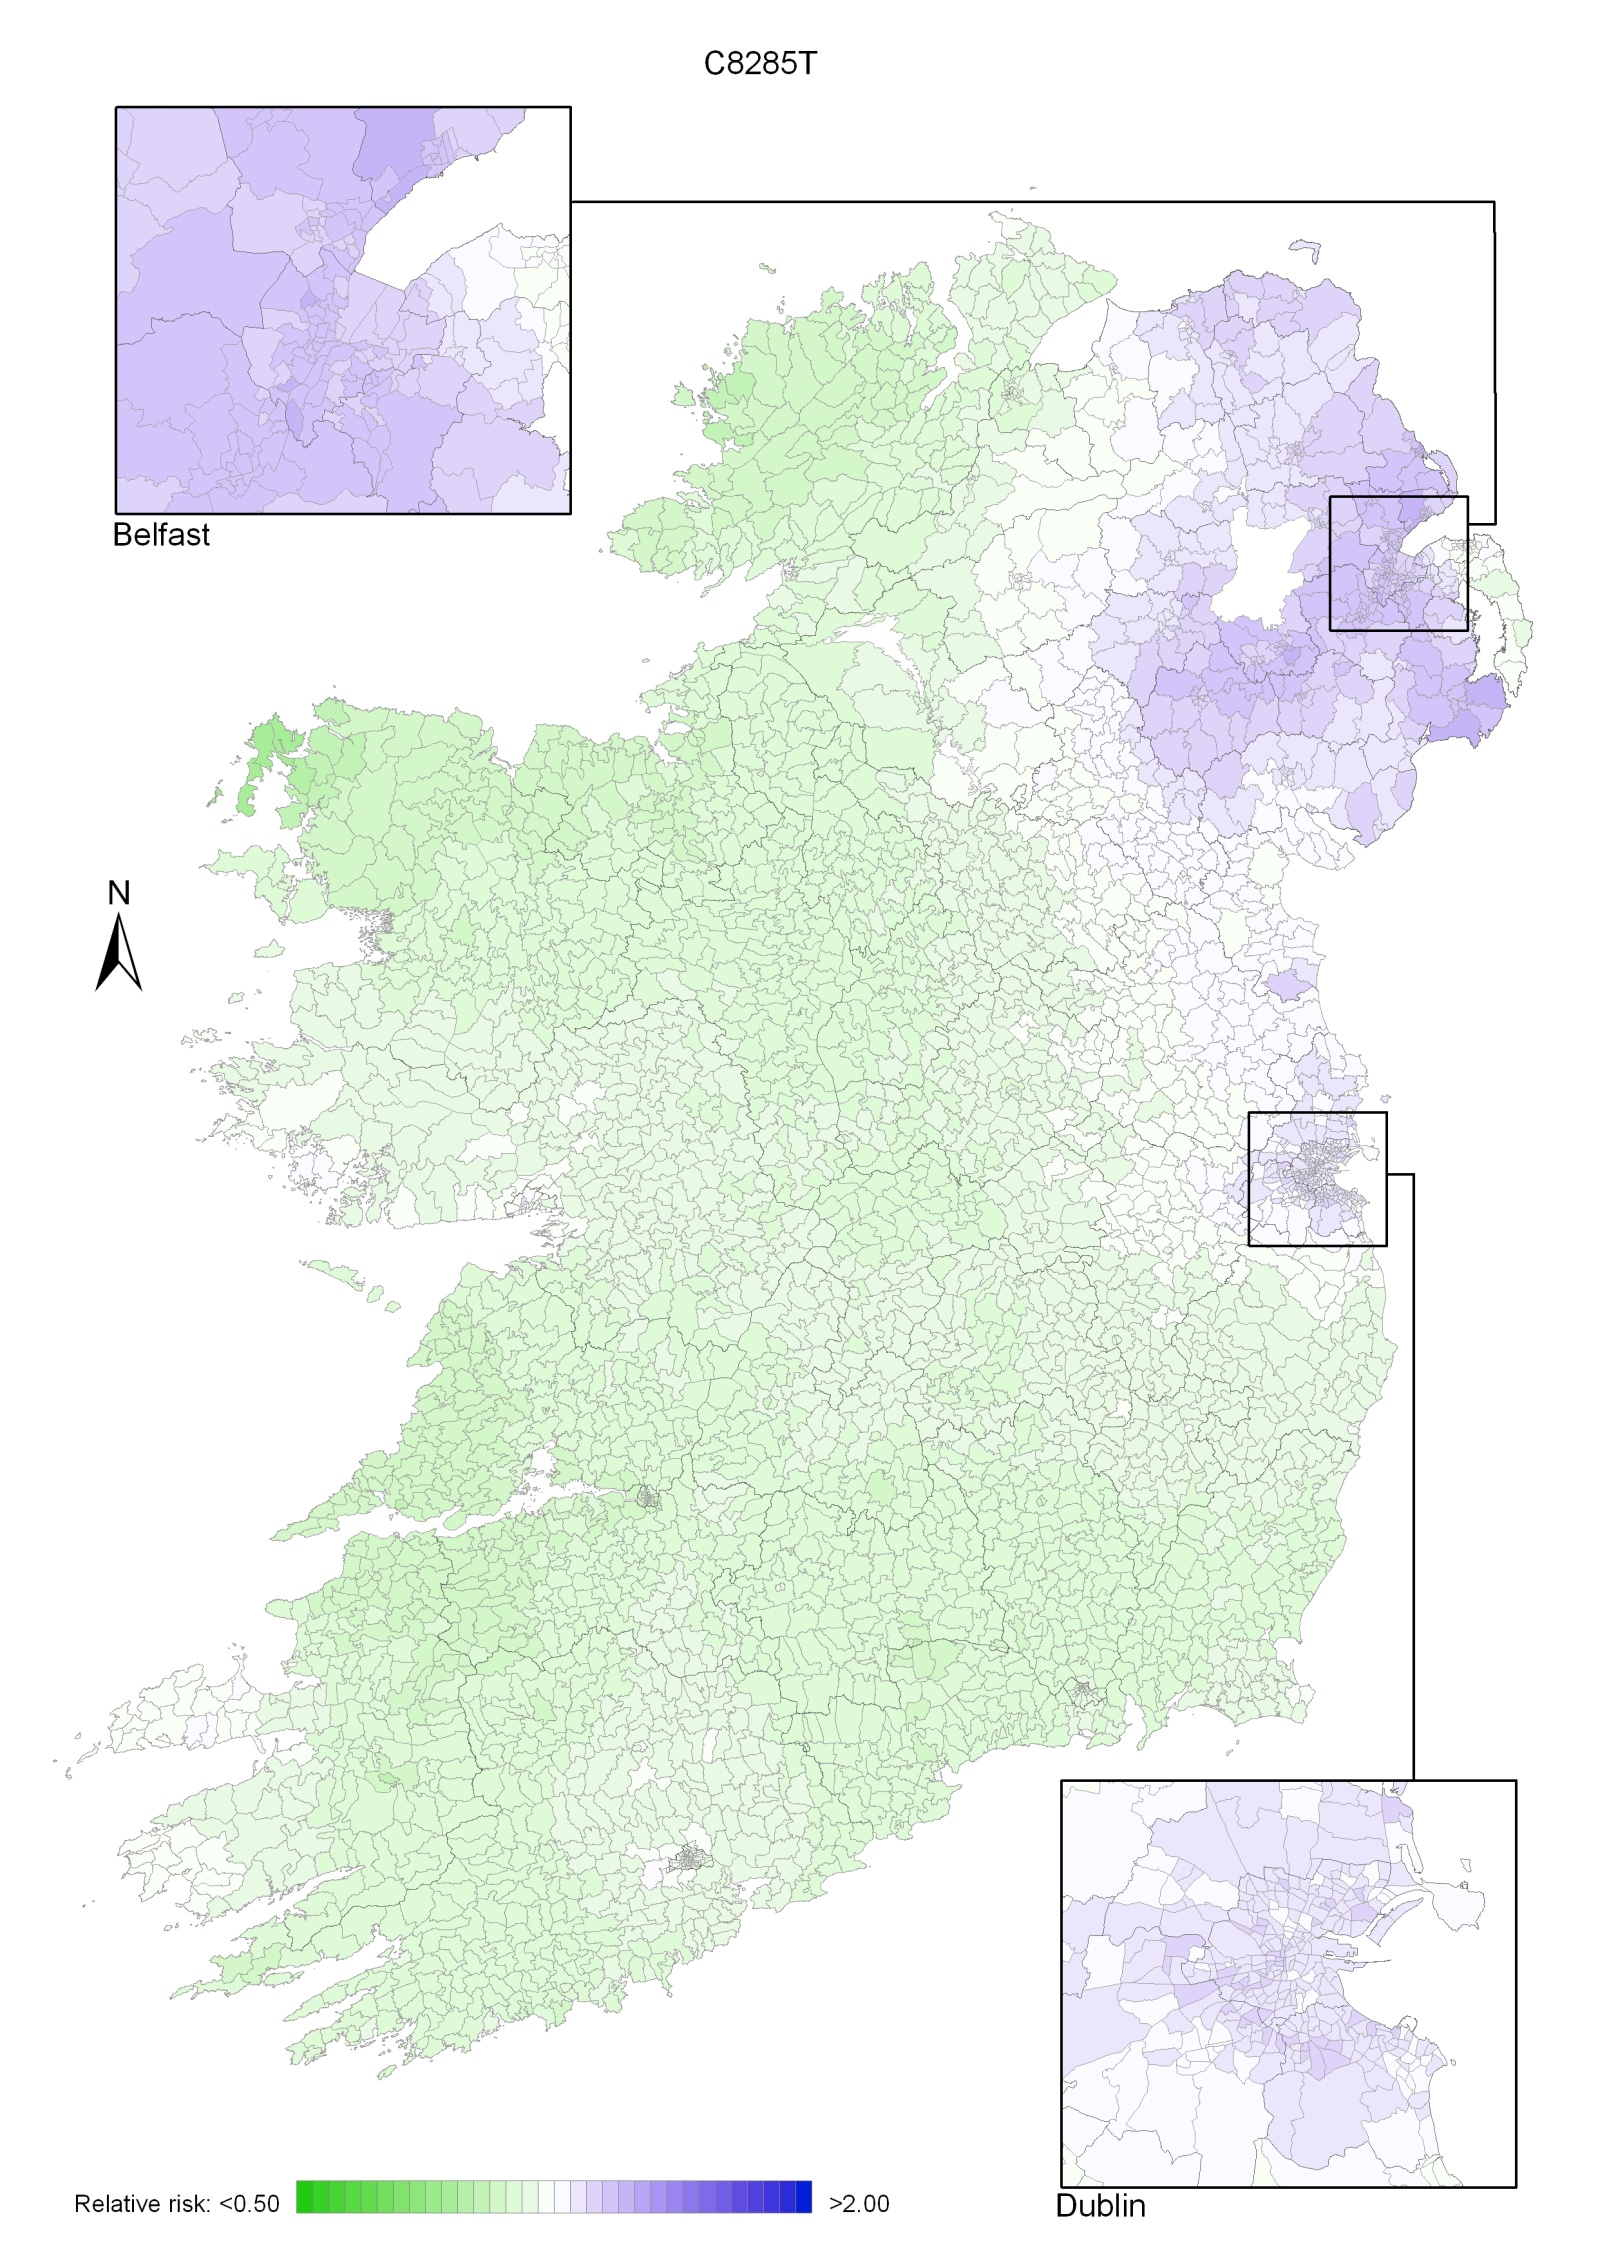
Map 8.2 Non-Hodgkin’s lymphoma, smoothed relative risks: males
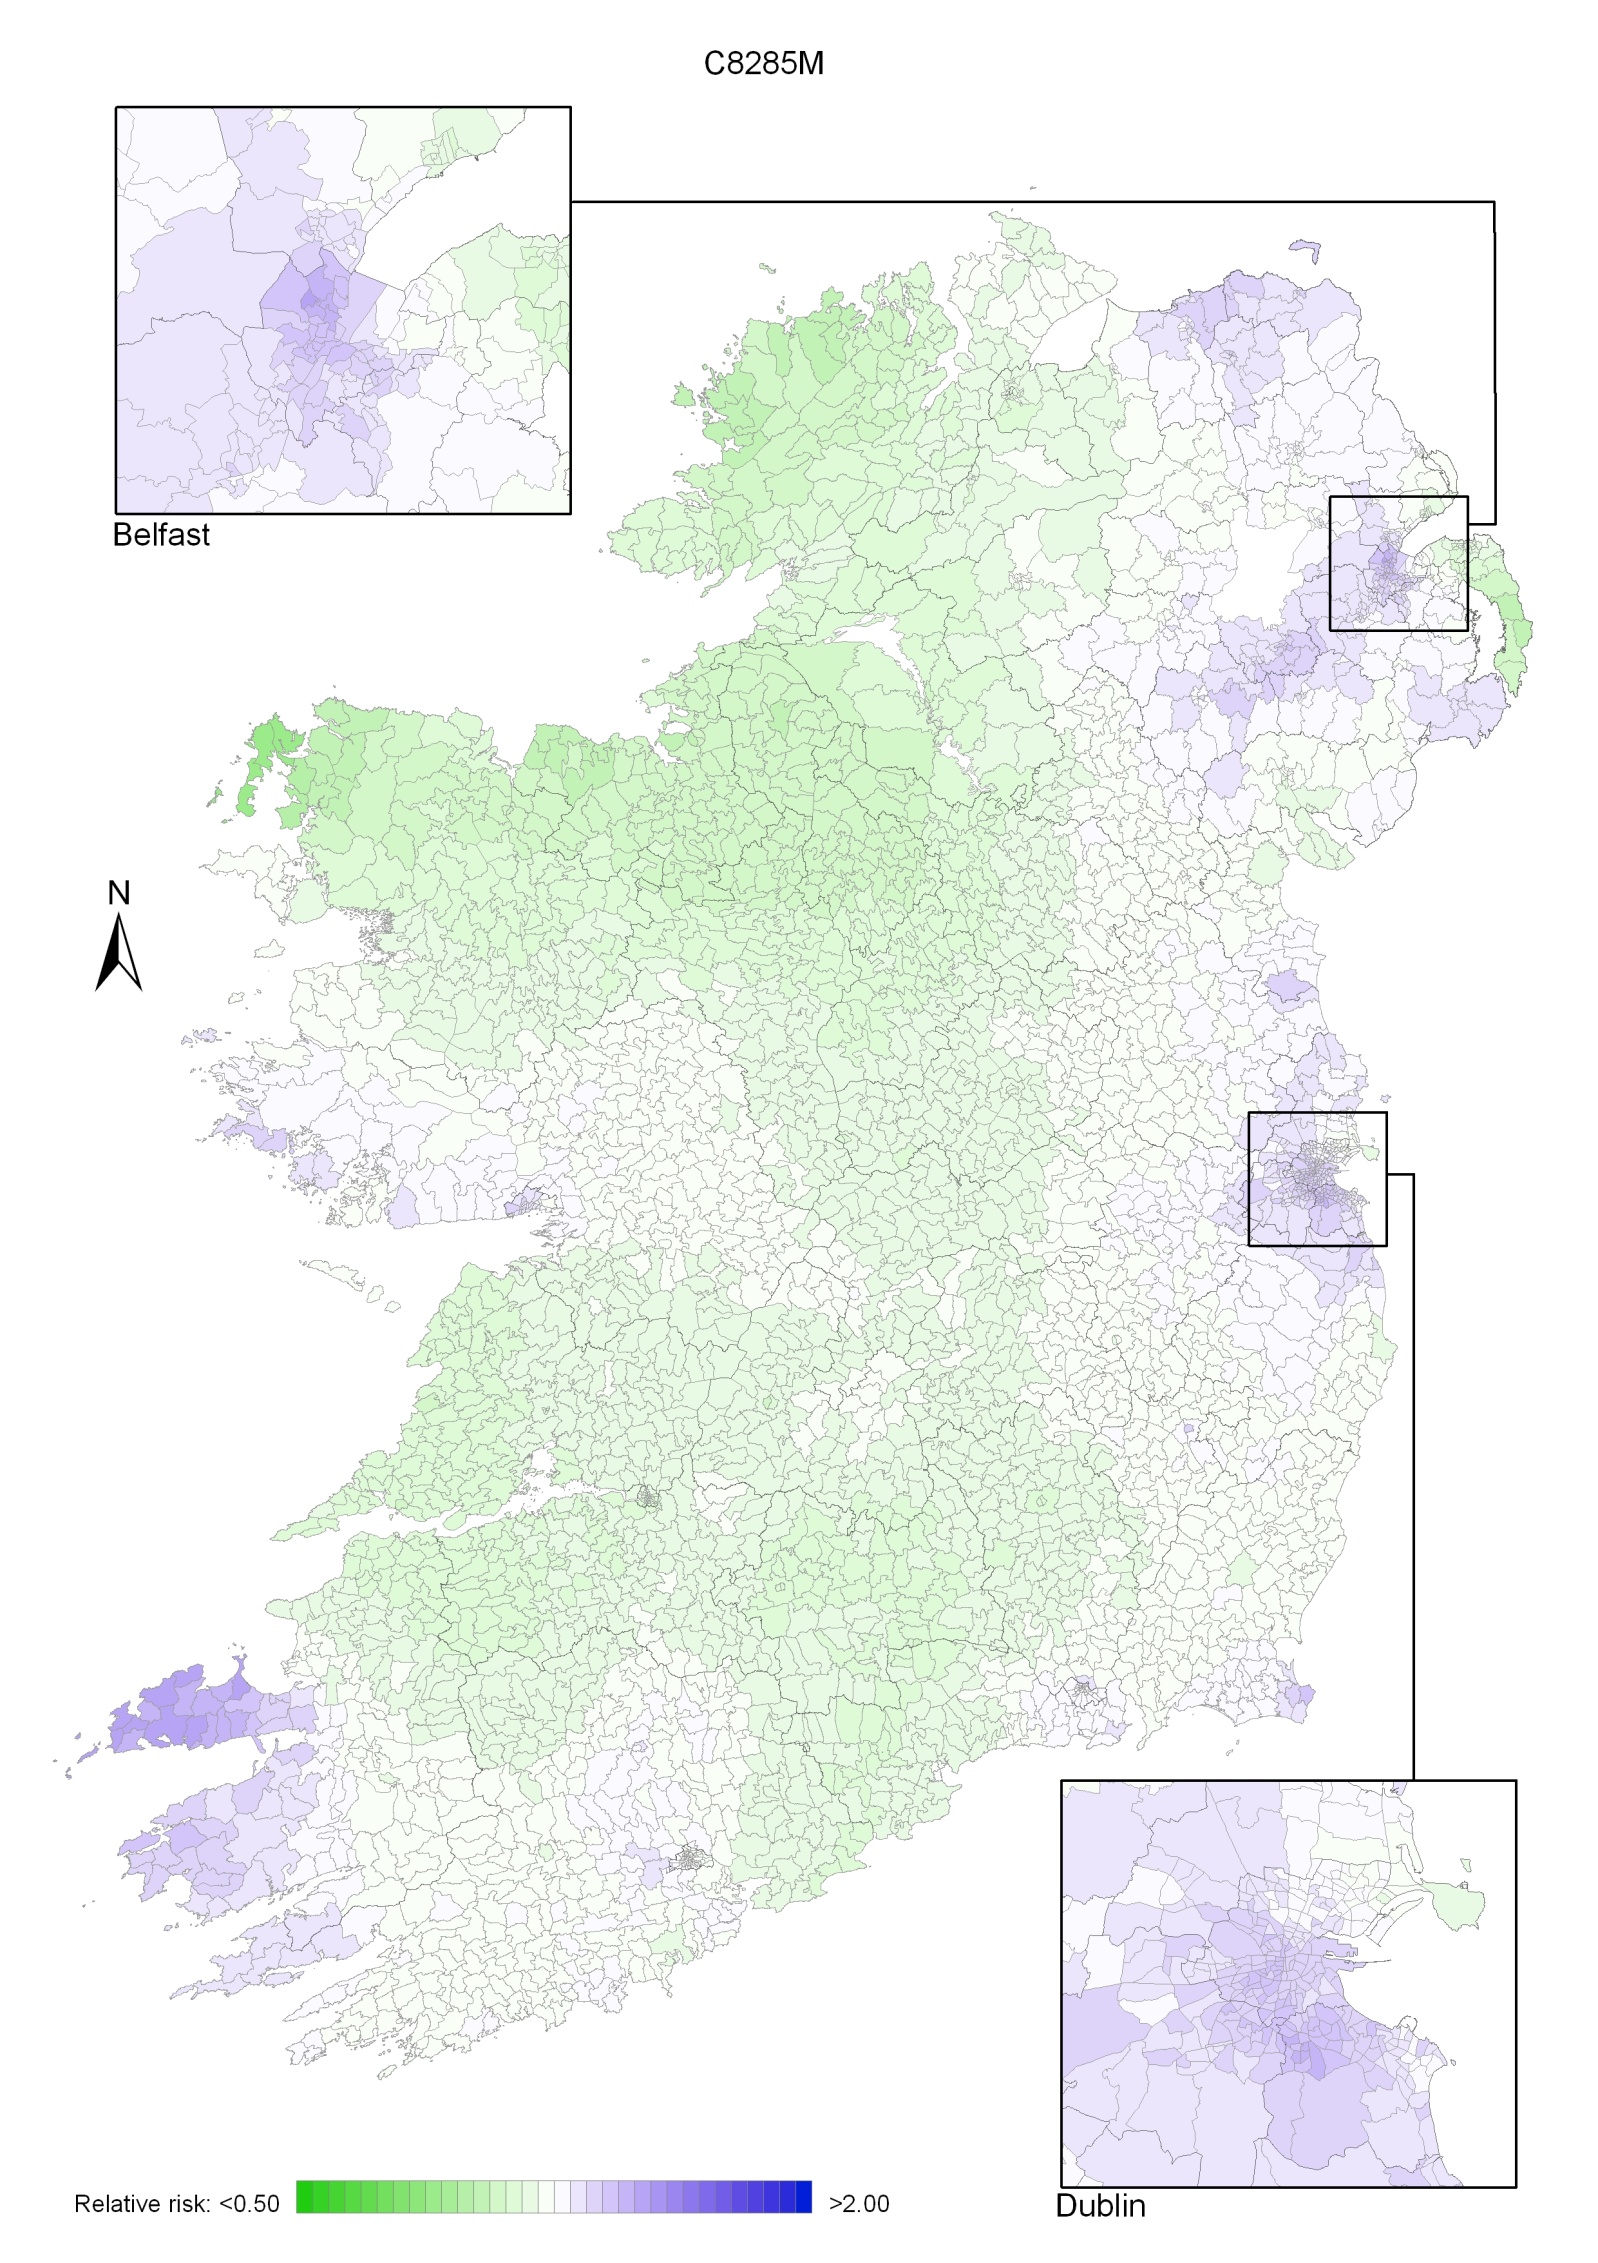
Map 8.3 Non-Hodgkin’s lymphoma, smoothed relative risks: females
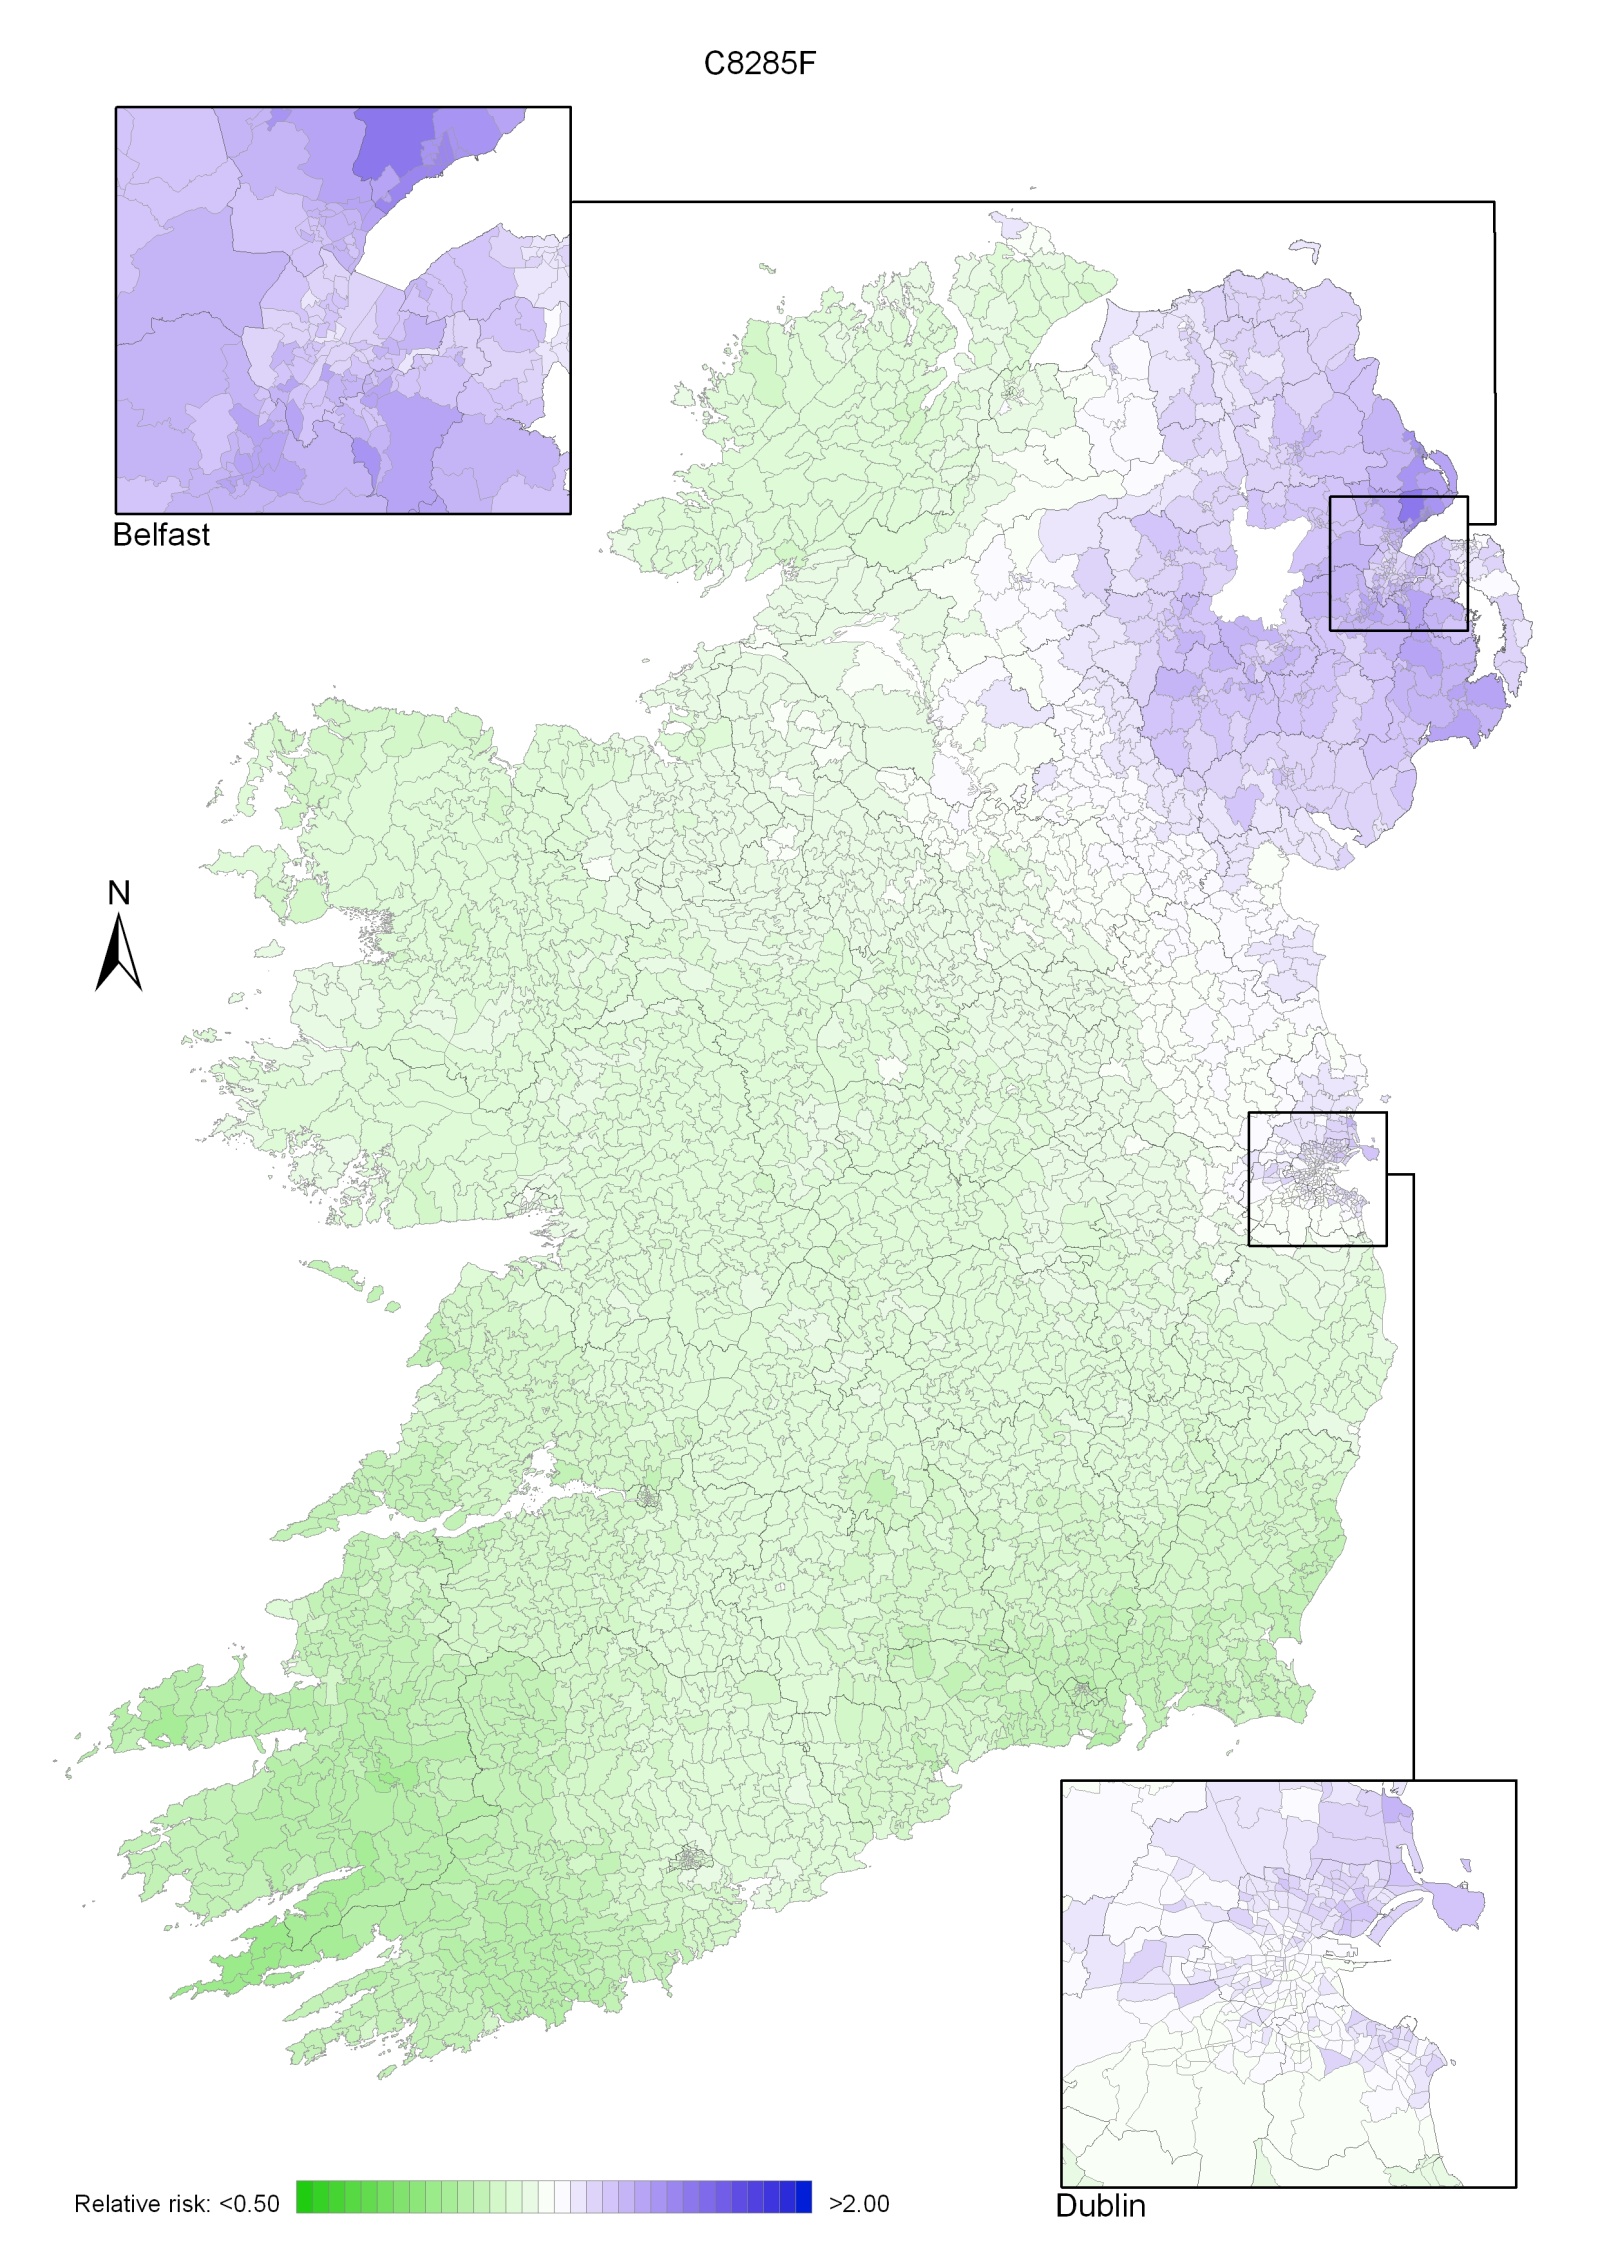
Stomach cancer was the sixth most common cancer in Ireland, accounting for 2.7% of all malignant neoplasms, excluding non-melanoma skin cancer, in women and 4.0% in men (Table 9.1). The average number of new cases diagnosed each year was 278 in women and 442 in men. During 1995-2007, the number of new cases diagnosed per annum remained fairly constant.
The risk of developing stomach cancer up to the age of 74 was 1 in 161 for women and 1 in 74 for men and was similar in NI and RoI for both men and women. At the end of 2008, 197 women and 323 men aged under 65, and 522 women and 773 men aged 65 and over, were alive up to 15 years after their stomach cancer diagnosis.
Table 9.1 Summary information for stomach cancer in Ireland, 1995-2007
Ireland | RoI | NI | ||||
females | males | females | males | females | males | |
% of all new cancer cases | 2.0% | 2.9% | 1.9% | 2.7% | 2.1% | 3.3% |
% of all new cancer cases excluding non-melanoma skin cancer | 2.7% | 4.0% | 2.6% | 3.9% | 2.8% | 4.4% |
average number of new cases per year | 278 | 442 | 181 | 294 | 97 | 148 |
cumulative risk to age 74 | 0.6% | 1.4% | 0.6% | 1.3% | 0.6% | 1.4% |
15-year prevalence (1994-2008) | 719 | 1096 | 476 | 746 | 243 | 350 |
More than 50% of all cases of stomach cancer were diagnosed at over 70 years of age—65% of women and 53% of men (Figure 9.1). Only 7% of cases were aged under 50 years at diagnosis. Patterns were similar for RoI and NI, but with a slightly older age at diagnosis in NI.
Figure 9.1 Age distribution of stomach cancer cases in Ireland, 1995-2007, by sex
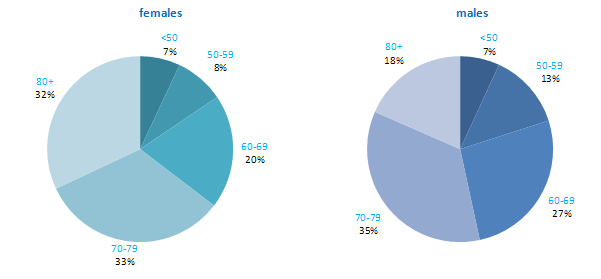
Rates of stomach cancer among men and women were considerably higher in Japan than in other developed countries. Within Europe, Russia had the highest incidence rate (Figure 9.2). In RoI and NI rates were moderate compared to other countries for both men and women. Sweden, USA and Canada had particularly low rates of this cancer.
Figure 9.2 Estimated incidence rate per 100,000 in 2008 for selected developed countries compared to 2005-2007 incidence rate for RoI and NI: stomach cancer | |
| females | males |
 |  |
Source: GLOBOCAN 2008 (Ferlay et al., 2008) (excluding RoI and NI data, which is derived from Cancer Registry data for 2005-2007). | |
Table 9.2 Risk factors for stomach cancer, by direction of association and strength of evidence
Increases risk | Decreases risk | |
Convincing or probable | Helicobacter pylori infection1 | Non-starchy and fresh vegetables4,8,10 |
| Epstein-Barr virus2 | Fruit4,10 |
| Tobacco smoking3 | Refrigeration4 |
| Salt, salted and salty foods, or salt preserved foods, including Chinese-style salted fish3,4 | Aspirin and other non-steroidal anti-inflammatory drugs11,12 |
| Ionizing radiation5 | |
| Low socio-economic status6 | |
Possible | Fermented soya foods7 | Non-fermented soya foods7 |
Pickled vegetables8 | ||
Overweight/obesity9 | ||
1 Helicobacter and Cancer Collaborative Group, 2001; 2 International Agency for Research on Cancer, 2011b; 3 Secretan et al., 2009; 4 World Cancer Research Fund / American Institute for Cancer Research, 2007; 5 El Ghissassi et al., 2009; 6 Faggiano et al., 1997; 7 Kim et al., 2011; 8 Kim et al., 2010; 9 Yang et al., 2009; 10 International Agency for Research on Cancer, 2003; 11 Tian et al., 2010; 12 Yang et al., 2010 | ||
Infection with the common bacterium, Helicobacter pylori (H pylori), which lives in the stomach and causes inflammation and ulcers, is associated with a six-fold raised risk of stomach cancer (Table 9.2). Meta-analysis of intervention studies shows that stomach cancer risk is decreased by one-third in H pylori-positive patients randomised to eradication treatment (Fuccio et al., 2009). It has been suggested that H pylori infection may be a necessary (but not sufficient) cause of cancers in the distal stomach (International Agency for Research on Cancer, 1994). It is also probable that infection with the Epstein-Barr virus (EBV), which is a member of the herpesvirus family, and very common, is a cause of stomach cancer.
Smoking is firmly established as a cause of stomach cancer. Compared to non-smokers, risk in increased by 50% in those who have ever smoked and 70% in current smokers (La Torre et al., 2009). Risk also increases with number of cigarettes smoked (Ladeiras-Lopes et al., 2008). Those with low socio-economic status have increased stomach cancer risk, probably in part reflecting variations in tobacco use by social class.
Other than these factors, the main risk factors are related to food and food preservation. There is substantial and consistent evidence that higher intakes of salt, salty foods or foods preserved in salt are associated with increased risk. Risk is reduced in individuals with higher intakes of fruit and non-starchy or fresh vegetables; in contrast there may be a modest increased risk in those who consume higher quantities of pickled vegetables. More than 10 studies have reported a significant reduction in disease risk with use of refrigeration. However, it is thought that the association is not due to refrigeration per se but rather is a consequence of other factors related to refrigerator use, such as lower intake of foods preserved with salt, or higher intake of fresh perishable foods (e.g. vegetables and fruit) (World Cancer Research Fund / American Institute for Cancer Research, 2007).
In terms of other potential risk factors, use of aspirin and other non-steroidal anti-inflammatory drugs has been associated with a modest (approximately 20%) reduction in risk of stomach cancer; this association appears stronger after adjusting for other risk factors. Overweight individuals (body mass index >25kg/m2) may have a modest increased risk, particularly for cancers arising in the gastric cardia.
Figure 9.3 Adjusted relative risks (with 95% confidence intervals) of stomach cancer by socio-economic characteristics of geographic area of residence: males
| MalesDifferences in male stomach cancer risk between RoI and NI were not statistically significant, either when adjusted for age, or when adjusted for age, population density and socio-economic factors (Figure 9.3). Male stomach cancer risk varied by area-based characteristics. Men resident in areas with 1-15 p/ha had a 15% greater risk of stomach cancer than those resident in the least densely populated areas, while those resident in the most densely populated areas had a 36% greater risk. Stomach cancer risk increased as the proportion of unemployed in an area increased. The same pattern was seen for educational attainment; people living in areas with low levels of educational attainment had the greatest risk of stomach cancer. There was no consistent association of risk with the percentage of people aged 75 and over living alone. |
Figure 9.4 Adjusted relative risks (with 95% confidence intervals) of stomach cancer by socio-economic characteristics of geographic area of residence: females
| FemalesThe pattern for women was very similar to that for men (Figure 9.4). There was no significant difference between countries, but stomach cancer risk increased with increasing levels of unemployment, lower educational attainment and population density. The relationship between female stomach cancer risk and areas where there were higher levels of elderly people living alone was stronger than that for men. Compared to areas with low levels of elderly people living alone, the relative risk of stomach cancer in areas with the highest proportion of elderly people living alone was 1.26 (95%CI=1.11-1.43). Quintiles 3 and 4 also had similar levels of increased risk. |
Stomach cancer had a strong geographical pattern with lower relative risk in most of the south and west of Ireland and higher relative risk in parts of the north (Maps 9.1-9.3).
For both sexes combined, the main area of higher relative risk extended northwards from Dublin as far as the border counties and west into the midlands (Map 9.1). There were also isolated areas of higher risk in Donegal, Belfast, Antrim, north Lisburn, Kerry and Connacht.
The pattern for men was similar to that for both sexes combined (Map 9.2).
For women, the main area of higher relative risk extended in a band from Dublin to Donegal, excluding the north-east of NI, but including Belfast, south Antrim, north Lisburn, Ards and parts of Down. Comparatively high relative risk was also found in western parts of Galway, west Cork and west Kerry (Map 9.3).
Map 9.1 Stomach cancer, smoothed relative risks: both sexes
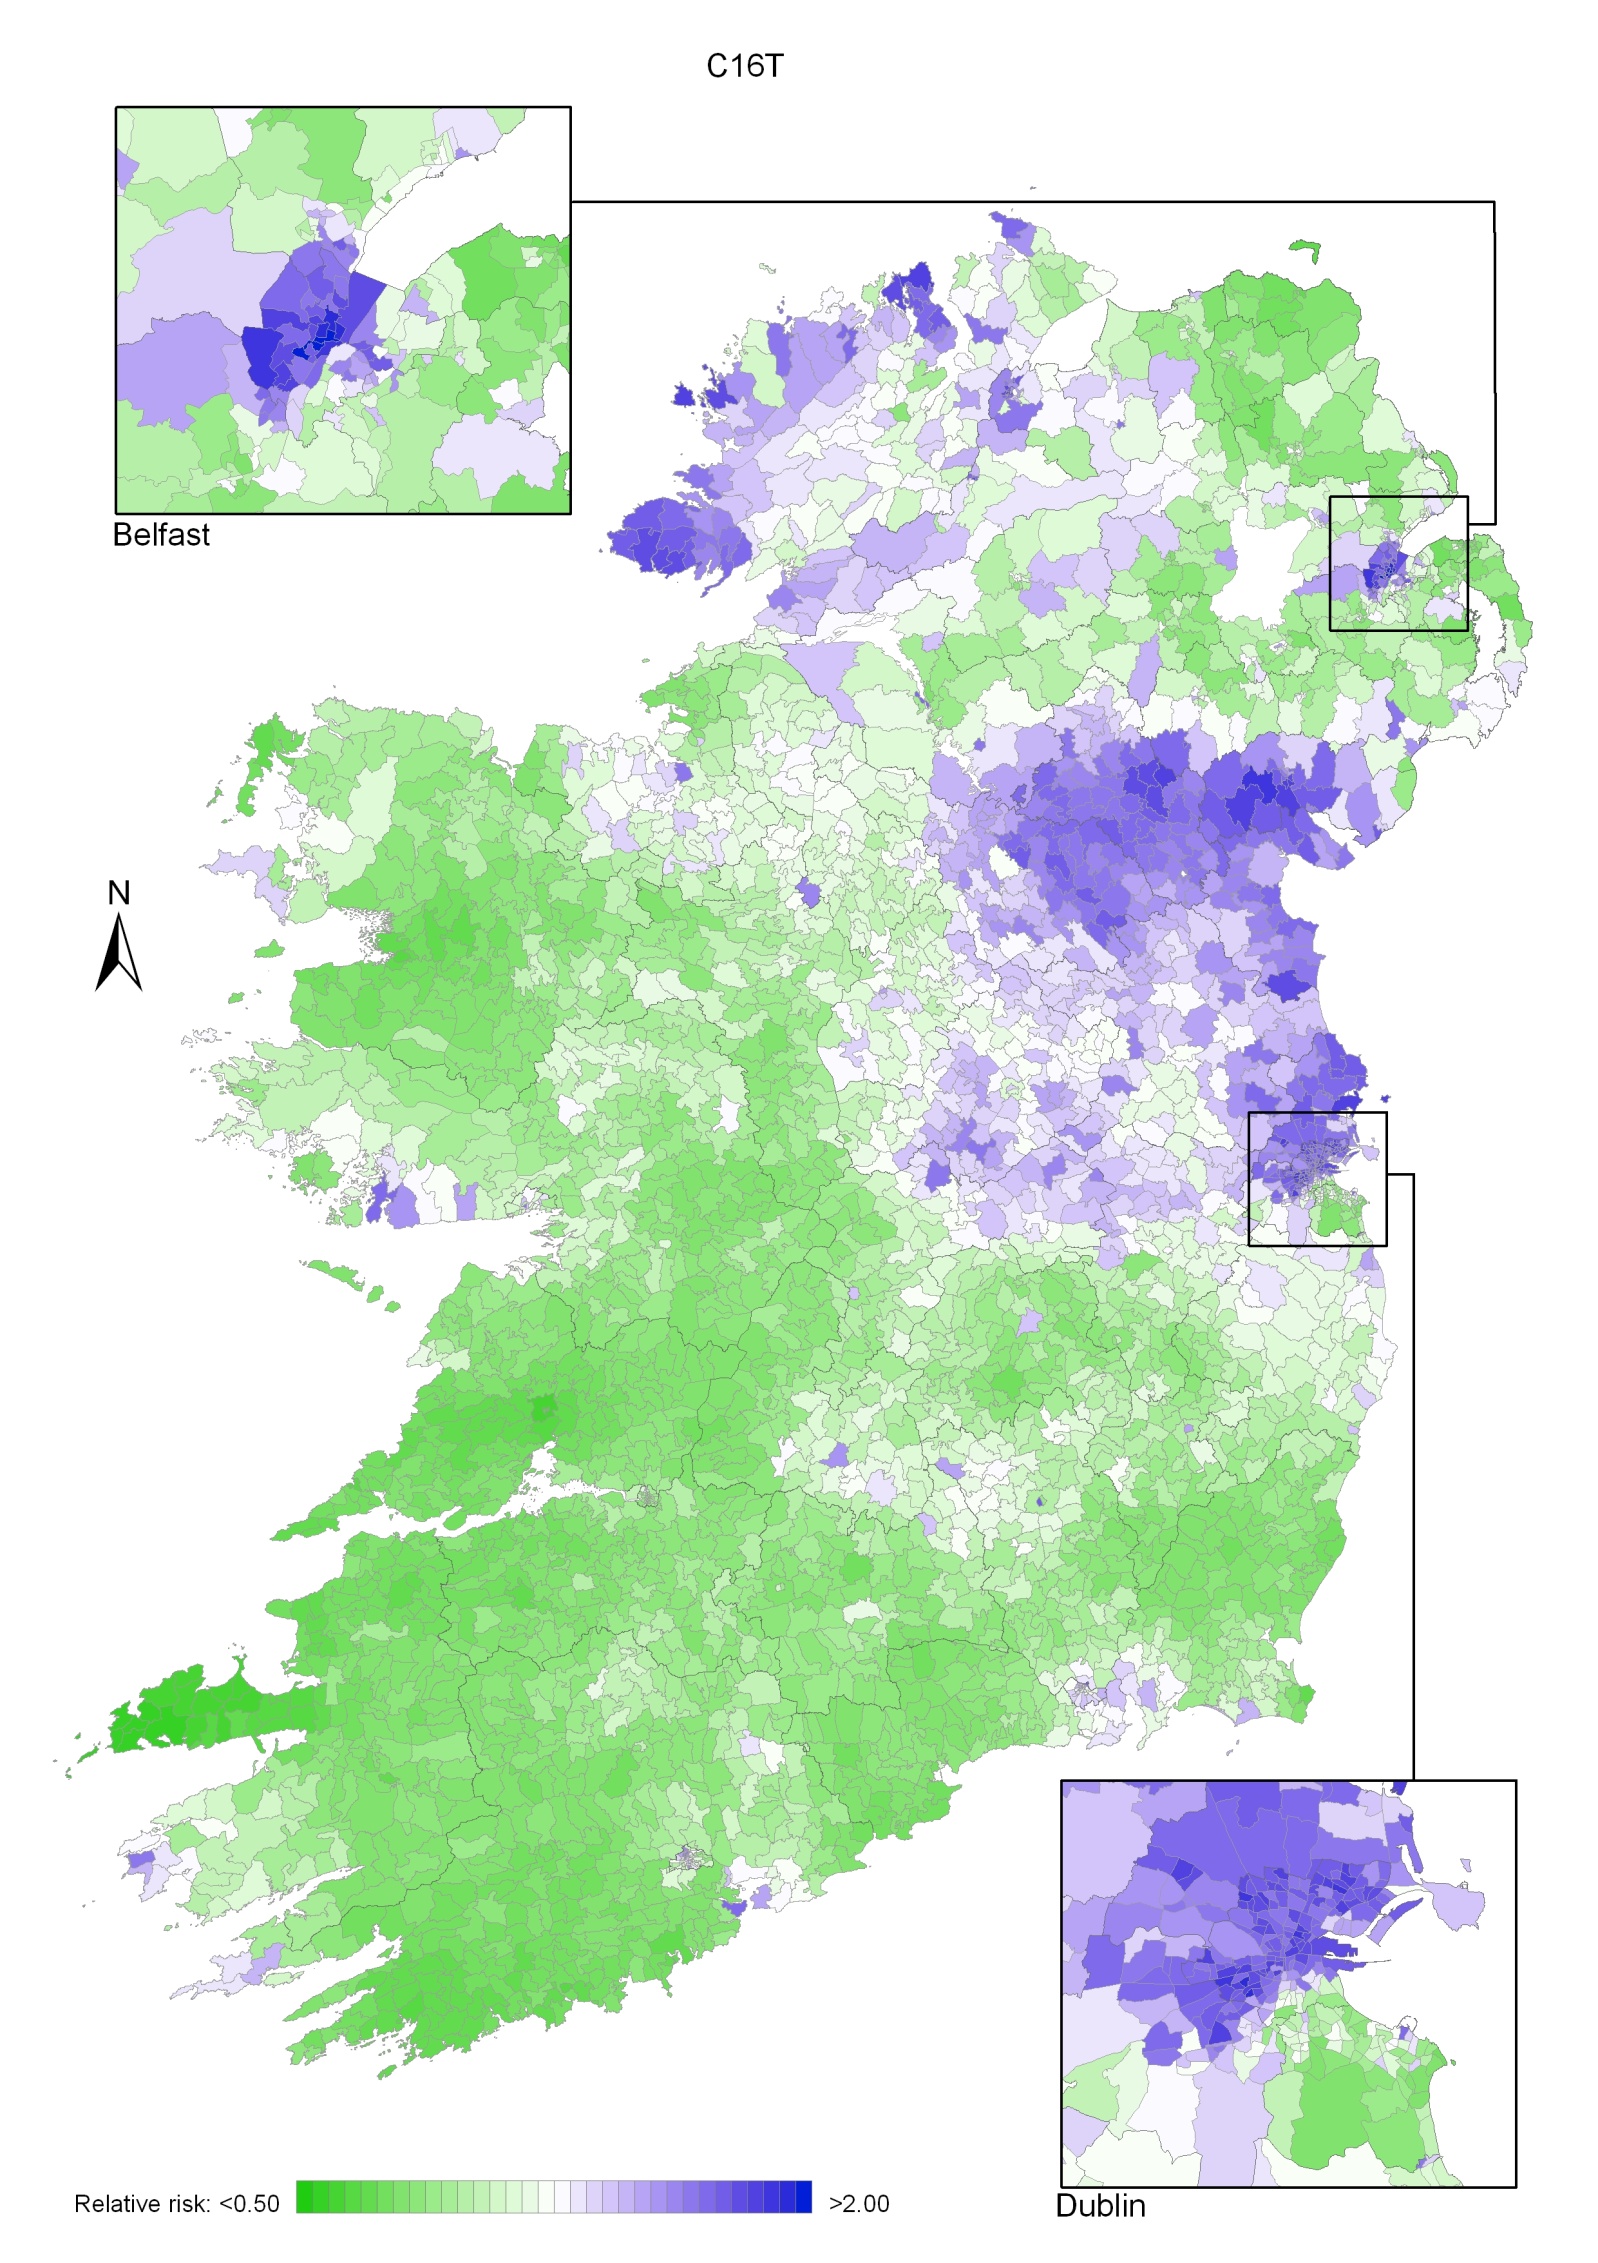
Map 9.2 Stomach cancer, smoothed relative risks: males
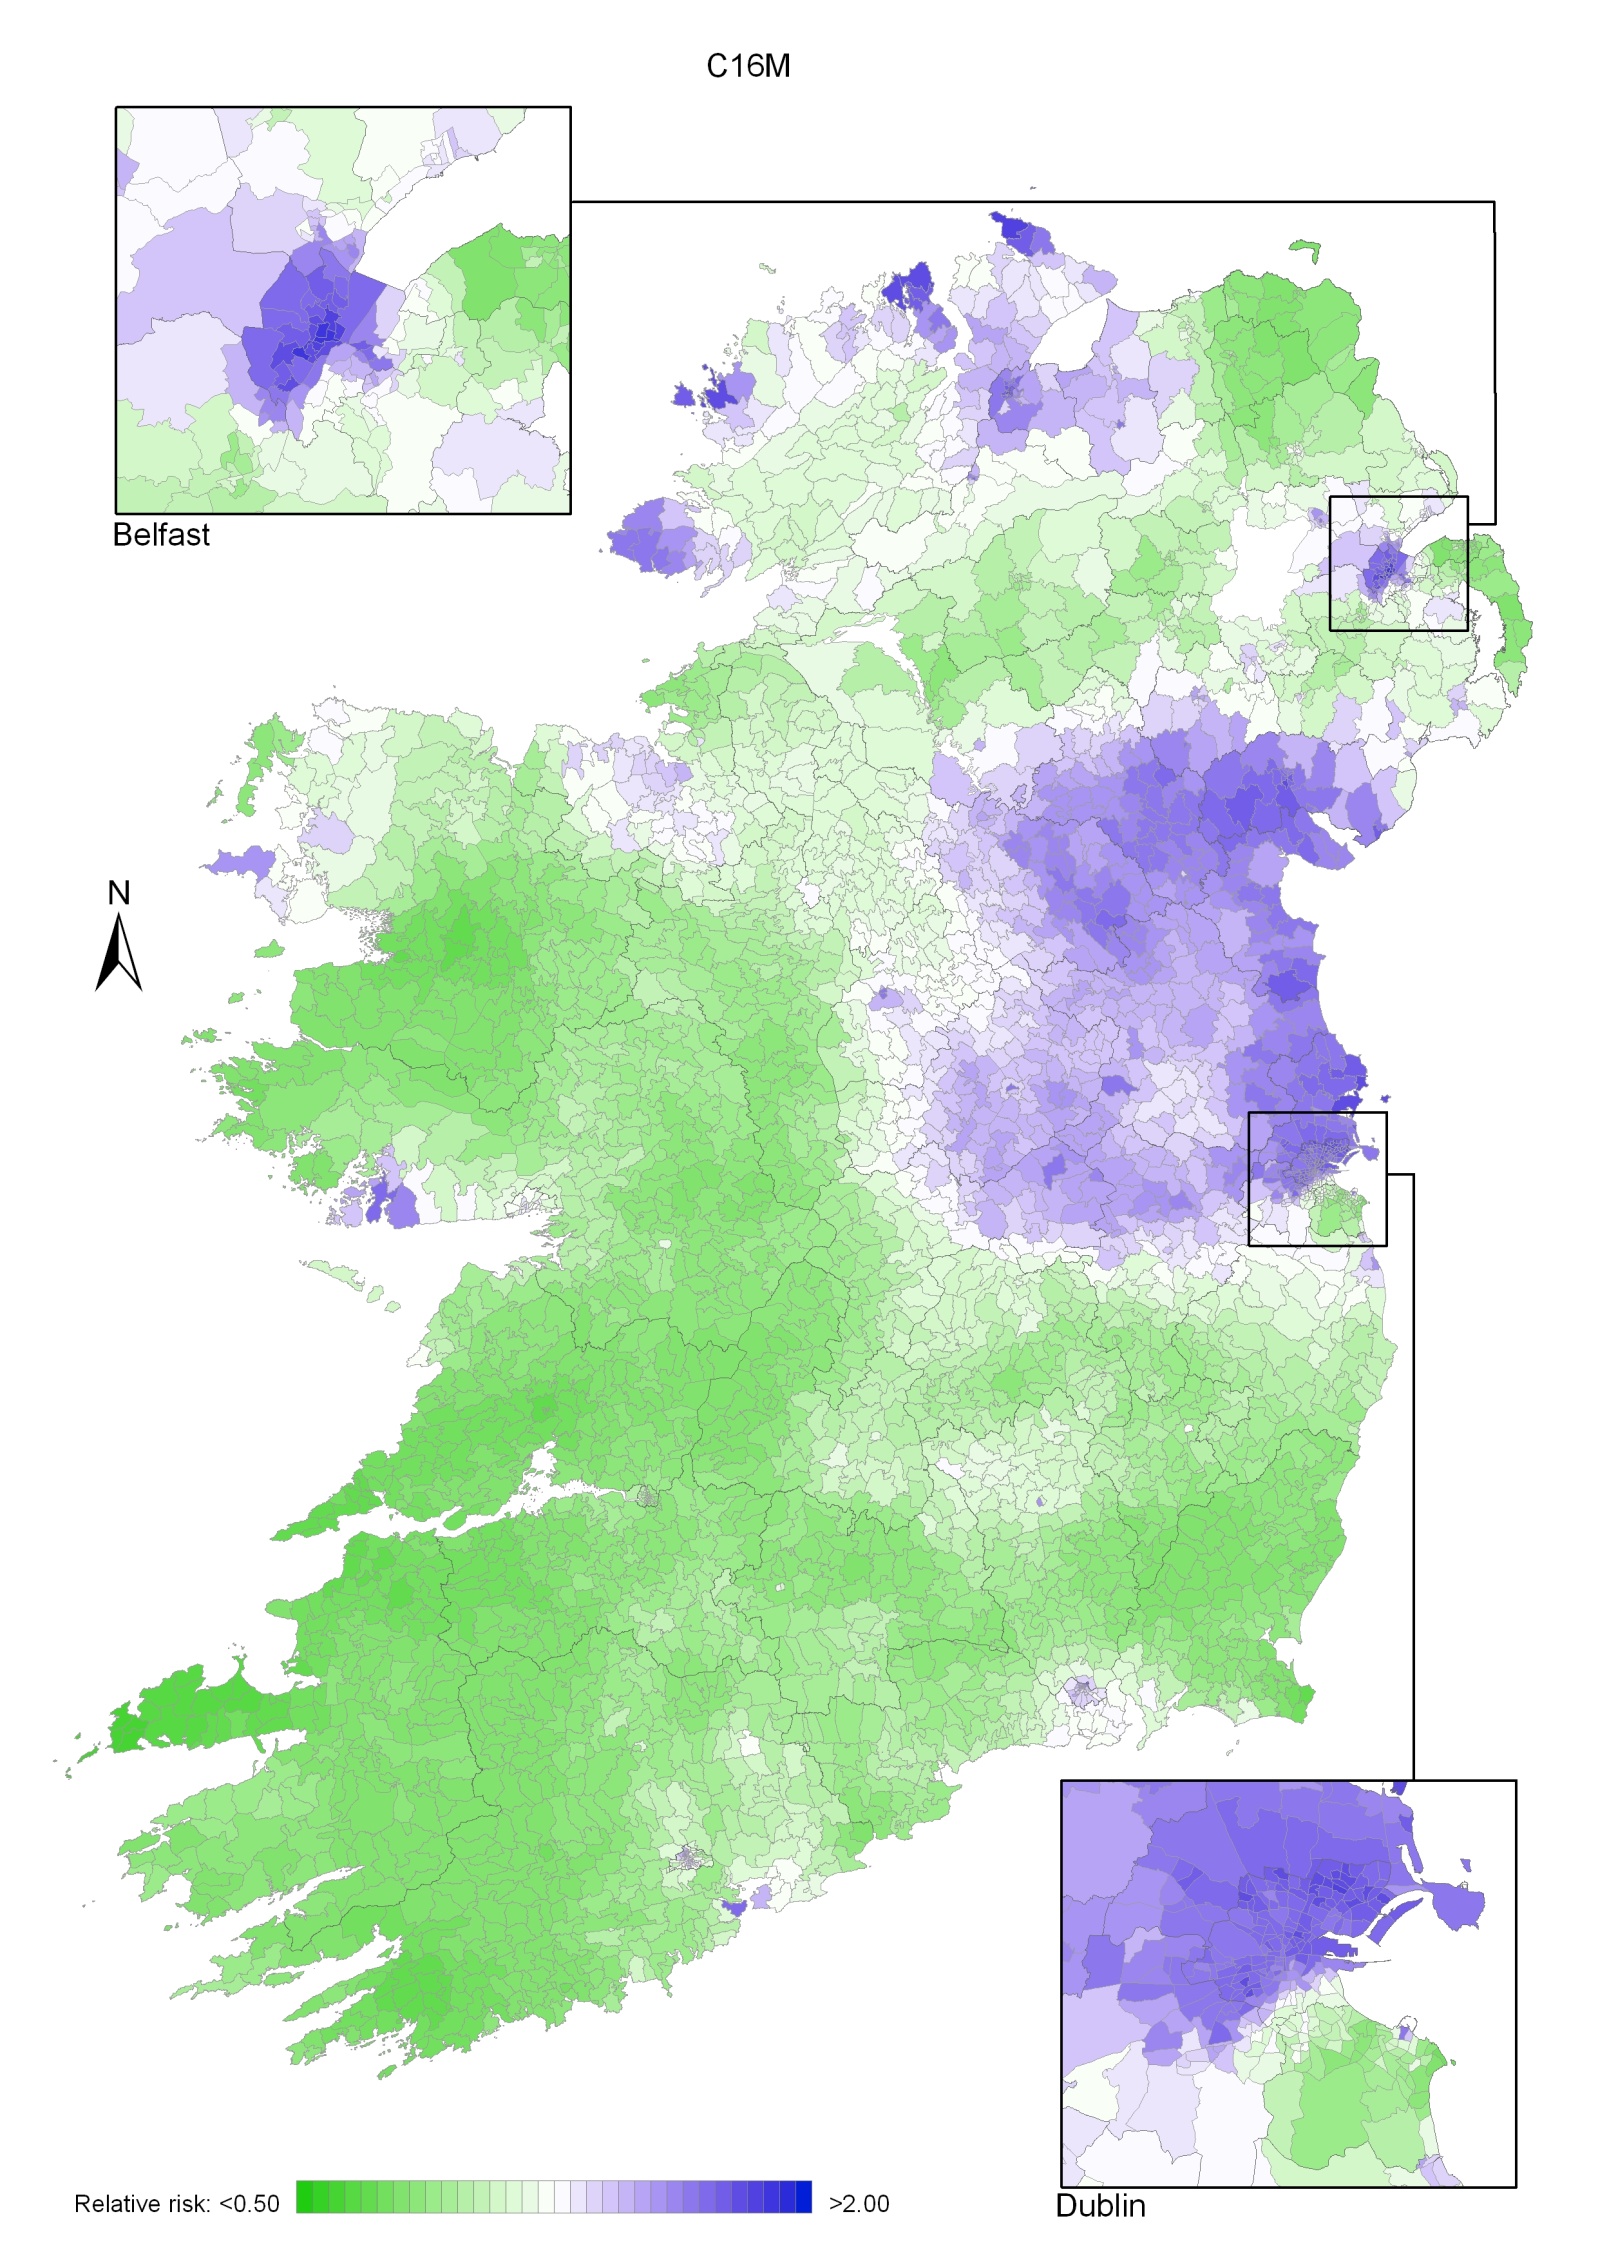
Map 9.3 Stomach cancer, smoothed relative risks: females
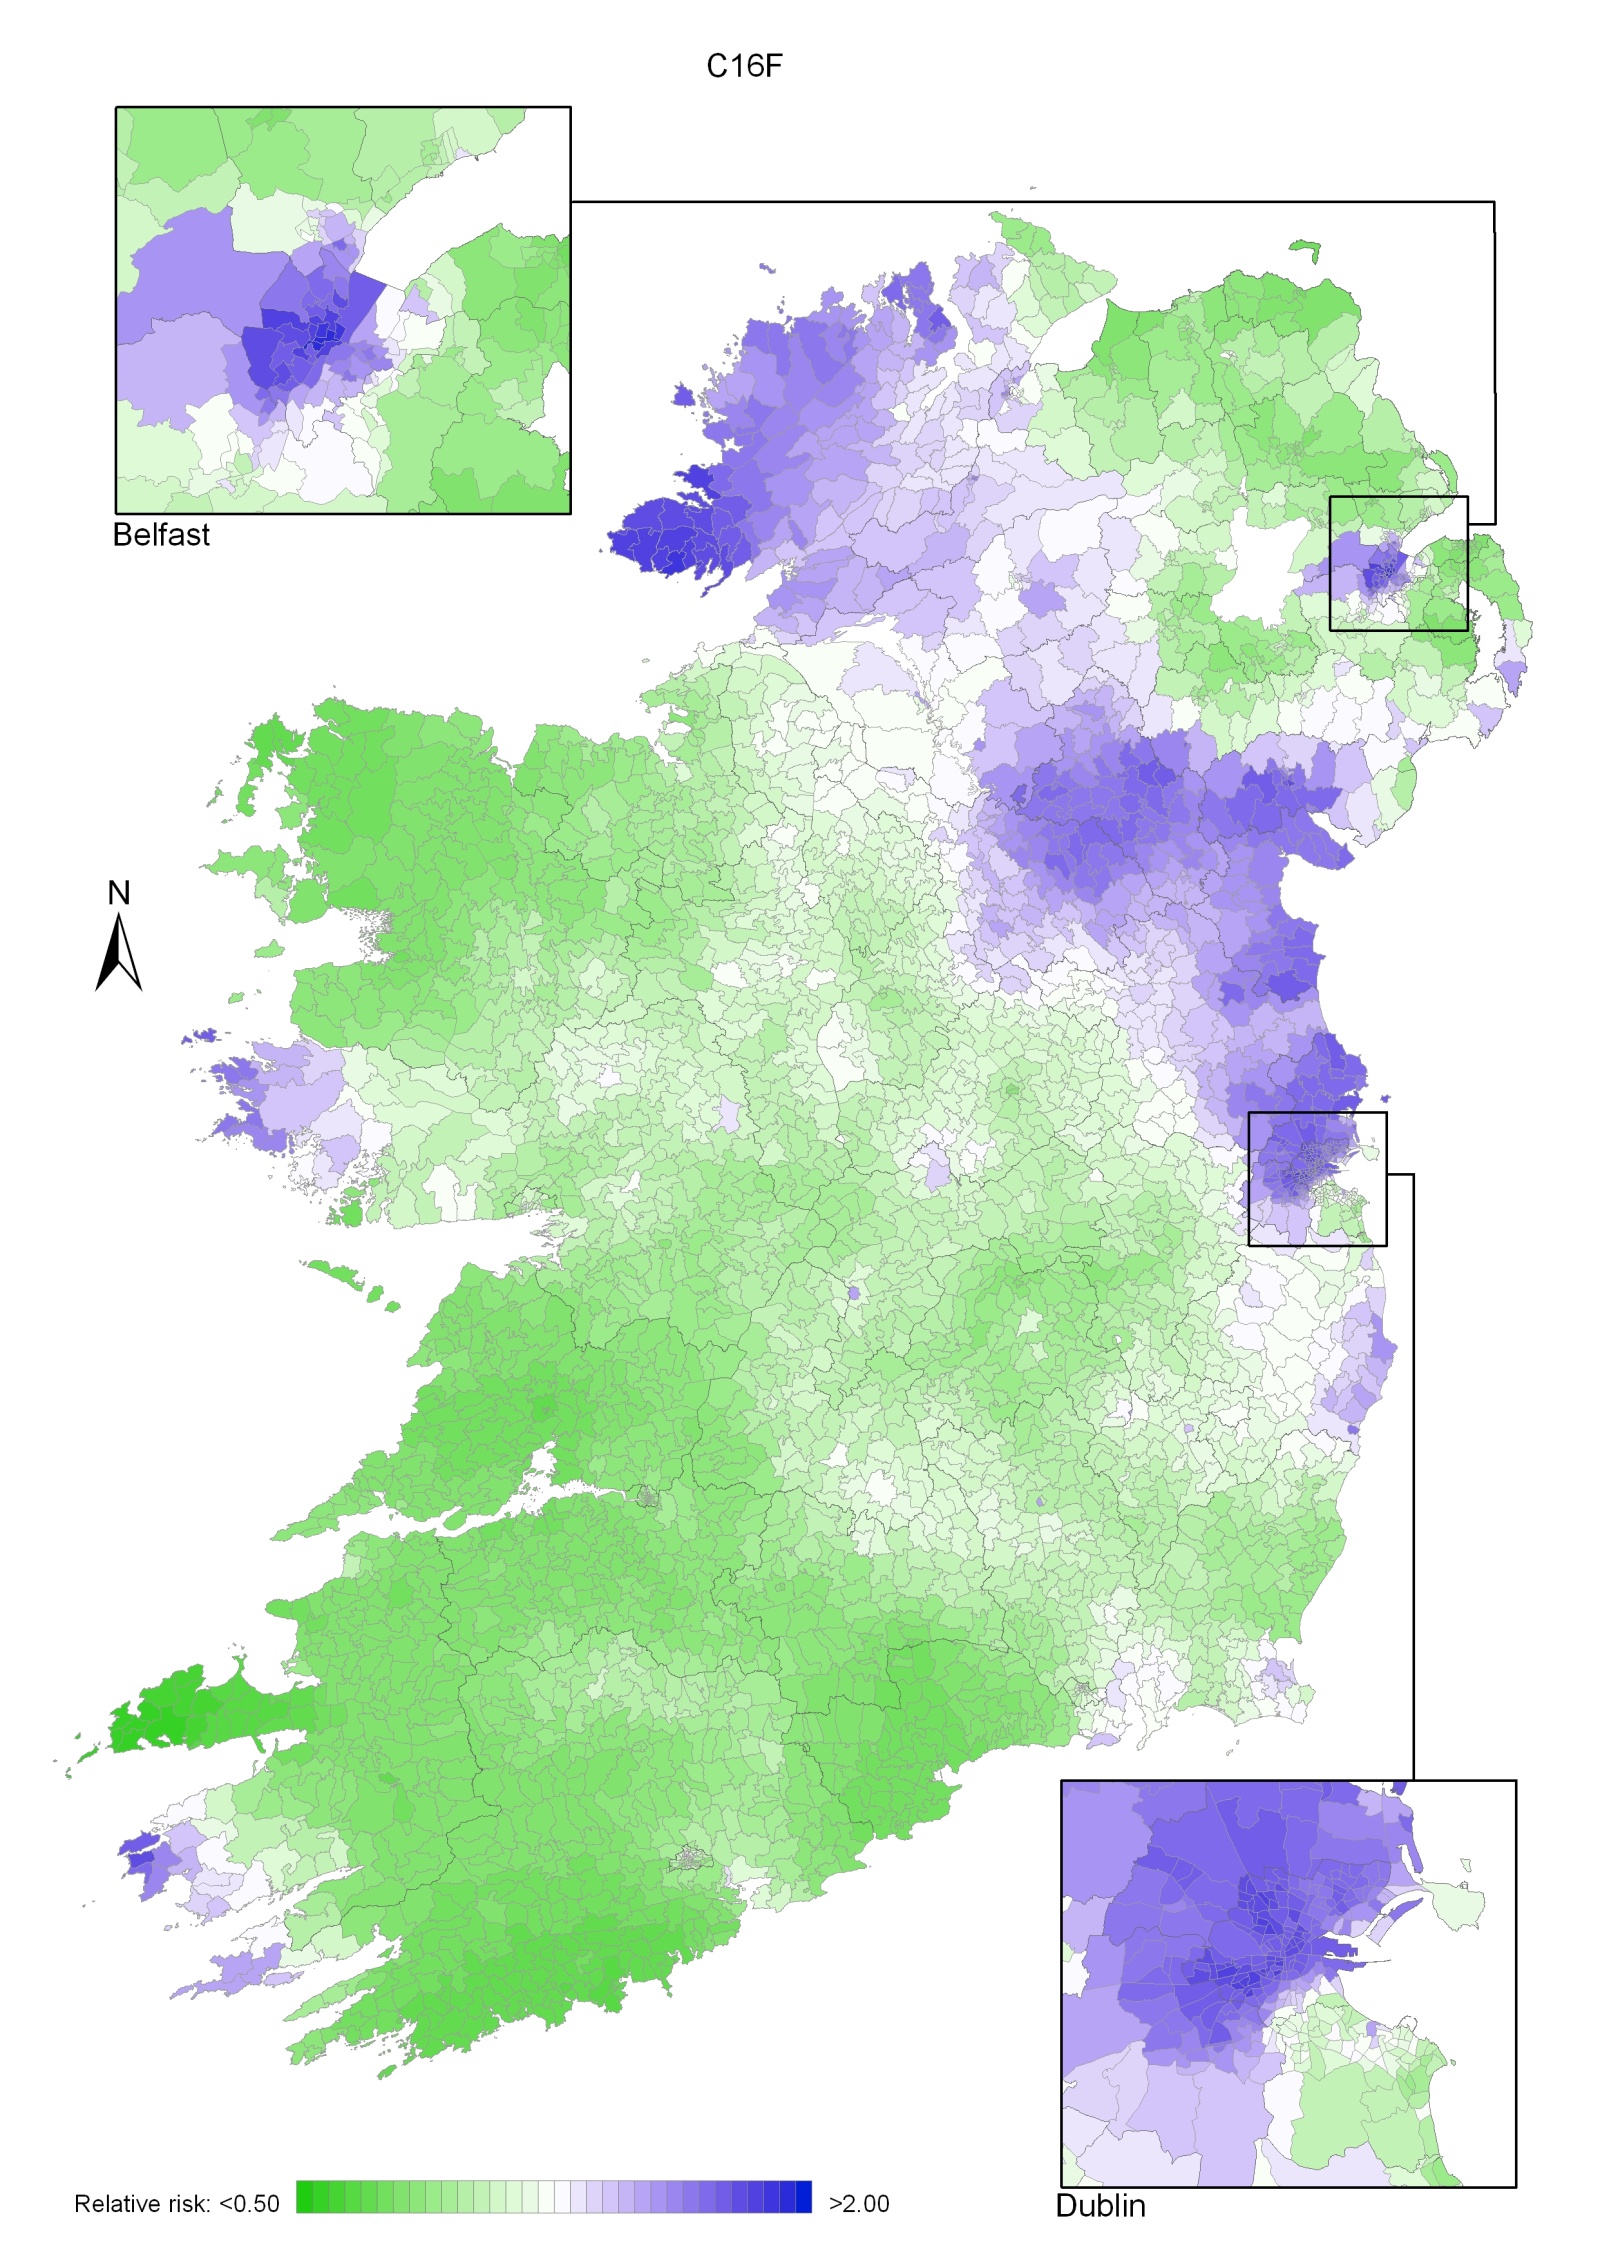
Melanoma of the skin was the seventh most common cancer in Ireland, accounting for 4.1% of all malignant neoplasms, excluding non-melanoma skin cancer, in women and 2.6% in men (Table 10.1). The average number of new cases diagnosed each year was 421 in women and 285 in men. During 1995-2007, the number of new cases diagnosed increased at approximately 5% per annum overall.
The risk of developing melanoma up to the age of 74 was 1 in 89 for women and 1 in 116 for men, and was slightly higher in RoI than in NI. At the end of 2008, 2,991 women and 1,707 men aged under 65, and 2,140 women and 1,336 men aged 65 and over, were alive up to 15 years after their melanoma diagnosis.
Table 10.1 Summary information for melanoma of the skin in Ireland, 1995-2007
Ireland | RoI | NI | ||||
females | males | females | males | females | males | |
% of all new cancer cases | 3.0% | 1.9% | 3.1% | 1.9% | 2.7% | 1.8% |
% of all new cancer cases excluding non-melanoma skin cancer | 4.1% | 2.6% | 4.3% | 2.6% | 3.6% | 2.5% |
average number of new cases per year | 421 | 285 | 298 | 201 | 123 | 84 |
cumulative risk to age 74 | 1.1% | 0.9% | 1.2% | 0.9% | 1.0% | 0.8% |
15-year prevalence (1994-2008) | 5131 | 3043 | 3525 | 2074 | 1606 | 969 |
Melanoma of the skin is a disease of younger age groups, with 36% of women and 31% of men aged under 50 at diagnosis (Figure 10.1). Over half of all new cases presented under 60 years. However, a substantial proportion of cases (12-13%) was diagnosed in the age group 80 and older. Age patterns were similar for RoI and NI.
Figure 10.1 Age distribution of cases of melanoma of the skin in Ireland, 1995-2007, by sex
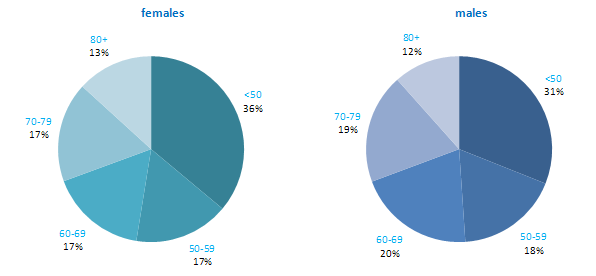
For both men and women Australia and New Zealand had the highest incidence rates of melanoma, while Japan had the lowest (Figure 10.2). Both RoI and NI had moderate rates of melanoma compared to other developed countries. Rates in both parts of Ireland were lower than in the UK.
Figure 10.2 Estimated incidence rate per 100,000 in 2008 for selected developed countries compared to 2005-2007 incidence rate for RoI and NI: malignant melanoma of skin | |
| females | males |
 | 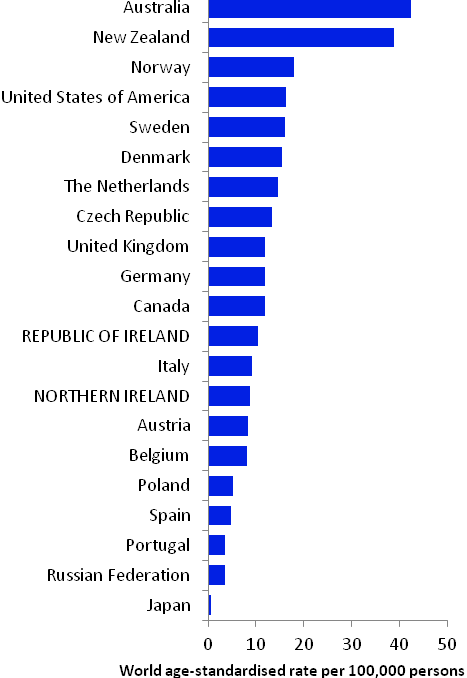 |
Source: GLOBOCAN 2008 (Ferlay et al., 2008) (excluding RoI and NI data, which is derived from Cancer Registry data for 2005-2007). | |
Table 10.2 Risk factors for melanoma of the skin, by direction of association and strength of evidence
| Increases risk | Decreases risk |
Convincing or probable | Sun exposure (mainly recreational)1-3 | |
| Sunbed/sunlamp use4 | |
| History of sunburn1-3,5 | |
| Presence of benign sun damage in the skin2,5 | |
| Number of naevi2,6,7 | |
| Density of freckles or freckling as a child2,8 | |
| Skin, hair and eye colour1,2,8,9 | |
| Ability to tan2 | |
| Family history of melanoma8,10,11 | |
| High socio-economic status12 | |
Possible | Body fatness and weight gain in adulthood13,14 | |
1 International Agency for Research on Cancer, 2001; 2 Armstrong and Kricker, 2001; 3 Gandini et al., 2005a; 4 El Ghissasi et al., 2009; 5 Olsen et al., 2011; 6 risk raised for high numbers of either common or atypical naevi or both; 7 Olsen et al., 2010b; 8 Gandini et al., 2005b; 9 Olsen et al., 2010b; 10 Olsen et al., 2010c; 11 melanoma in one or more first degree relatives; 12 Faggiano et al., 1997; 13 Olsen et al., 2008; 14 Renehan et al., 2008 | ||
Exposure to ultraviolet (UV) radiation, the primary source of which is sunlight, is the main cause of melanoma of the skin (Table 10.2). Risk increases with increasing levels of intermittent, or recreational, sun exposure. A history of sunburn, often considered to be a marker of high levels of intermittent sun exposure, is associated with raised risk in a dose-response fashion. Presence of benign sun damage (solar keratoses) is a marker of increased risk, particularly for melanomas on the head and neck. Exposure to artificial UV radiation, through use of sunbeds or sunlamps, also causes melanoma. Constitutional factors act together with UV exposure to influence the chance of an individual developing melanoma. Risk is increased in those with more naevi (moles), a high density of freckles (or who had freckling as a child), light hair, skin or eye colour, and less ability to tan.
Melanoma risk is higher in those of higher socio-economic status. This may be due to greater recreational sun exposure among more affluent groups.
Individuals with one or more first degree relatives who have had melanoma have a two-fold increased risk of developing it themselves. On average, around 4% of cases of melanoma are estimated to be attributable to familial risk.
In terms of more tentative associations, modest positive relationships have been reported between melanoma risk and higher body mass index in men and weight gain in adulthood in women.
Figure 10.3 Adjusted relative risks (with 95% confidence intervals) of melanoma of the skin by socio-economic characteristics of geographic area of residence: males
| MalesThe relative risk of melanoma of the skin among men was 8% lower in NI than in RoI (Figure 10.3). Once differences in population density and socio-economic factors were adjusted for, this difference increased to 15%. Areas with average (1-15 p/ha) population density had a 20% greater risk of male melanoma than the least densely populated areas. Areas with the highest levels of unemployment had a reduced risk of melanoma among men. A strong inverse relationship was also present with regard to lower levels of educational attainment in an area. Compared to areas with high levels of tertiary level education, the relative risk of melanoma in areas with low levels of tertiary level education was 0.66 (95%CI = 0.58-0.75). Men resident in areas with between 36% and 42% of elderly people living alone (quintile 4) had an 18% greater risk of melanoma. |
Figure 10.4 Adjusted relative risks (with 95% confidence intervals) of melanoma of the skin by socio-economic characteristics of geographic area of residence: females
| FemalesAmong women, lung cancer risk was higher in NI compared to RoI (RR=1.07, 95%CI=1.01-1.13) (Figure 6.4). However, adjusting for population density and socio-economic factors reversed this relationship, with risk lower in NI (RR=0.92, 95%CI=0.88-0.97). For women the association between lung cancer and population density was greater than for men, with lung cancer risk 74% higher in high density compared to low density areas. Lung cancer among women was higher in areas of high unemployment, lower levels of degree level education and with a high proportion of elderly living alone. The relative risk for people living in areas with the highest proportion of these indicators was 45%, 23% and 9% respectively, compared to the areas with the lowest proportion of these indicators. |
Melanoma of the skin had a strong geographical pattern which was similar for men and women. Areas of higher relative risk were seen along the south coast from Cork to Wexford, and also along the east coast from Meath to Wicklow and in parts of Larne, Castlereagh, Ards, Down, Armagh, Craigavon, Banbridge, Newry and Mourne, Kerry, Limerick, Galway and Mayo (Map 10.1).
The pattern for men was similar to that for both sexes combined (Map 10.2)
For women (Map 10.3) the area of higher risk was slightly more dispersed around Dublin. Areas of higher relative risk were also seen in western parts of Galway and Mayo and in north Leinster.
Map 10.1 Melanoma of the skin, smoothed relative risks: both sexes

Map 10.2 Melanoma of the skin, smoothed relative risks: males
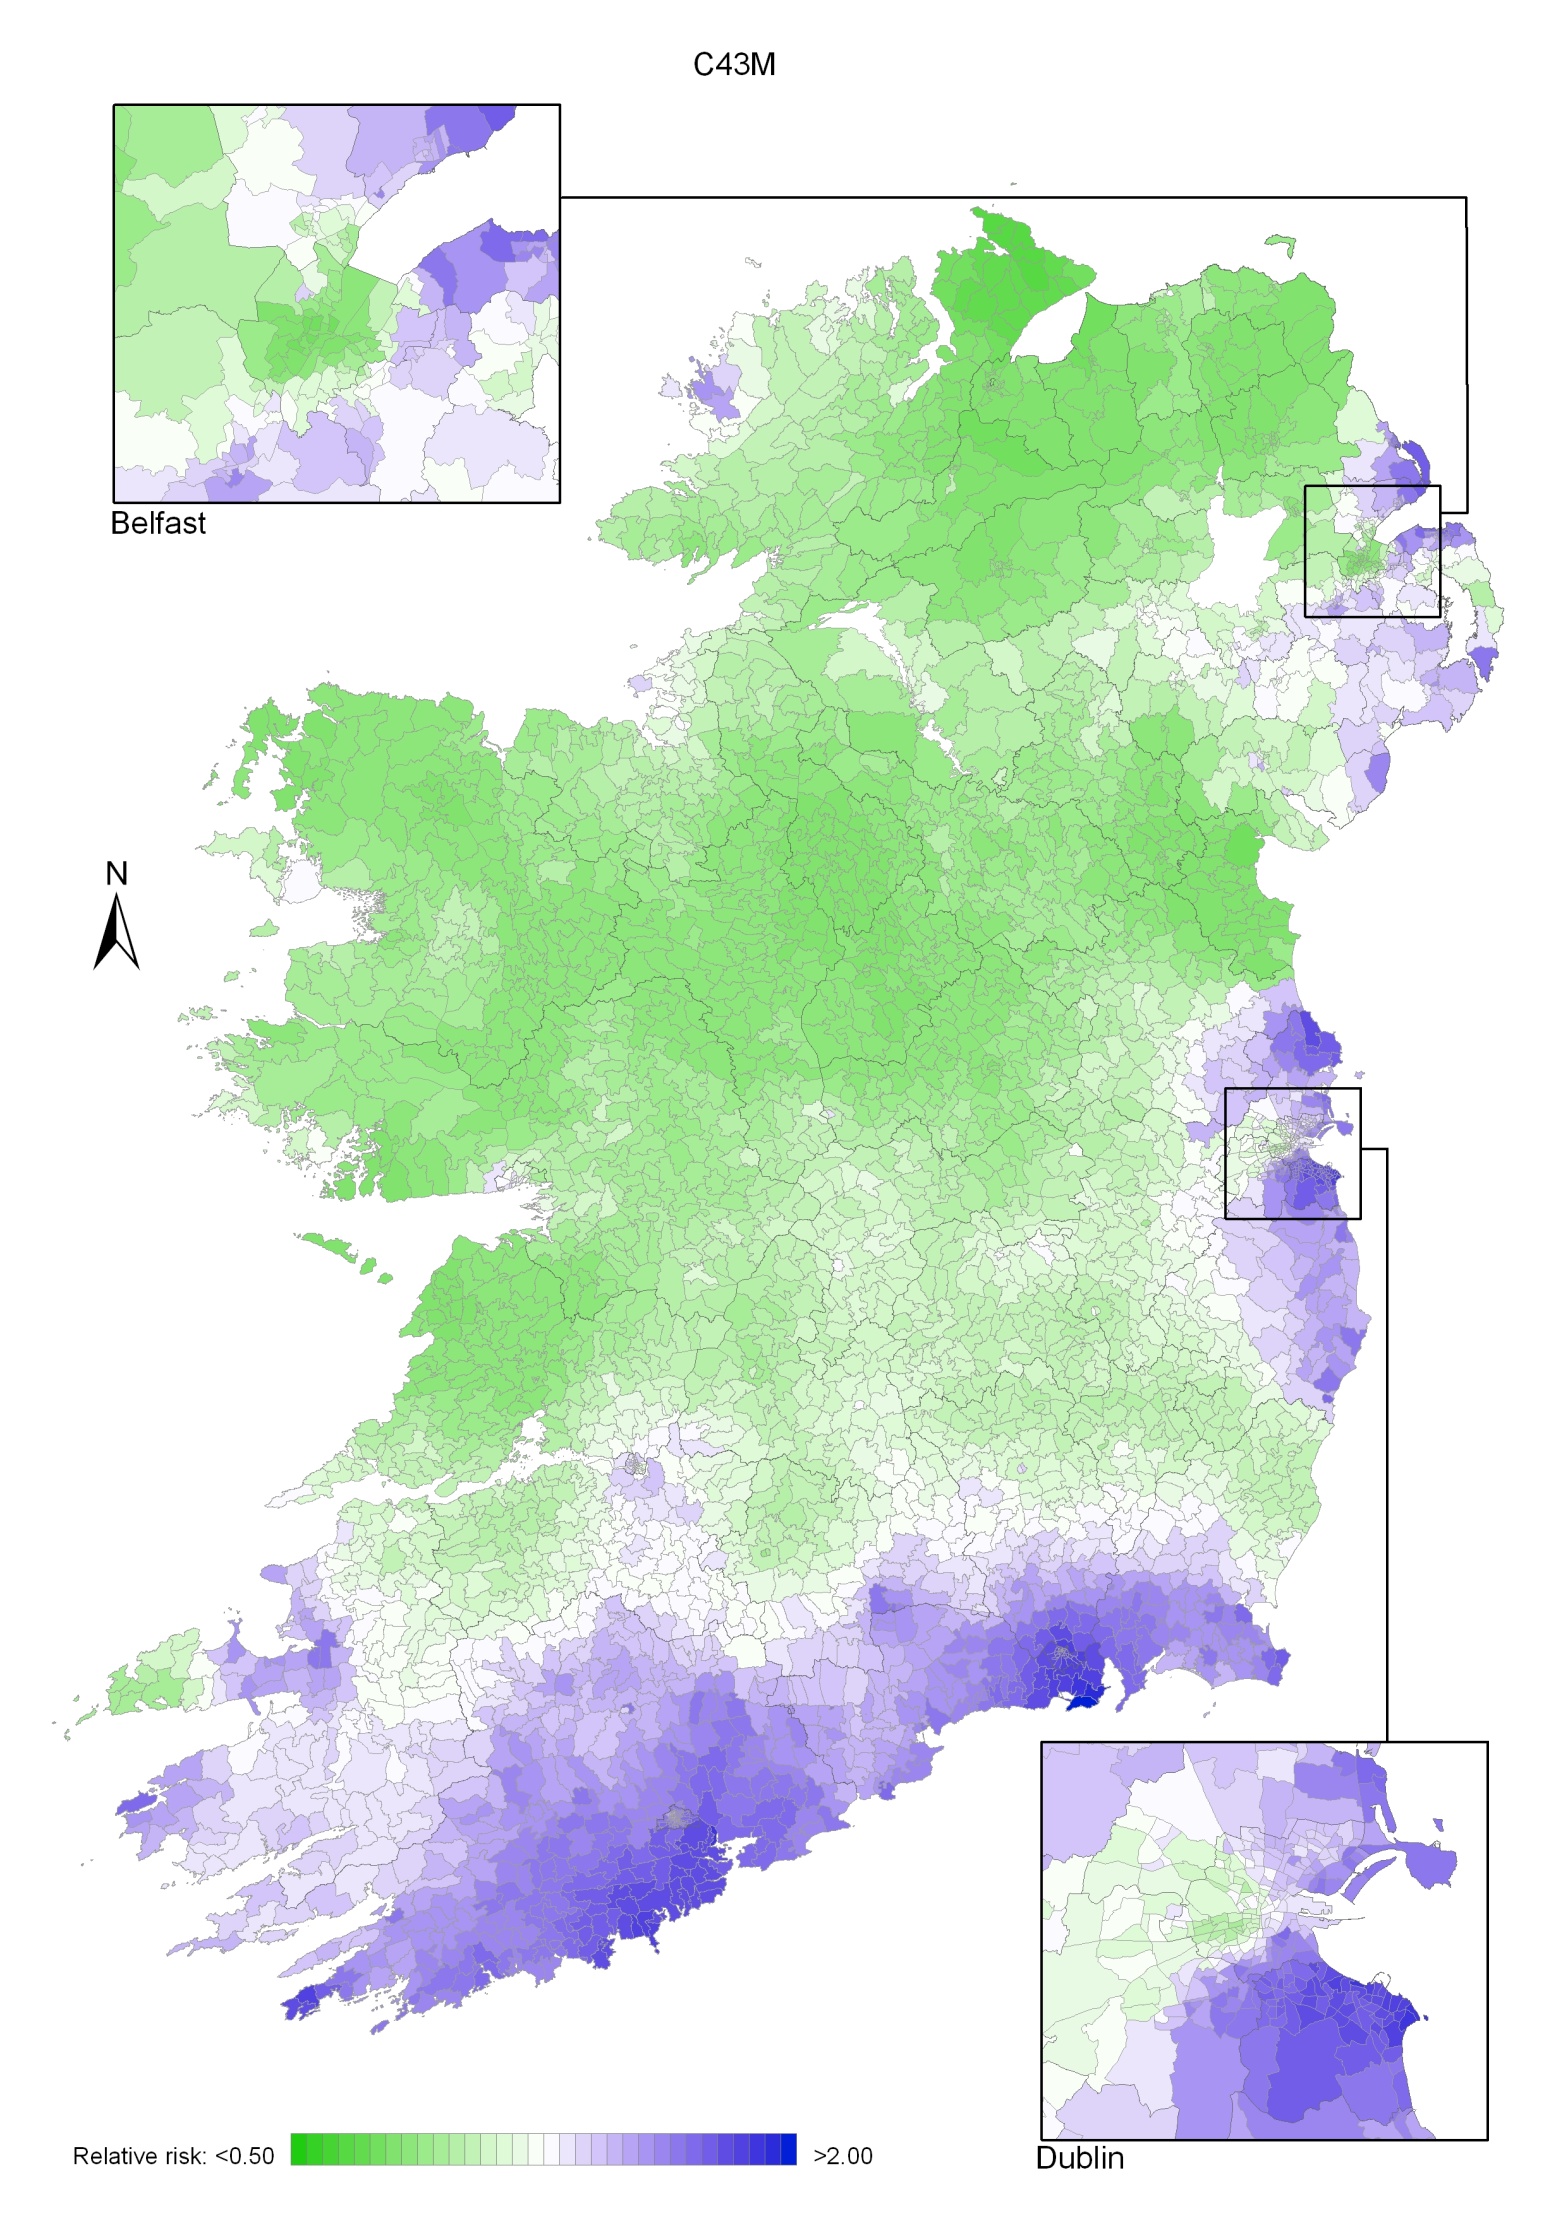
Map 10.3 Melanoma of the skin, smoothed relative risks: females
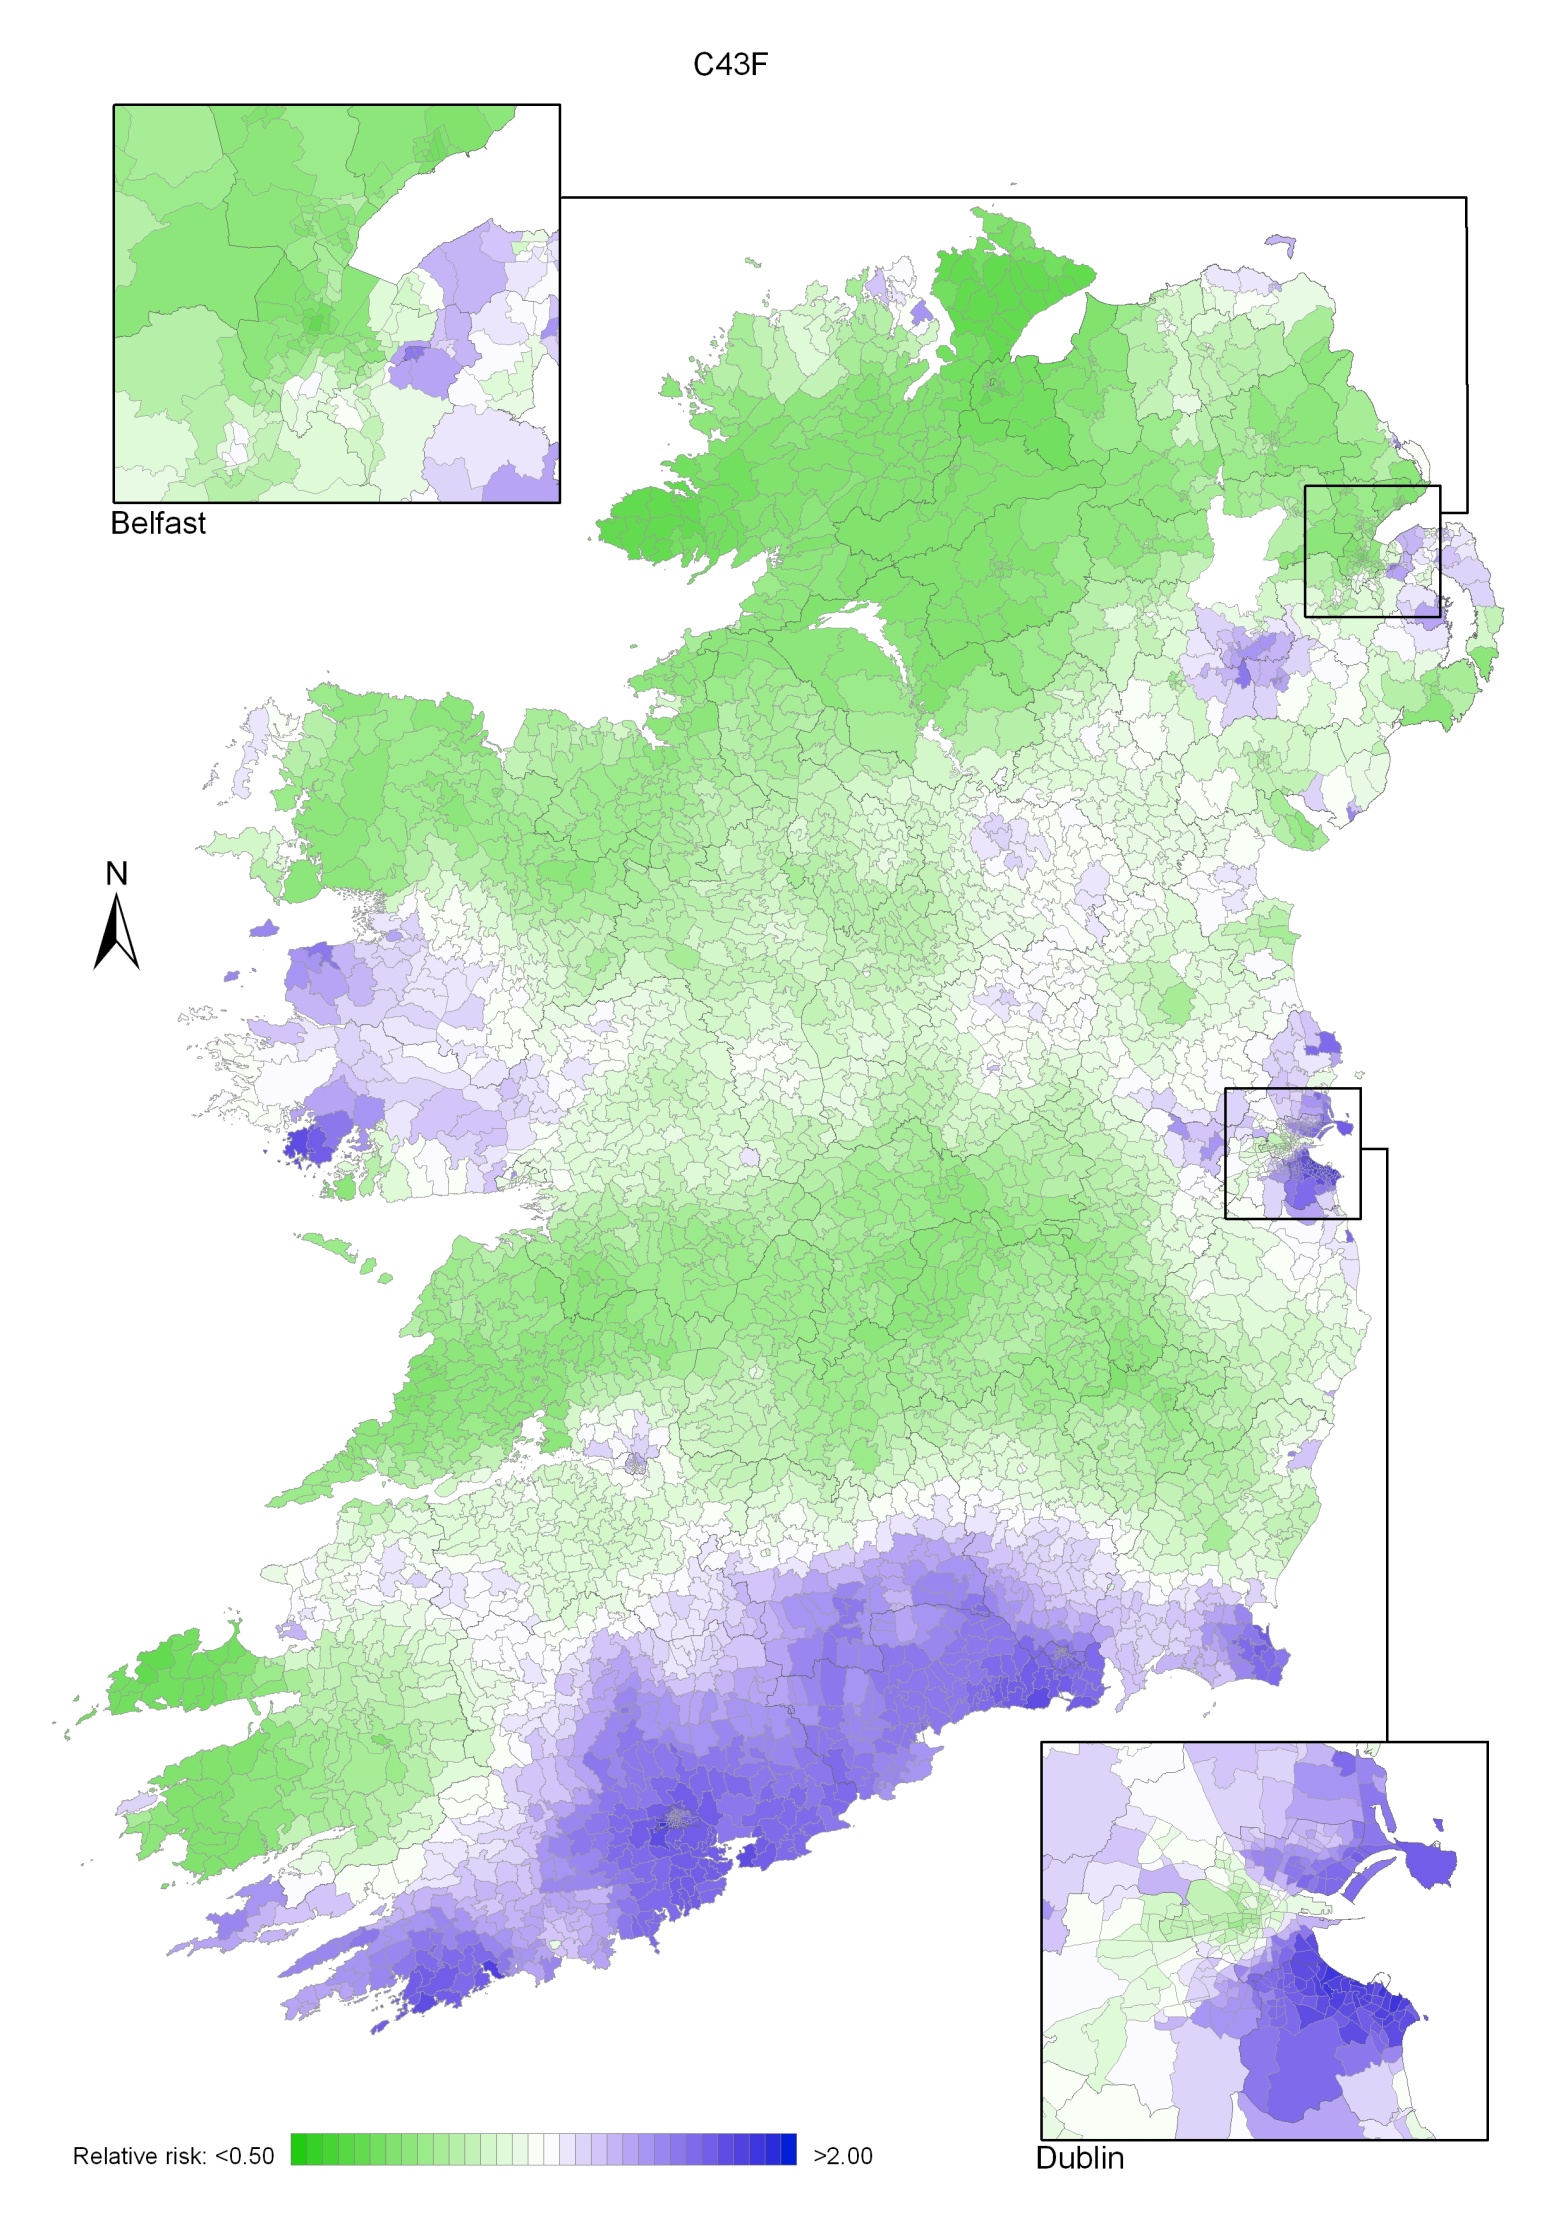
Bladder cancer was the fourth most common cancer in Ireland for men and the twelfth most common for women, accounting for 1.9% of all malignant neoplasms, excluding non-melanoma skin cancer, in women and 4.4% in men (Table 11.1). The average number of new cases diagnosed each year was 193 in women and 479 in men. During 1995-2007, the number of new cases diagnosed per annum remained fairly constant.
The risk of developing bladder cancer up to the age of 74 was 1 in 212 for women and 1 in 72 for men and was slightly higher in RoI than in NI. At the end of 2008, 326 women and 787 men aged under 65, and 981 women and 2,527 men aged 65 and over, were alive up to 15 years after their bladder cancer diagnosis.
Table 11.1 Summary information for bladder cancer in Ireland, 1995-2007
Ireland | RoI | NI | ||||
females | males | females | males | females | males | |
% of all new cancer cases | 1.4% | 3.1% | 1.4% | 3.1% | 1.3% | 3.2% |
% of all new cancer cases excluding non-melanoma skin cancer | 1.9% | 4.4% | 1.9% | 4.4% | 1.8% | 4.4% |
average number of new cases per year | 193 | 479 | 133 | 331 | 60 | 147 |
cumulative risk to age 74 | 0.5% | 1.4% | 0.5% | 1.4% | 0.4% | 1.3% |
15-year prevalence (1994-2008) | 1307 | 3314 | 972 | 2346 | 335 | 968 |
The distribution of age at diagnosis for bladder cancer was similar for men and women. Almost 60% of new cases were aged 70 or older at diagnosis (Figure 11.1). Only about 6% of cases presented at under 50 years of age. Age at diagnosis was slightly younger in RoI than in NI.
Figure 11.1 Age distribution of bladder cancer cases in Ireland, 1995-2007, by sex
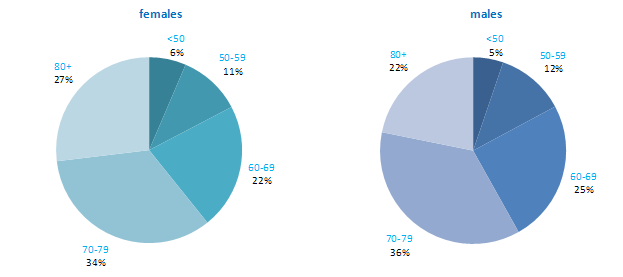
Male and female rates of bladder cancer in NI were among the lowest of the 21 developed countries examined, with RoI also having a comparatively low incidence in men but not women (Figure 11.2). Female rates were much lower overall than male rates, and varied somewhat less. Spain had the highest rate of bladder cancer among men, while Denmark had the highest rate among women. However, caution needs to be exercised in making international comparisons of bladder cancer incidence, as classification of the disease with regard to malignant and non-malignant cancers is not consistent across countries.
Figure 11.2 Estimated incidence rate per 100,000 in 2008 for selected developed countries compared to 2005-2007 incidence rate for RoI and NI: bladder cancer | |
| females | males |
 | 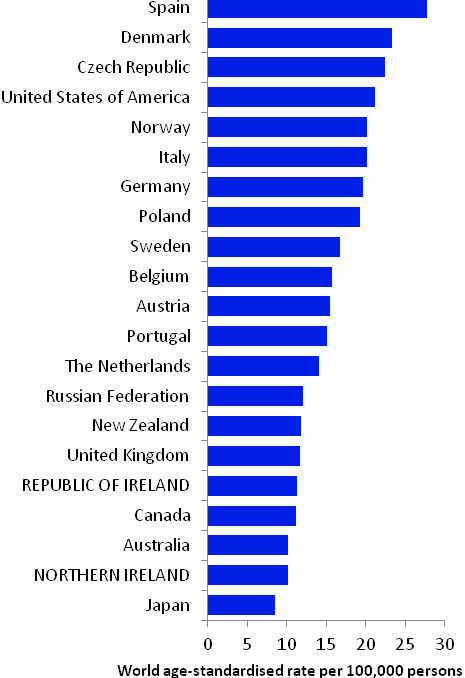 |
Source: GLOBOCAN 2008 (Ferlay et al., 2008) (excluding RoI and NI data, which is derived from Cancer Registry data for 2005-2007) | |
Table 11.2 Risk factors for bladder cancer, by direction of association and strength of evidence
| Increases risk | Decreases risk |
Convincing or probable | Tobacco smoking1 | |
| Various occupations and employment in particular industries and product manufacture2-8 | |
| Occupational exposure to aromatic amines and polycyclic aromatic hydrocarbons 3,4 | |
| Ionizing radiation9 | |
| Arsenic and inorganic arsenic compounds10 | |
Possible | Volume of tap water consumed11 | Having had children16 |
Disinfection by-products in drinking water12,13 | Non-steroidal anti-inflammatory drugs (other than aspirin)17 | |
Type II diabetes14 | Selenium18 | |
Infection with human papilloma viruses (HPV)15 | ||
Early menopause16 | ||
| ||
1 Secretan et al., 2009; 2 Reulen et al., 2008; 3 Scélo and Brennan, 2007; 4 Baan et al., 2009; 5 Reulen et al., 2008; 6 Manju et al., 2009; 7 Guha et al., 2010; 8 Harling et al., 2010; 9 El Ghissassi et al., 2009; 10 Straif et al., 2009 11 Villaneuva et al., 2006; 12 Villanueva et al., 2004; 13 Costet et al., 2011; 14 Larsson et al., 2006; 15 Li et al., 2011; 16 Dietrich et al., 2011; 17 Daugherty et al., 2011; 18 Amaral et al., 2010 | ||
The leading known cause of cancer of the bladder is tobacco smoking (Table 11.2). Two-thirds of bladder cancers in men and one-third in women are considered to be due to smoking (Brennan et al., 2000; Brennan et al., 2001). Risk increases with duration of cigarette smoking and number of cigarettes smoked (International Agency for Research on Cancer, 2004b). Risk is also increased in those who smoke pipes or cigars, but do not smoke cigarettes (Pitard et al., 2001). Stopping smoking results in an immediate decrease in risk (Scélo and Brennan, 2007).
A range of occupations (including painting, mining, bus driving, motor mechanic, blacksmith, machine setter and hairdressing) and employment in various industries or in manufacturing of specific products (including rubber manufacturing, aluminium production and magenta manufacture) are associated with bladder cancer. In terms of specific occupational exposures which cause bladder cancer, the most consistent evidence relates to aromatic amines and polycyclic aromatic hydrocarbons.
Other than smoking and occupational exposures, the factors involved in bladder cancer aetiology are largely unknown, although several putative relationships have been suggested. Positive associations have been reported between volume of tap water consumed and bladder cancer risk. This may be due to increased intake of carcinogenic chemicals contained in the water, such as arsenic (which is a recognised cause of bladder cancer) or disinfection by-products (e.g. trihalomethanes, the main by-product of chlorinated water), but the results of studies are not consistent.
Individuals with type II diabetes may have a modest increased risk of developing bladder cancer. A meta-analysis of studies investigating human papilloma virus (HPV) infection and bladder cancer estimated that risk could be increased by almost 3-fold in infected individuals. In another meta-analysis, bladder cancer risk was reduced by one-third in ever parous women (those who had had one or more children), and was elevated among those undergoing an early menopause. Non-smokers who regularly use non-steroidal anti-inflammatory drugs other than aspirin may have reduced bladder cancer risk, although aspirin use itself does not appear to be associated with risk. Those with higher levels of selenium measured in serum or toenails may also have lower risk.
Figure 11.3 Adjusted relative risks (with 95% confidence intervals) of bladder cancer by socio-economic characteristics of geographic area of residence: males | MalesAmong men the risk of bladder cancer was lower in NI than RoI (RR=0.92, 95%CI=0.87-0.97) (Figure 11.3). This difference increased when adjusted for population density and socio- economic characteristics (RR=0.83, 95%CI= 0.78-0.88). There was a strong association between population density and bladder cancer for men, with the risk 30% higher in high density areas than in low density areas. Wards and EDs with the highest levels of unemployment had a 10% higher risk of male bladder cancer than those with the lowest levels. There was no association between male bladder cancer and area-based education level. There was a trend of increasing risk with higher proportions of elderly living alone. Areas with the highest levels of elderly living alone had a 19% elevated risk of bladder cancer among men, compared to areas with the lowest levels. |
Figure 11.4 Adjusted relative risks (with 95% confidence intervals) of bladdercancer by socio-economic characteristics of geographic area of residence: females
| FemalesBladder cancer risk was also lower in women in NI compared to RoI (RR=0.86, 95%CI=0.79-0.93) (Figure 11.4). Adjusting for population density and socio-economic factors increased this difference (RR=0.79, 95%CI=0.72-0.87). The association between bladder cancer and population density was similar to that for men, with a 31% higher risk in high density, compared to low density, areas. As for men, there was no association between female bladder cancer and area-based education level. There was also no association with unemployment. Areas with the greatest proportion of elderly living alone had an 18% higher risk than those with the lowest proportion. |
The geographical pattern of bladder cancer for both sexes was mainly determined by the pattern for men, due to their higher incidence rate (Map 11.1).
For men (Map 11.2), there were several areas of high relative risk, including the east coast from Louth to Wexford (including Dublin City), Donegal, and more scattered areas including parts of Kerry, Cork, North Down, Ards and north and east Belfast.
For women the geographical variation was less distinct (Map 11.3). As for men, there was an area of higher relative risk along the east coast, but there was a second area of increased risk which included most of Munster—a much larger area than for men. Donegal and parts of Belfast showed slightly increased levels of relative risk.
Map 11.1 Bladder cancer, smoothed relative risks: both sexes
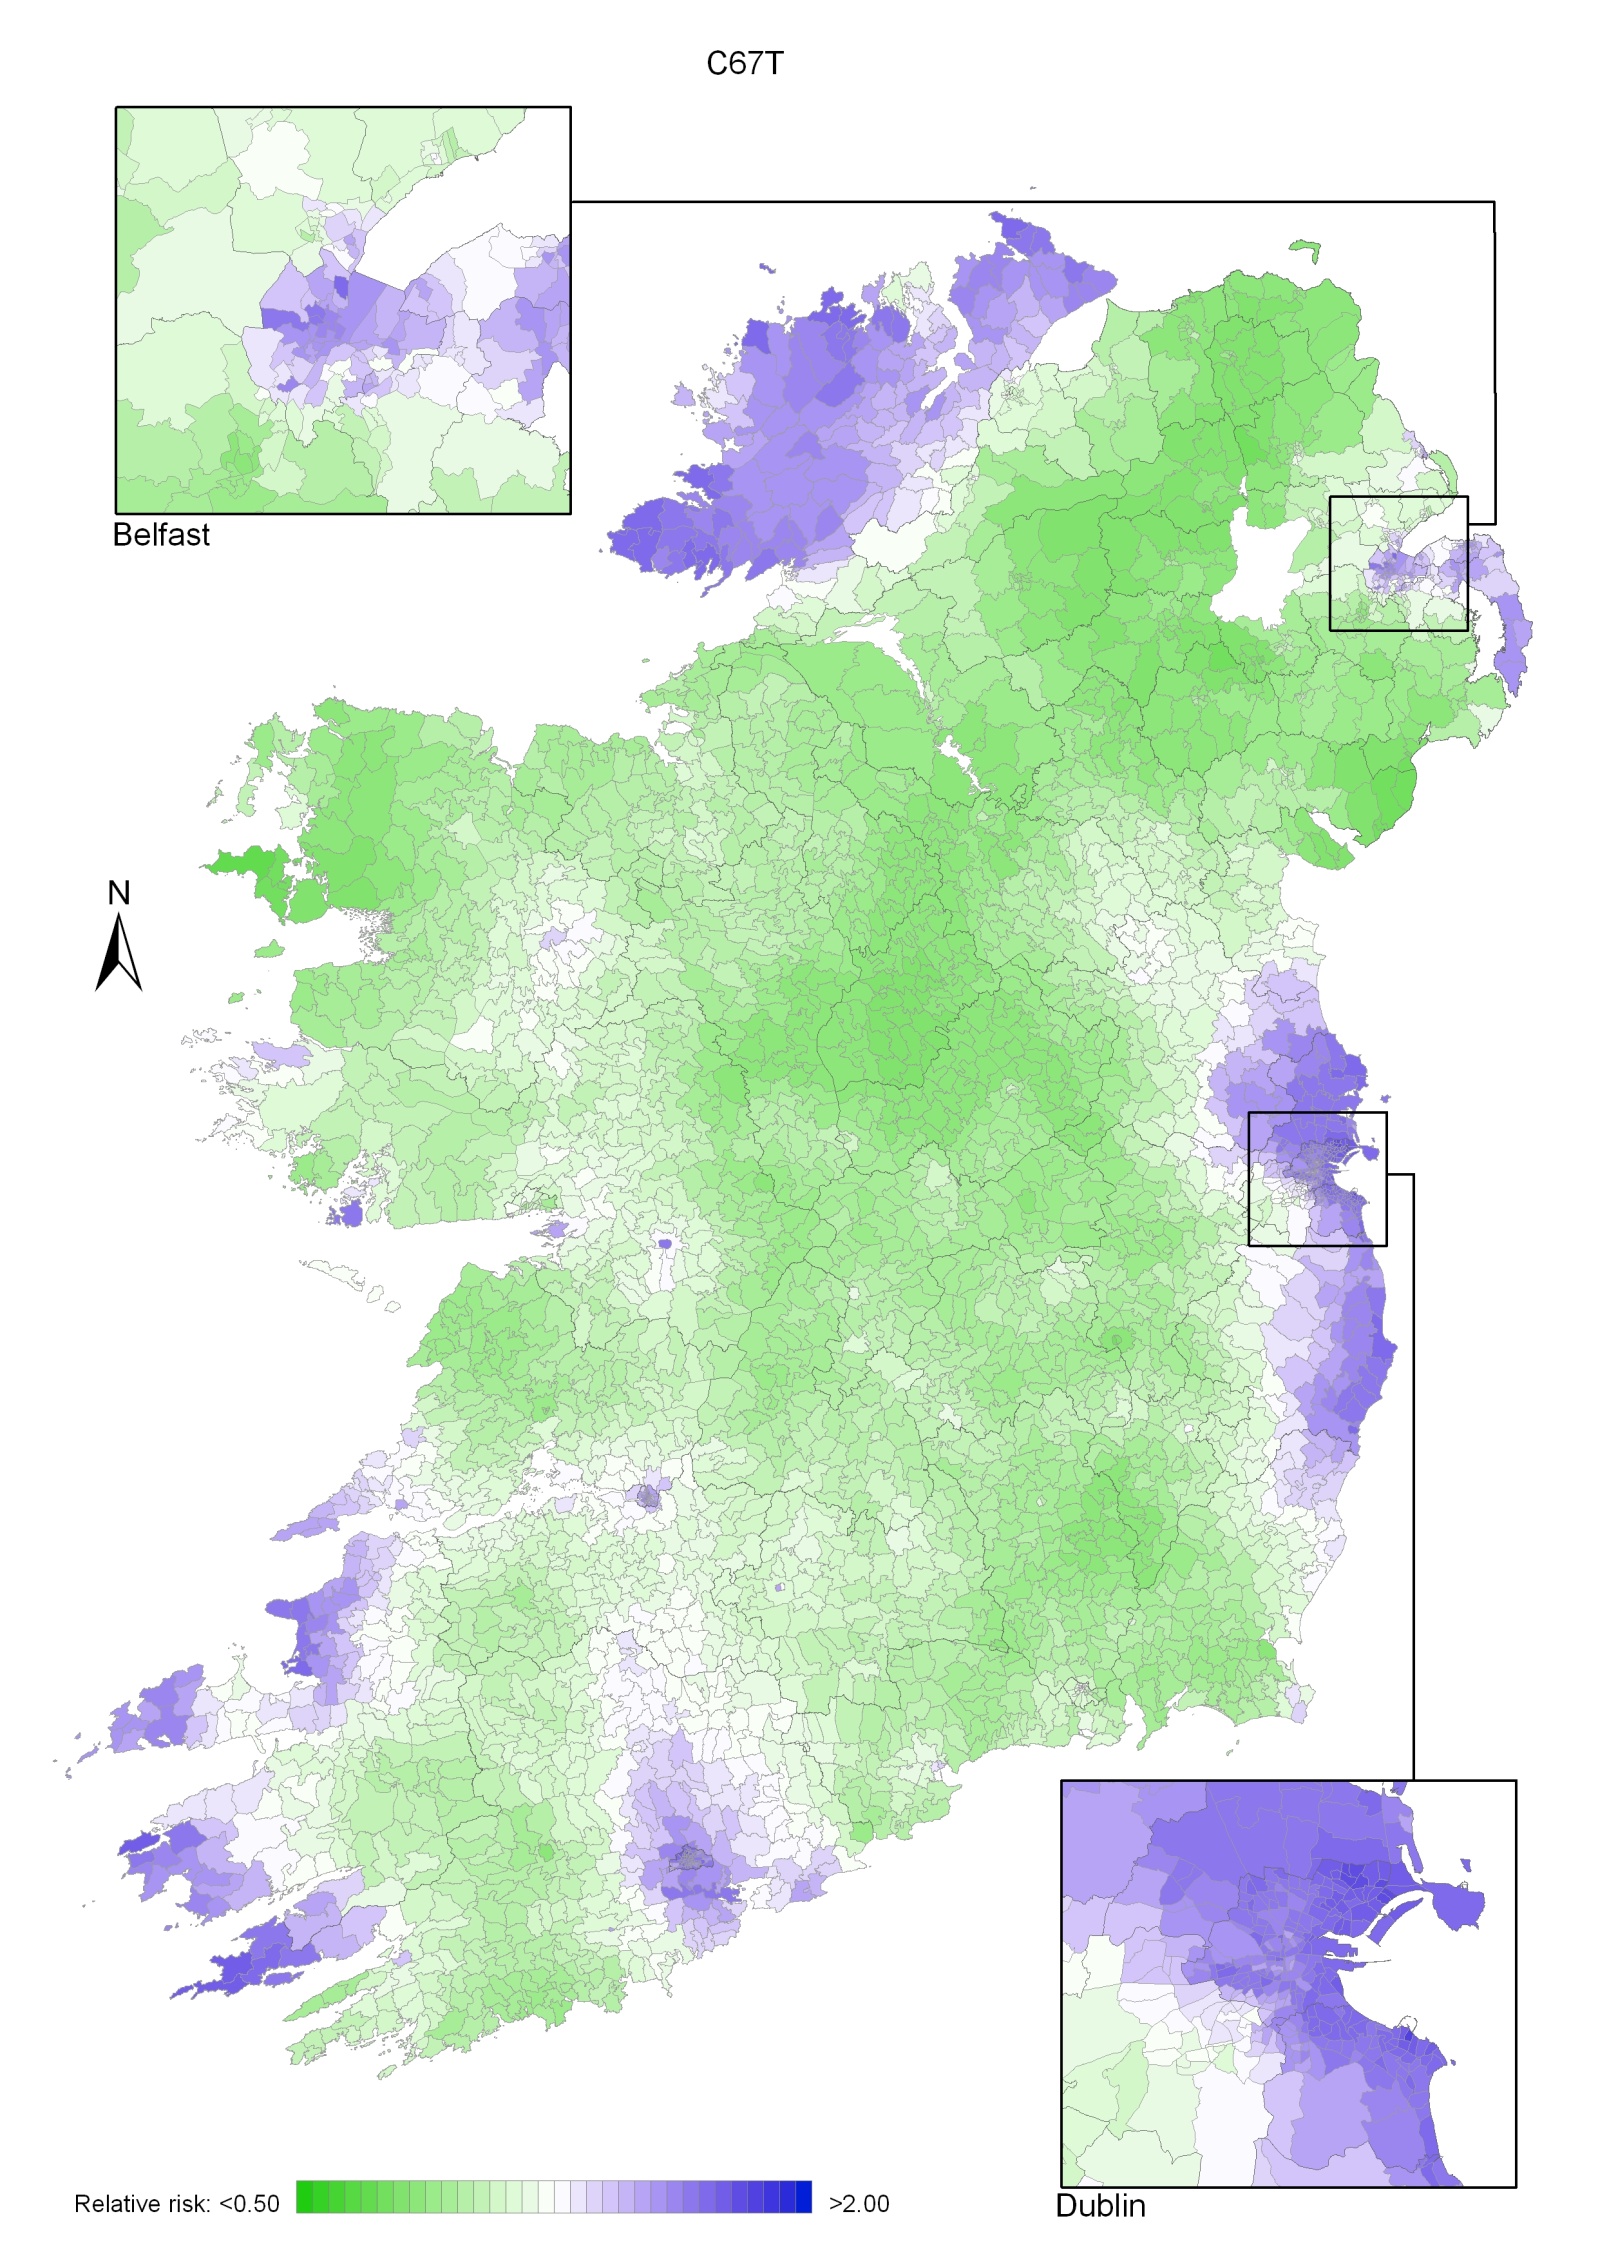
Map 11.2 Bladder cancer, smoothed relative risks: males
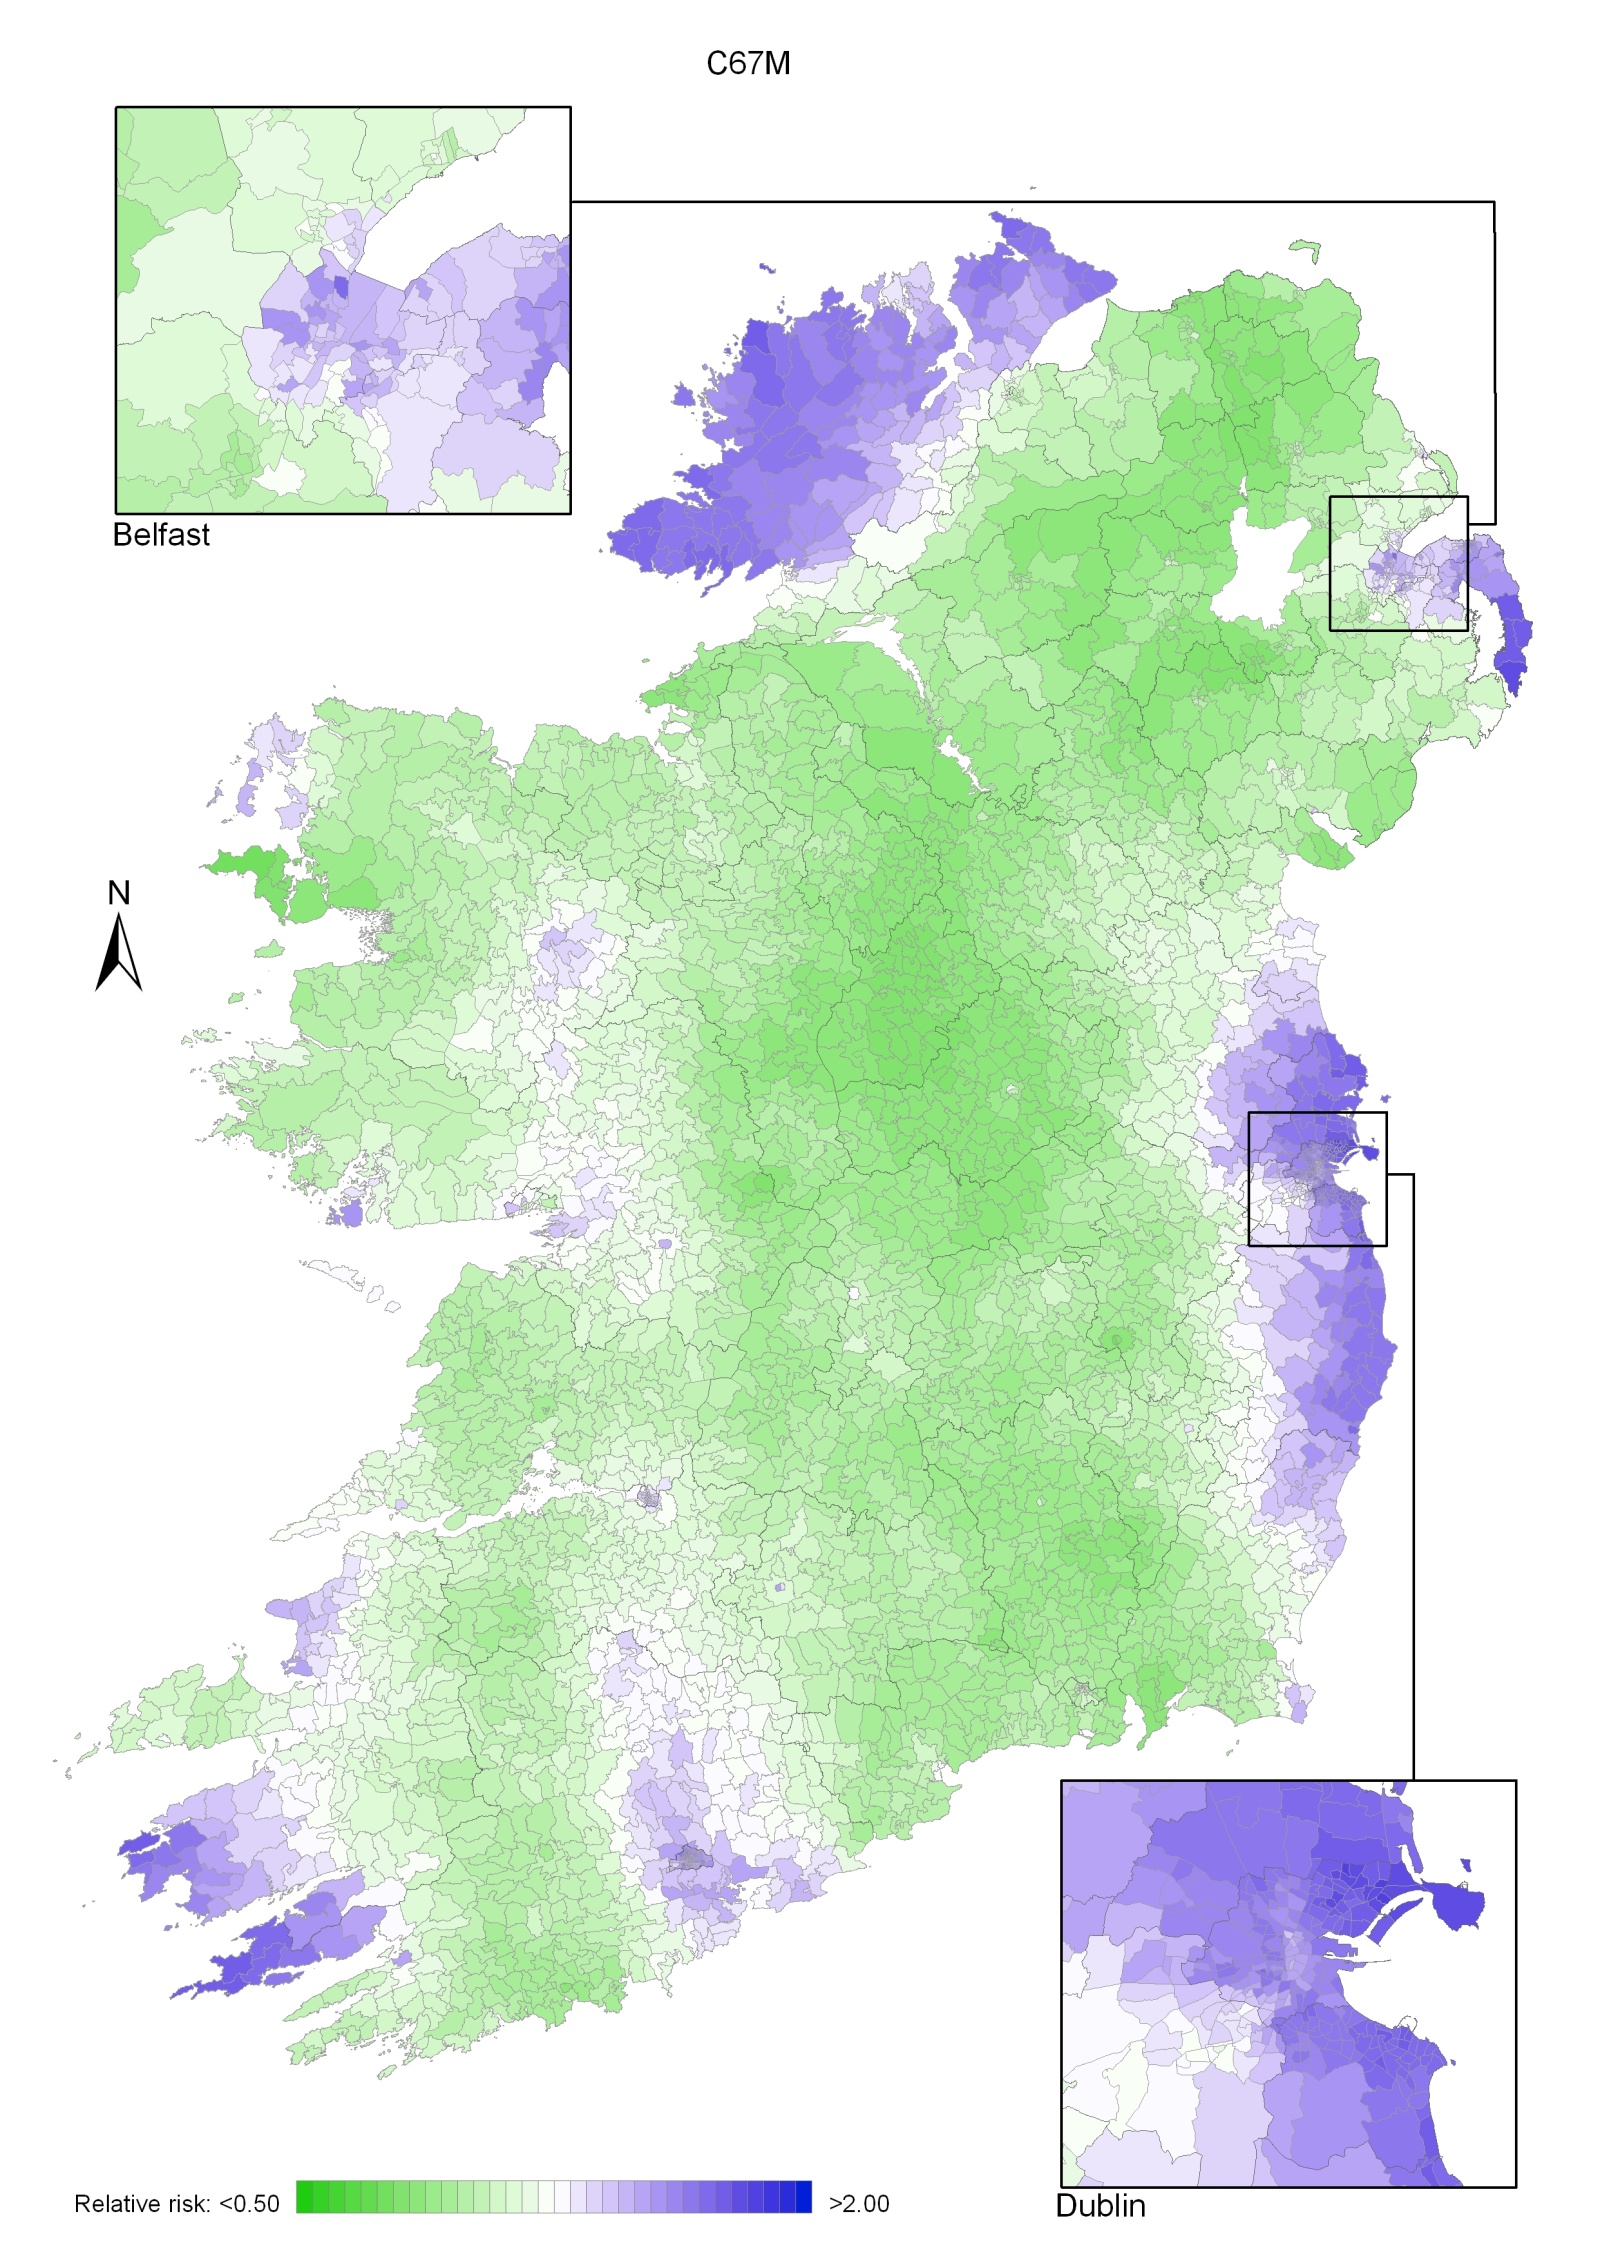
Map 11.3 Bladder cancer, smoothed relative risks: females
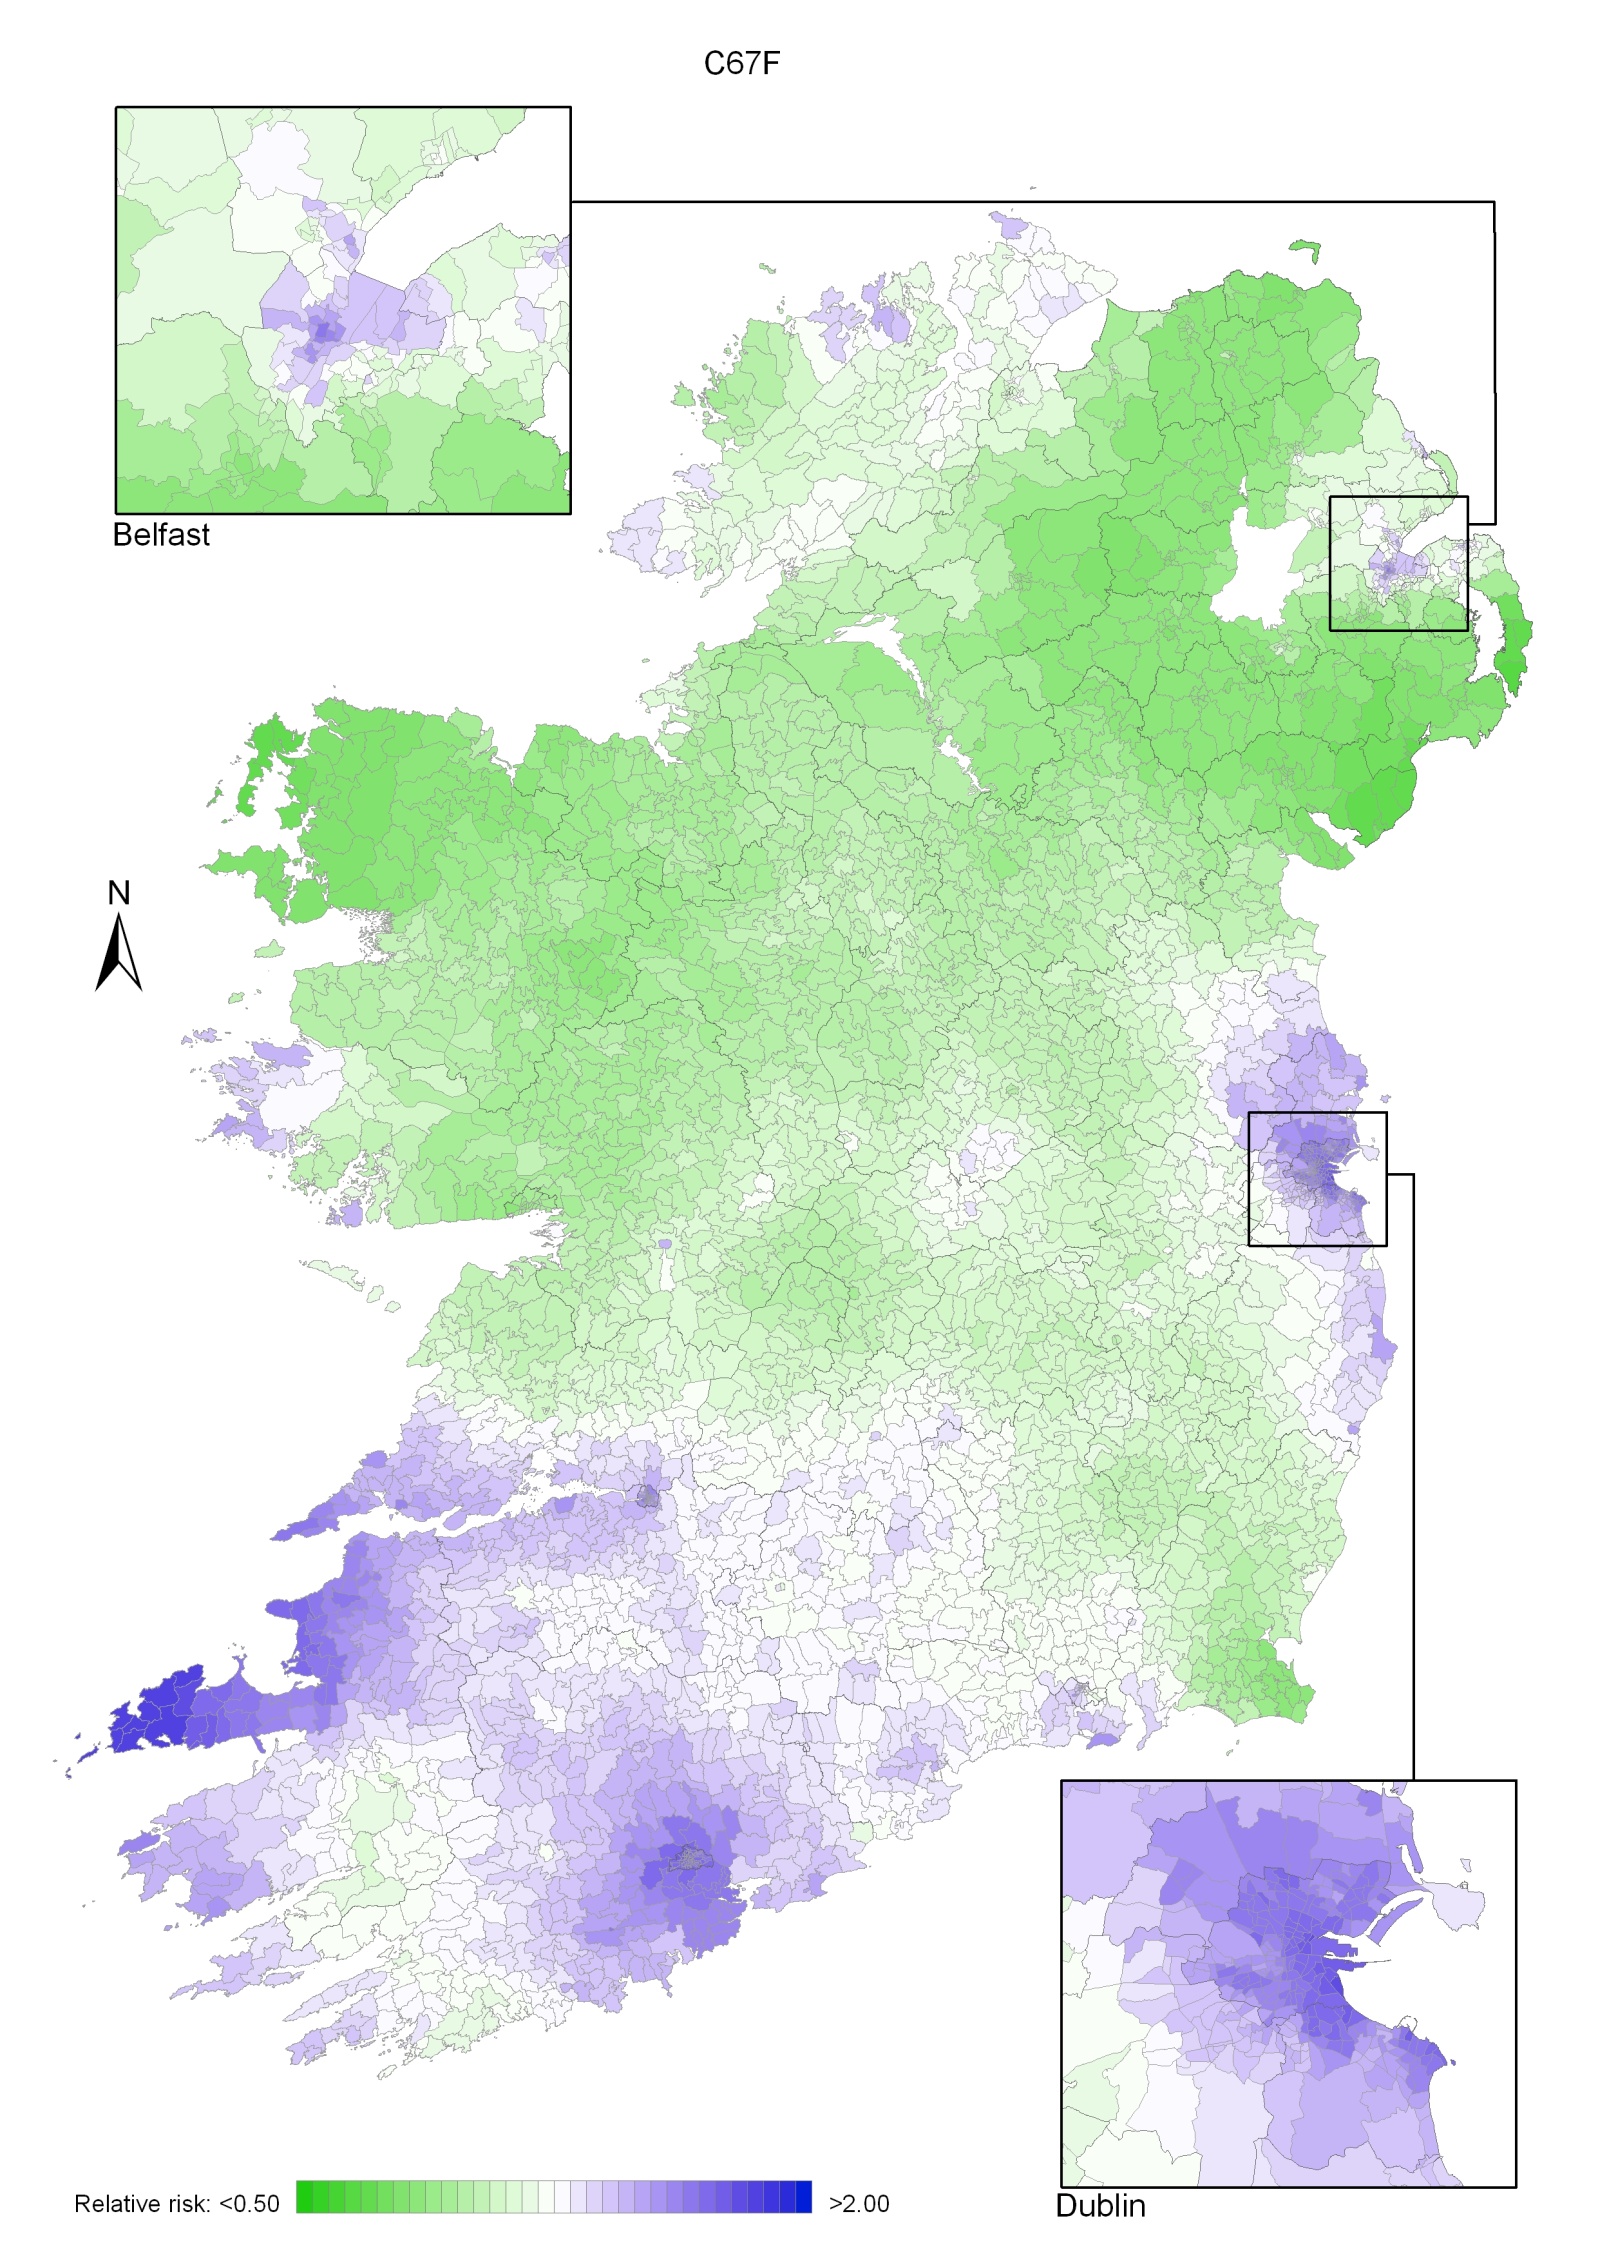
The category of head and neck cancer incorporates cancers at 17 separate sites in the mouth, pharynx, larynx, middle ear and nasal sinuses (see Table 2.1). Head and neck cancer was the ninth most common cancer in Ireland, accounting for 1.6% of all malignant neoplasms, excluding non-melanoma skin cancer, in women and 4.0% in men (Table 12.1). The average number of new cases diagnosed each year was 170 in women and 438 in men. During 1995-2007, the number of new cases diagnosed increased by approximately 1% per annum.
The risk of developing head and neck cancer up to the age of 74 was 1 in 209 for women and 1 in 67 for men and was slightly higher in NI than in RoI for women. At the end of 2008, 568 women and 1,293 men aged under 65, and 600 women and 1,462 men aged 65 and over, were alive up to 15 years after their head and neck cancer diagnosis.
Table 12.1 Summary information for head and neck cancer in Ireland, 1995-2007
Ireland | RoI | NI | ||||
females | males | females | males | females | males | |
% of all new cancer cases | 1.2% | 2.9% | 1.1% | 2.7% | 1.4% | 3.2% |
% of all new cancer cases excluding non-melanoma skin cancer | 1.6% | 4.0% | 1.5% | 3.9% | 1.9% | 4.3% |
average number of new cases per year | 170 | 438 | 105 | 294 | 65 | 144 |
cumulative risk to age 74 | 0.5% | 1.5% | 0.4% | 1.5% | 0.6% | 1.5% |
15-year prevalence (1994-2008) | 1168 | 2755 | 724 | 1765 | 444 | 990 |
The age distribution for head and neck cancer showed that men tended to be diagnosed at an earlier age than women—68% of men were aged under 70 years, compared to 58% of women (Figure 12.1). Almost twice the percentage of women presented at 80 years and over compared to men (18% .v. 10%). The pattern of age at diagnosis was similar in RoI and in NI.
Figure 12.1 Age distribution of head and neck cancer cases in Ireland, 1995-2007, by sex
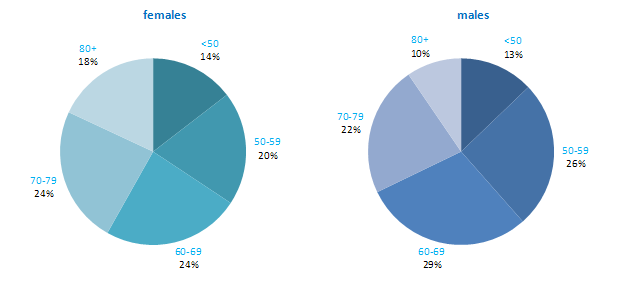
The incidence of head and neck cancer in women was low, with age-standardised rates ranging from 2.1 per 100,000 (in Japan) to 6.3 per 100,000 (in Demark) (Figure 12.2). Variation in rates was greater for men, with rates highest in Spain and Portugal, and lowest in Japan and New Zealand. Rates in RoI and NI were close to the median of the countries examined for men; NI ranked fifth highest of the 21 countries for women.
Figure 12.2 Estimated incidence rate per 100,000 in 2008 for selected developed countries compared to 2005-2007 incidence rate for RoI and NI: head and neck cancer | |
| females | males |
 | 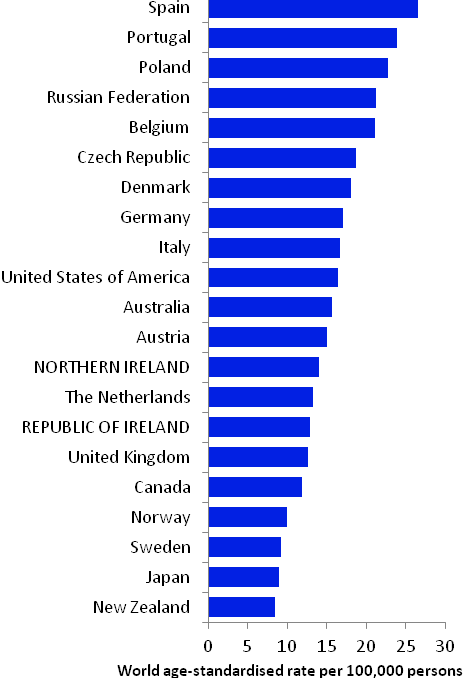 |
Source: GLOBOCAN 2008 (Ferlay et al., 2008) (excluding RoI and NI data, which is derived from Cancer Registry data for 2005-2007) NOTE: Head and neck cancer was defined in GLOBOCAN 2008 by ICD10 codes C00-C14 and C32 but in this atlas we have used codes C01-C14 and C30-C32 (see Table 2.1). The incidence rates shown for NI and RoI in Figure 12.2 use the GLOBOCAN definition, and are consequently slightly inconsistent with data in the rest of this chapter. | |
Table 12.2 Risk factors for head and neck cancer, by direction of association and strength of evidence
Increases risk | Decreases risk | |
Convincing or probable | Tobacco smoking1 | |
| Smokeless tobacco1 | |
| Involuntary (passive) smoking1,2 | |
| Alcohol1 | |
| Infection with human papilloma viruses (HPV)3 | |
| Low socio-economic status4 | |
| Family history5 | |
Possible | Body leanness/being underweight6,7 | Fruit8 |
Non-starchy vegetables8 | ||
Foods containing carotenoids8,9 | ||
Coffee10 | ||
1 Secretan et al., 2009; 2 Lee et al., 2008; 3 International Agency for Research on Cancer, 2011b; 4 Faggiano et al., 1997; 5 Negri et al., 2009; 6 Gaudet et al., 2010; 7 Lubin et al., 2011; 8 World Cancer Research Fund / American Institute for Cancer Research, 2007; 9 carotenoids are found in vegetables, particularly those which are red or orange; 10 Turati et al., 2011 | ||
More than 70% of head and neck cancers are considered to be due to tobacco and alcohol (Table 12.2; Hashibe et al., 2009). Tobacco smoking, and use of smokeless tobacco products, such as chewing tobacco or snuff, are causally related to cancer at many of the specific sites within this group. Risk increases with duration of smoking and number of cigarettes smoked, and falls with increasing time since quitting. Risk, particularly of laryngeal and pharyngeal cancers, is probably also increased in those who have never smoked themselves, but have a long duration of involuntary smoking (passive smoking) exposure at home or work. A causal relationship with alcohol intake is also clearly established. Compared to non- or occasional drinkers, light drinkers have a modest increased risk of oral and pharyngeal cancers, while the risk in heavy drinkers is increased by 5-fold for oral cancers and 7-fold for pharyngeal cancers (Turati et al., 2010).
Overall, individuals with one or more first-degree relatives affected with head and neck cancer have a modest raised risk of developing the disease themselves, although the combination of a positive family history and use of alcohol and tobacco confers a much higher risk. Risk of most head and neck cancers is higher in those of lower socio-economic status, probably reflecting social class variations in exposure to tobacco and, perhaps also, alcohol.
Evidence of infection with human papilloma viruses (HPV) has been found in the oral cavity and larynx. Moreover, sexual behaviours that have previously been associated with HPV infection, such as earlier age at sexual debut and more sexual partners, have also been associated with increased risk of head and neck cancer (Heck et al., 2010). Consequently, the International Agency for Research on Cancer has concluded that various strains of HPV are causally implicated in some head and neck cancers. Notably, HPV16 is considered a causal agent for cancers of the oral cavity, oropharynx and tonsil, and is likely to also be involved in the aetiology of laryngeal cancer. However, the natural history of oral HPV infection remains unclear.
Systematic reviews suggest that higher intake of fruit and vegetables (non-starchy or carotenoid-rich) may be associated with decreased risk of head and neck cancer. Similarly, risk of cancers of the oral cavity and pharynx, but not the larynx, may be lower in those who consume more coffee. Body leanness and being underweight have been associated with increased risk of head and neck cancer, and overweight and obesity with reduced risk, but the possibility of reverse causality cannot be excluded.
Figure 12.3 Adjusted relative risks (with 95% confidence intervals) of head and neck cancer by socio-economic characteristics of geographic area of residence: males | MalesThe risk of head and neck cancer among men was slightly higher in NI (Figure 12.3). However, after adjustments for population density and socio-economic factors, the risk was lower in NI than RoI (RR=0.90, 95%CI=0.84-0.97). The risk of male head and neck cancer increased considerably with increasing population density. Men resident in areas with 1-15 p/ha had a 20% greater risk than men resident in the least densely populated areas, while men resident in the most densely populated areas had a 53% greater risk. Similarly, the risk of head and neck cancer increased with increasing unemployment in the area of residence. In particular, men resident in the areas of highest unemployment had a 42% greater risk of head and neck cancer than those in the areas of lowest unemployment. However, lower educational attainment was not associated with head and neck cancer among men. Areas with the highest proportion of elderly living alone had a 15% elevated risk of male head and neck cancer compared to areas with the lowest proportion. |
Figure 12.4 Adjusted relative risks (with 95% confidence intervals) of head and neck cancer by socio-economic characteristics of geographic area of residence: females
| FemalesThe age-adjusted risk of head and neck cancer for women in NI was 21% higher than in RoI (Figure 12.4). After adjustments for population density and socio-economic factors the risk in NI was still greater than in RoI but to a slightly lesser degree (RR=1.13, 95%CI=1.03-1.26). The association between female head and neck cancer and population density was weaker than that for men. Compared to the least densely populated areas head and neck cancer risk was 29% greater in the most densely populated areas. As with men, there was a positive association between head and neck cancer risk among women and unemployment. Women resident in the areas of highest unemployment had a 49% greater risk of head and neck cancer than those in the areas of least unemployment. There was no association between female head and neck cancer and education or the proportion of elderly living alone in an area. |
Due to the much higher incidence of head and neck cancer in men, the geographical pattern for both sexes (Map 12.1) was similar to that for men only.
Areas of high relative risk for men were scattered throughout the country—along the western seaboard, around Cork, Kerry, Tipperary South, Clare, Limerick, Dublin city and north Dublin, Belfast, Moyle, Larne, Cookstown, Derry, Newry and Mourne, Longford, Galway and Mayo (Map 12.2).
There was a quite different pattern of geographical variation for women with one large area of higher relative risk from north Leitrim/south Donegal to the east coast of NI, and covering most of the southern half of NI and the border counties in RoI. Other areas of higher risk were in Dublin city, north Dublin, the Inishowen peninsula in Donegal, the Dingle peninsula in Kerry and along the northern coast of NI from Derry to Moyle (Map 12.3).
Map 12.1 Head and neck cancer, smoothed relative risks: both sexes
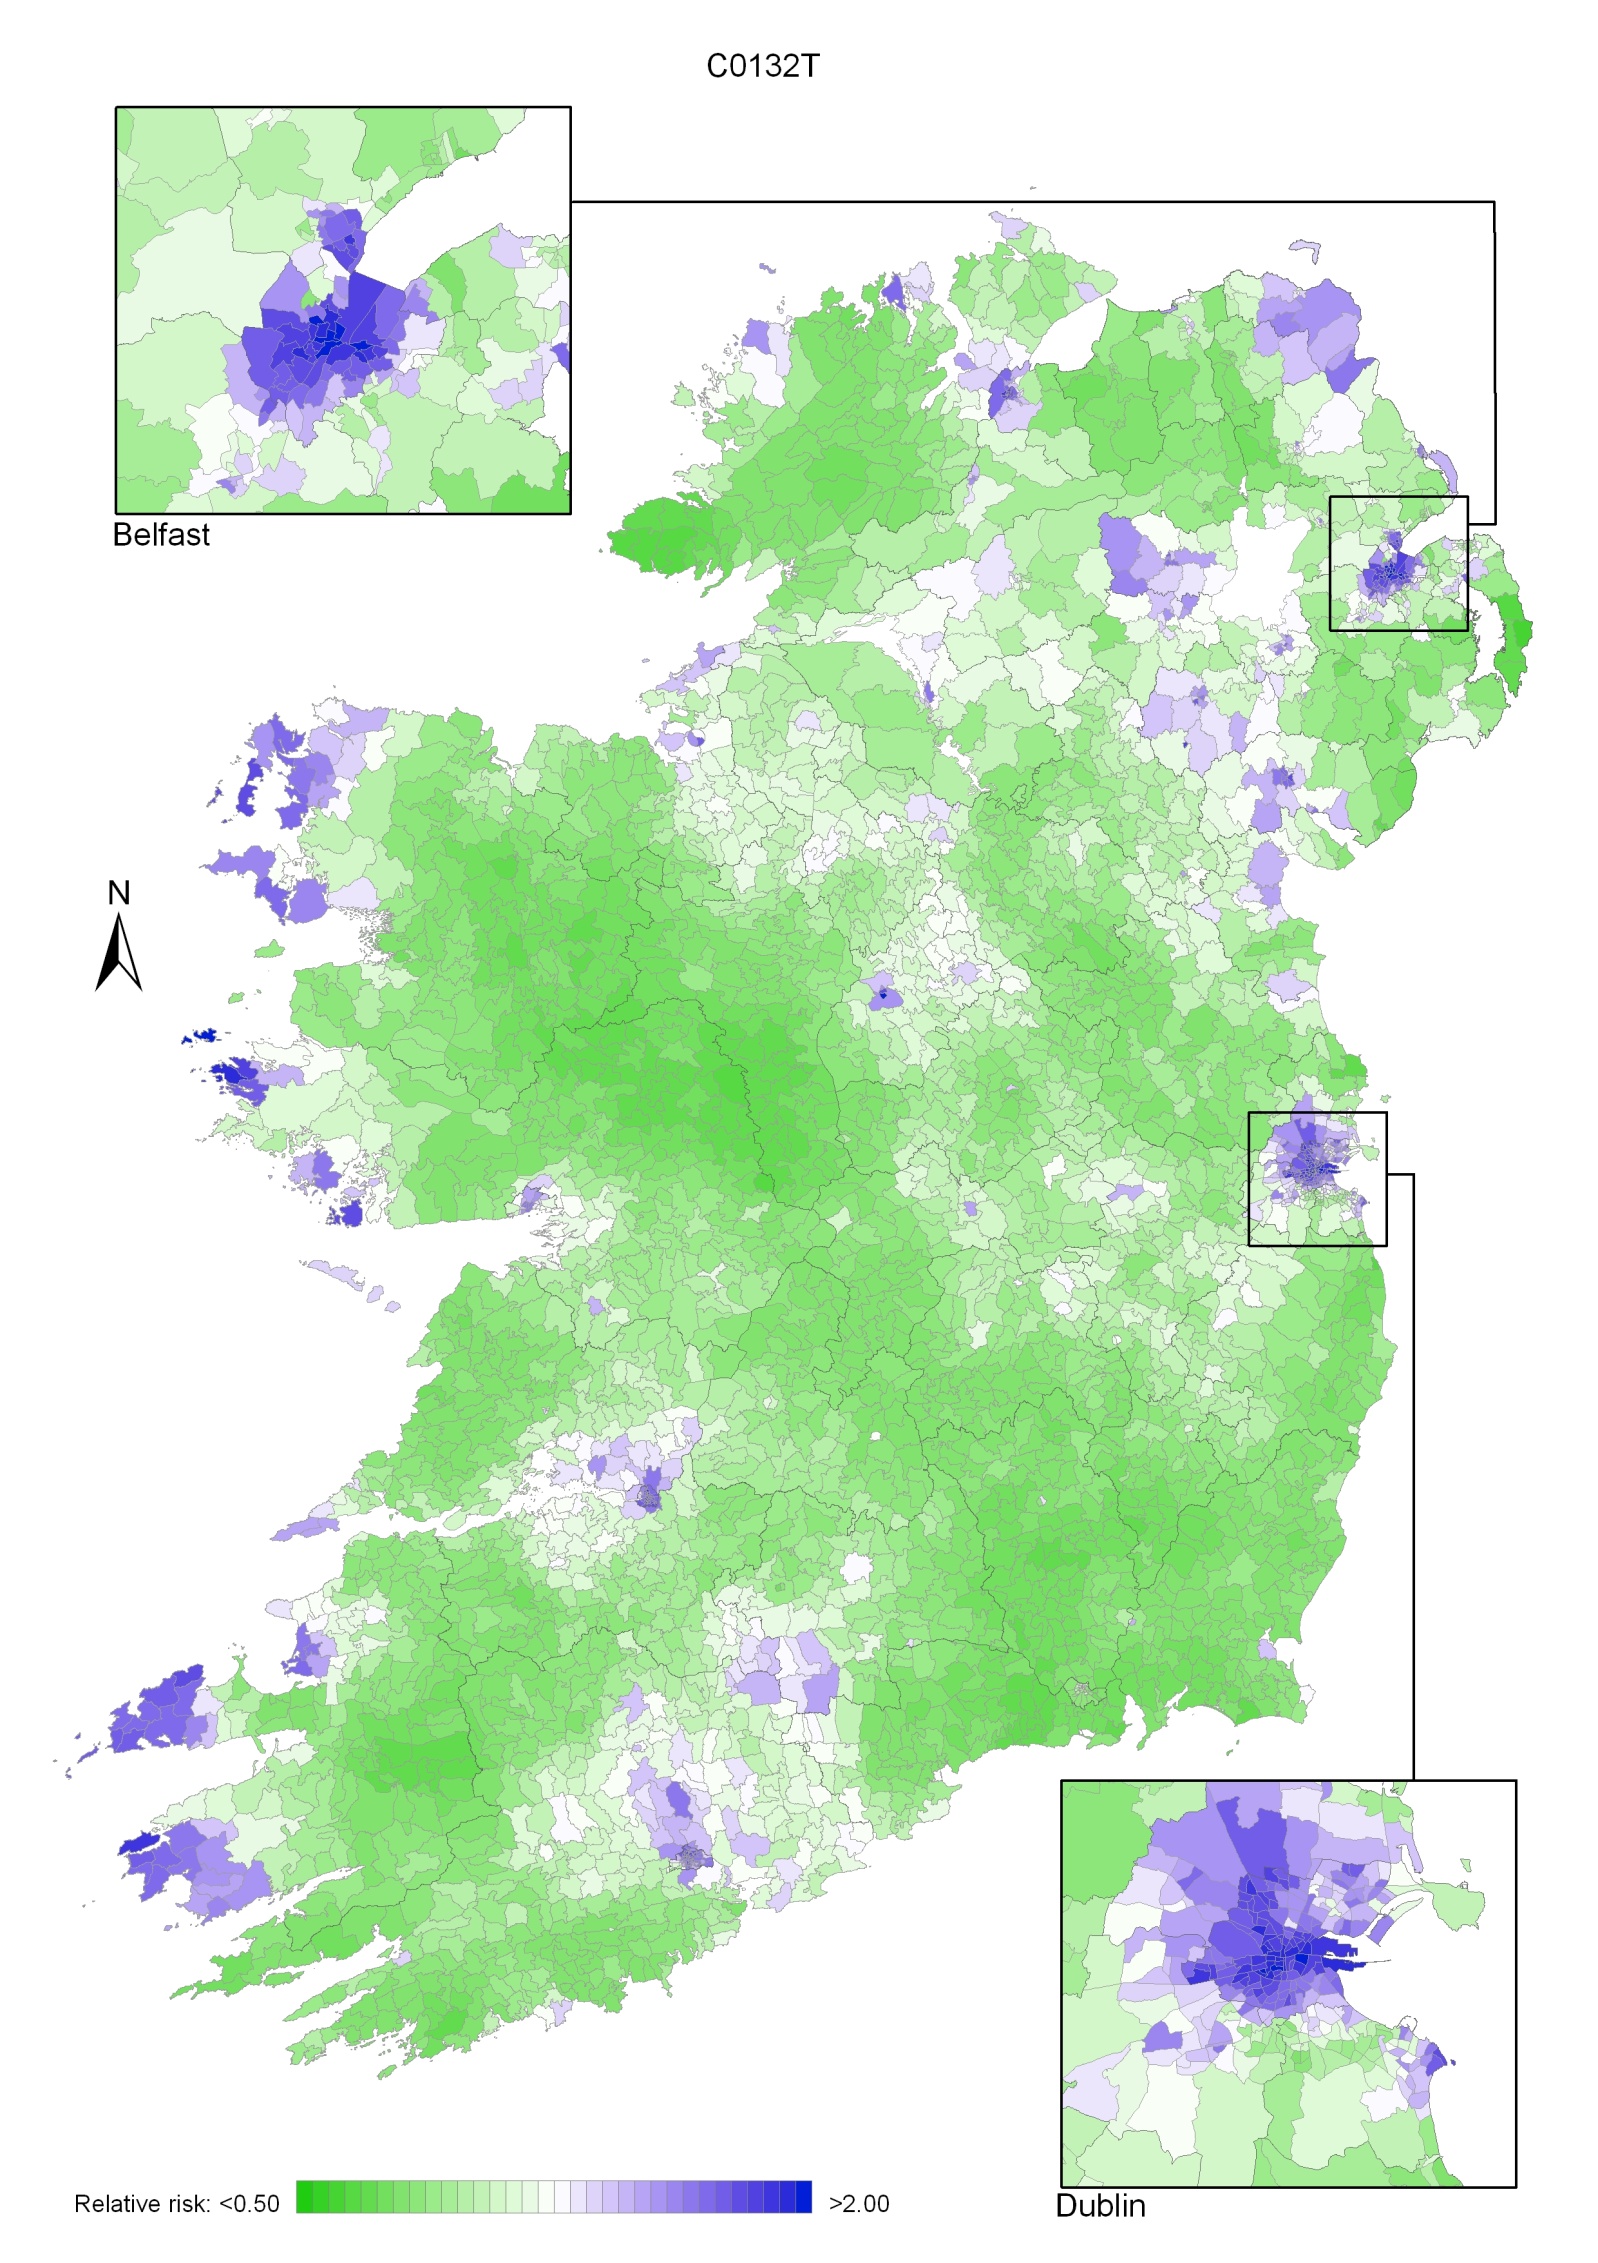
Map 12.2 Head and neck cancer, smoothed relative risks: males
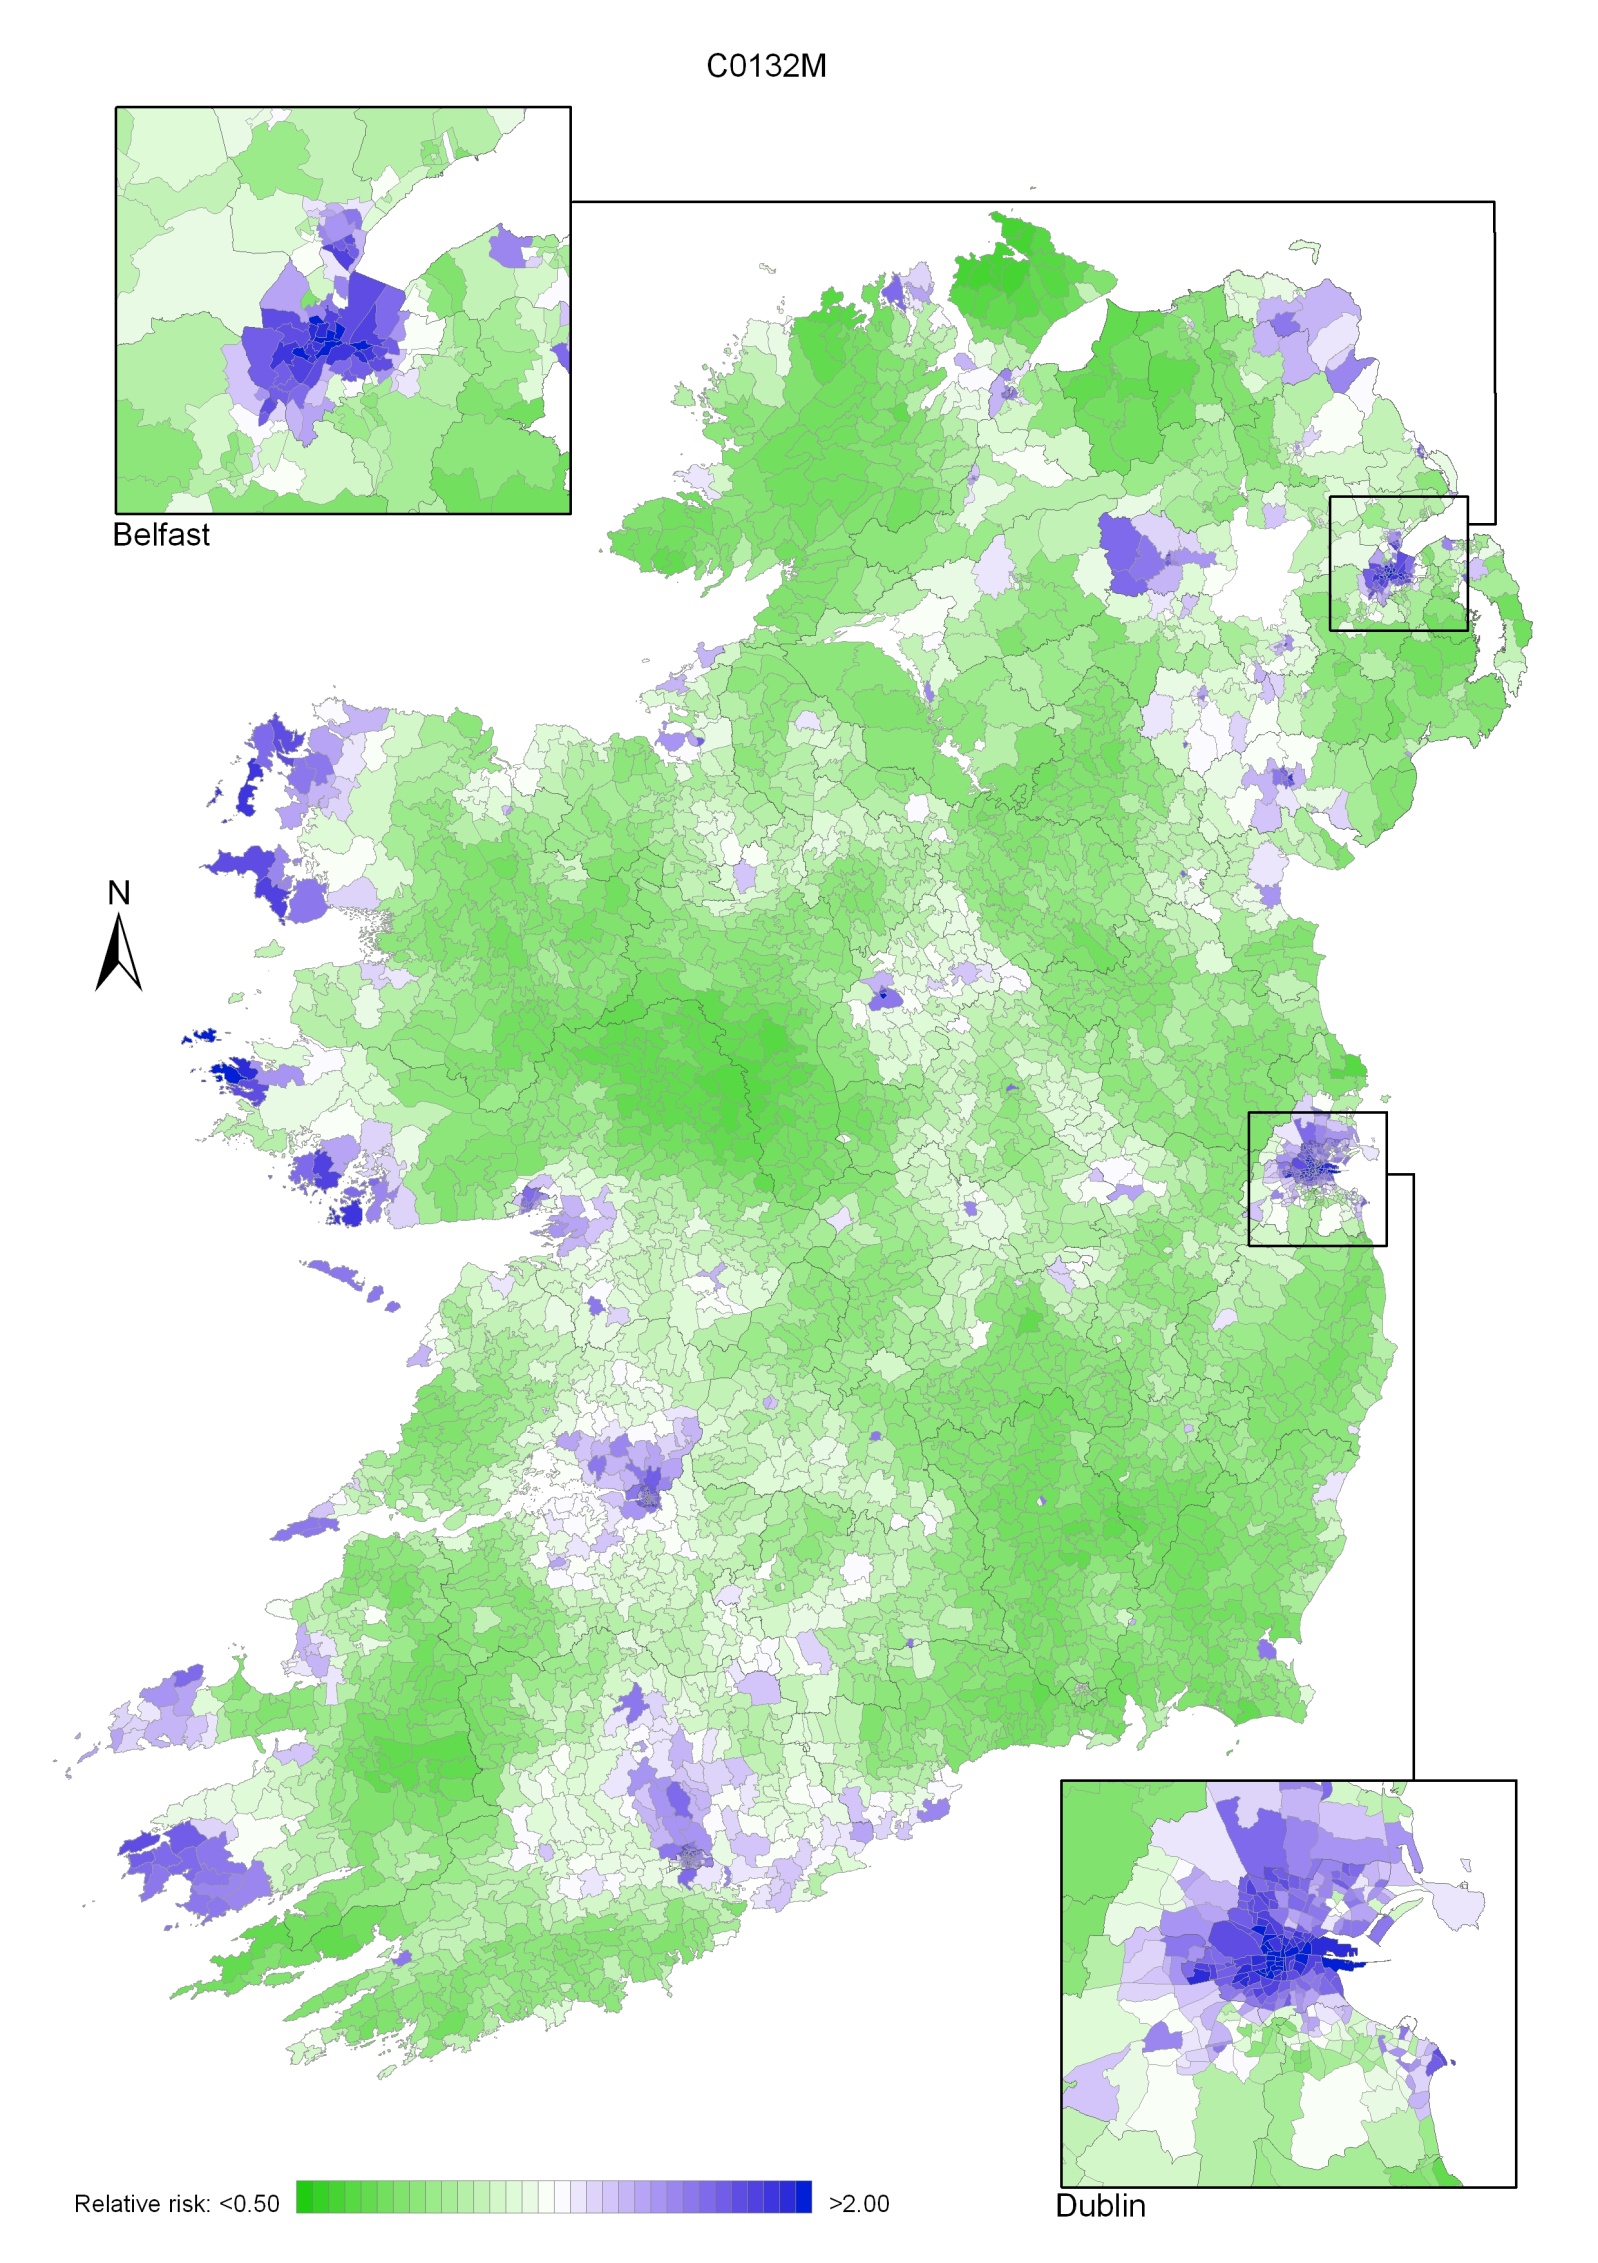
Map 12.3 Head and neck cancer, smoothed relative risks: females
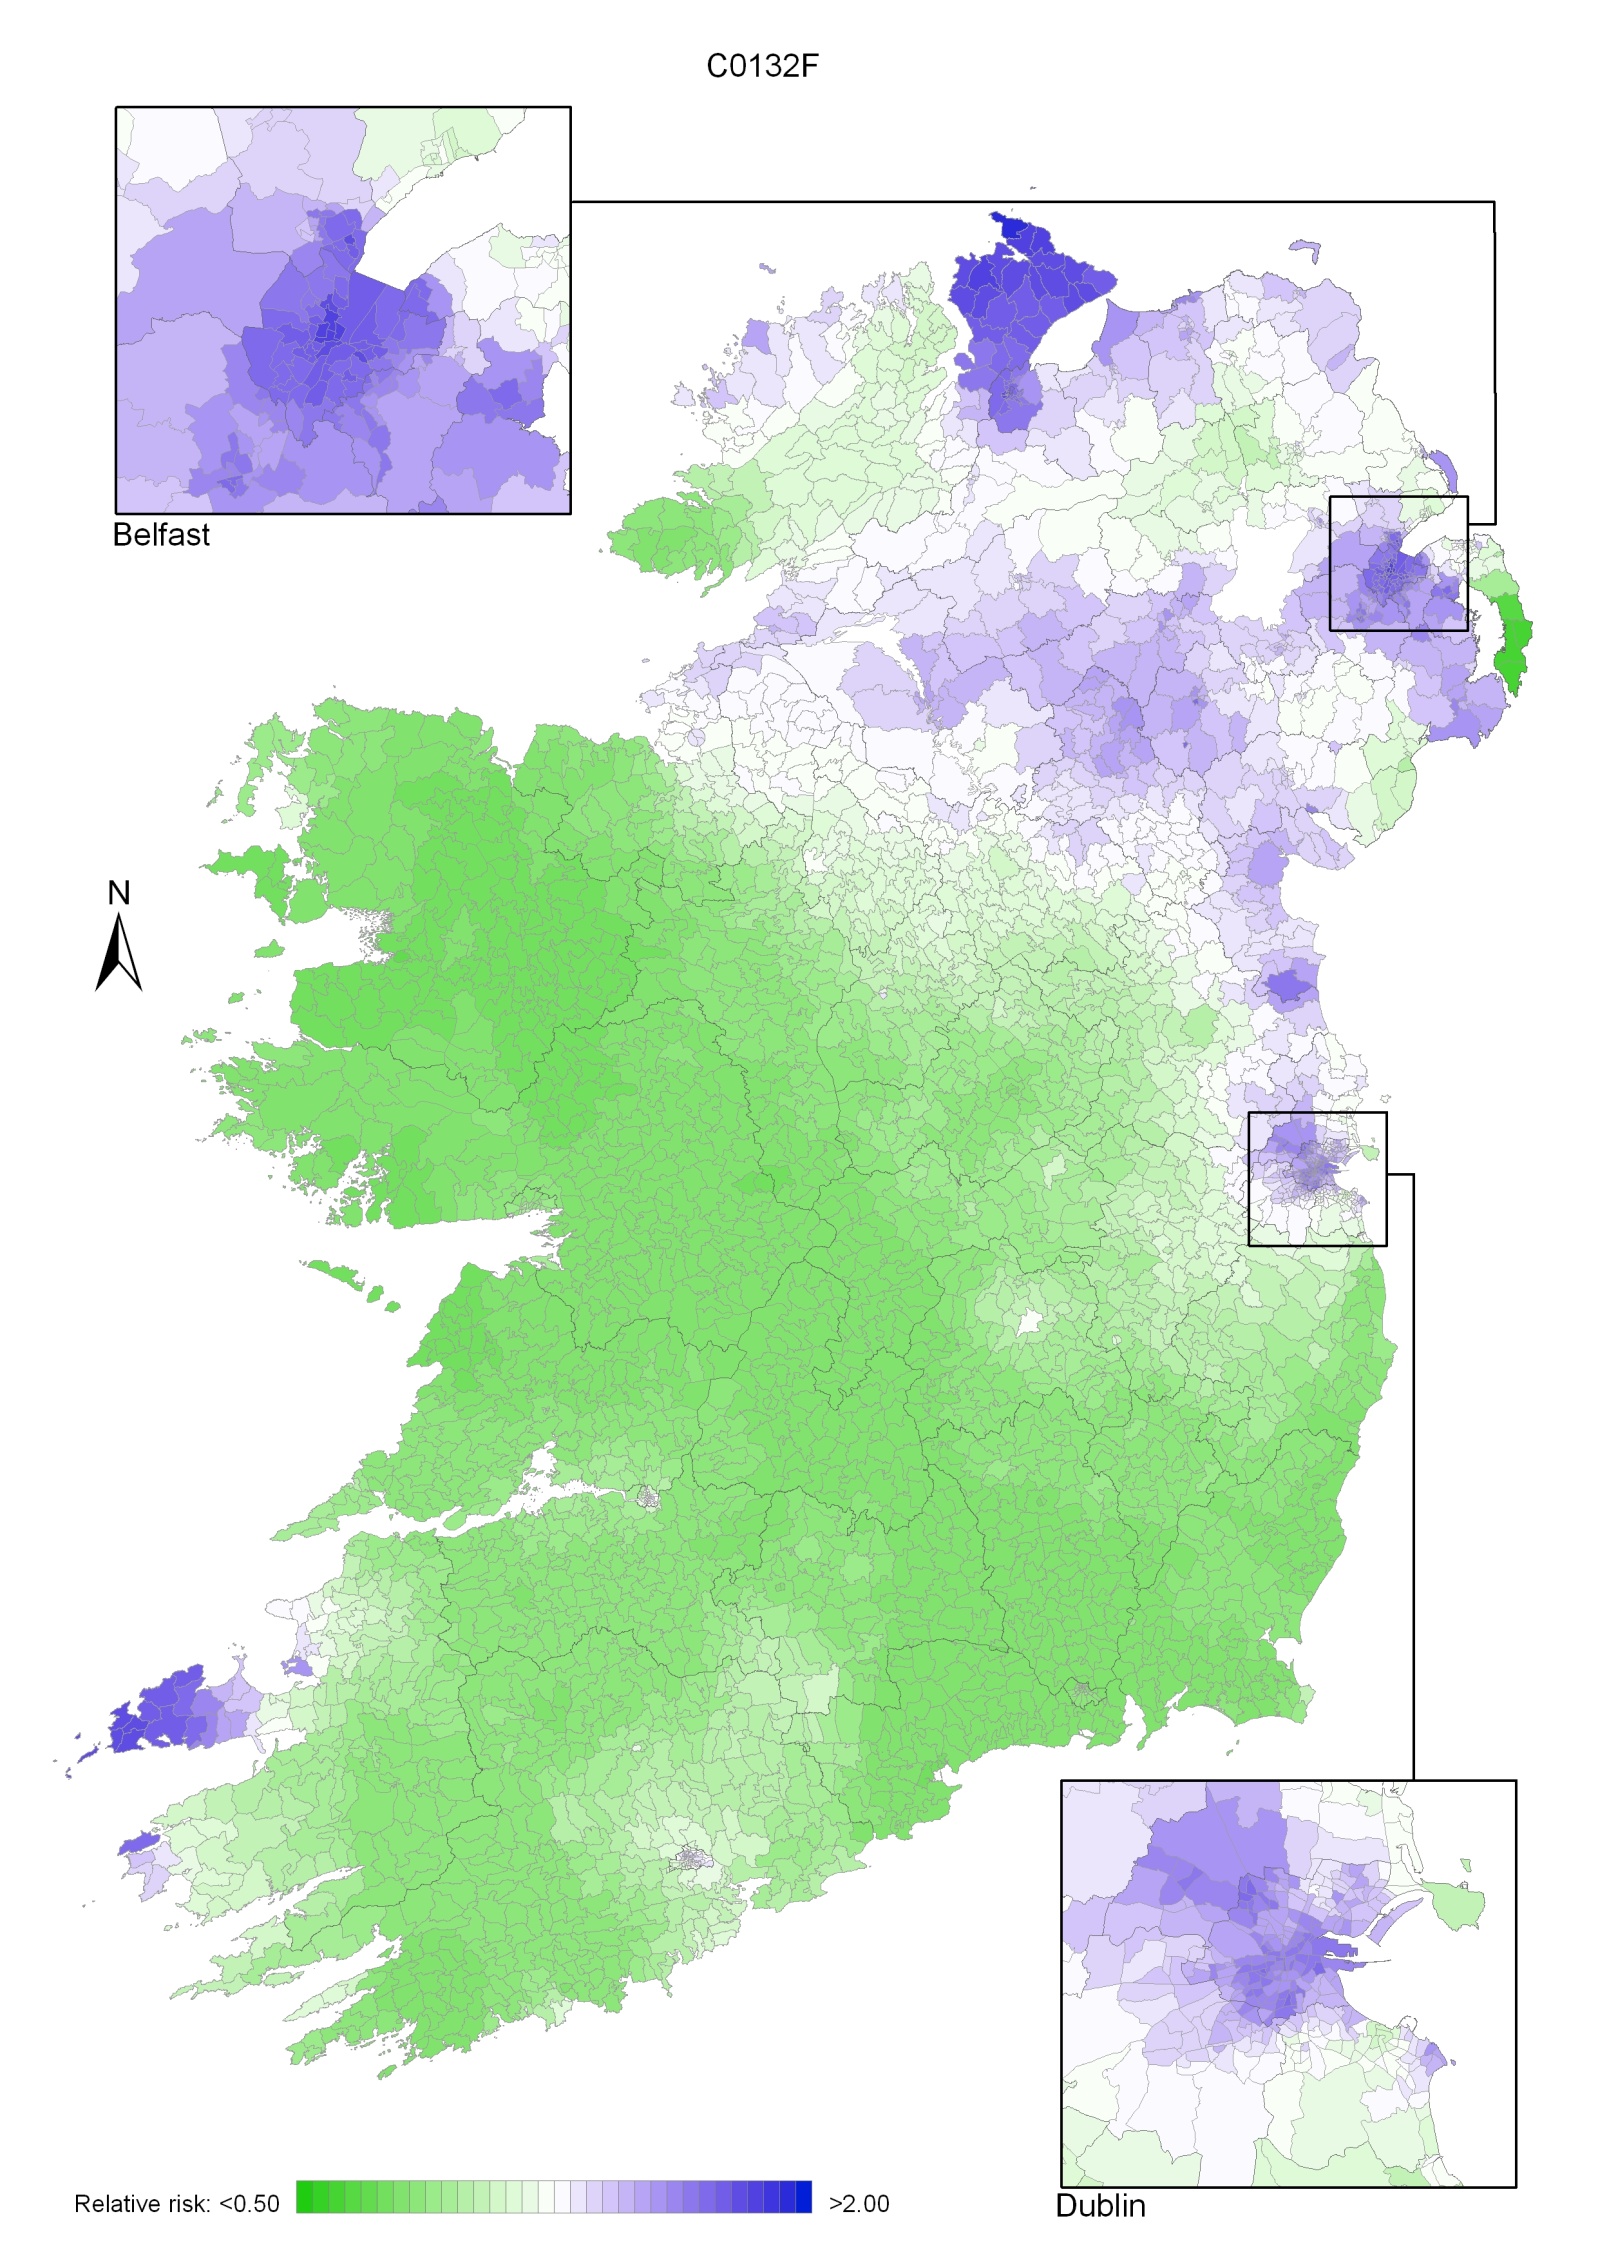
Leukaemia describes a number of diseases of differing aetiology and clinical course. The four main subtypes are chronic lymphocytic leukaemia (CLL), chronic myeloid leukaemia (CML), acute lymphocytic leukaemia (ALL) and acute myeloid leukaemia (AML). The commonest of these (about 40% of all cases) is CLL (National Cancer Registry, 2010a). All leukaemias combined formed the tenth most common cancer in Ireland, accounting for 2.4% of all malignant neoplasms, excluding non-melanoma skin cancer, in women and 3.2% in men (Table 13.1). The average number of new cases diagnosed each year was 243 in women and 348 in men. During 1995-2007, the number of new cases diagnosed showed a small overall increase of 1% per annum. However, the numbers decreased slightly in NI, while increasing at approximately 2% per annum in RoI.
The risk of developing leukaemia up to the age of 74 was 1 in 170 for women and 1 in 98 for men and was higher in RoI than in NI. At the end of 2008, 847 women and 1,196 men aged under 65, and 663 women and 924 men aged 65 and over, were alive up to 15 years after their leukaemia diagnosis.
Table 13.1 Summary information for leukaemia in Ireland, 1995-2007
Ireland | RoI | NI | ||||
females | males | females | males | females | males | |
% of all new cancer cases | 1.7% | 2.3% | 1.8% | 2.4% | 1.6% | 2.0% |
% of all new cancer cases excluding non-melanoma skin cancer | 2.4% | 3.2% | 2.5% | 3.4% | 2.1% | 2.8% |
average number of new cases per year | 243 | 348 | 172 | 256 | 71 | 92 |
cumulative risk to age 74 | 0.6% | 1.0% | 0.6% | 1.1% | 0.5% | 0.8% |
15-year prevalence (1994-2008) | 1510 | 2120 | 1115 | 1614 | 395 | 506 |
In contrast to most other cancers leukaemia was more common at the extremes of age—47% of women and 38% of men were aged either under 50 or over 79 years at diagnosis (Figure 13.1). Approximately one quarter of all new cases presented in the age group 70–79 years. The pattern of age at diagnosis was similar in RoI and in NI.
Figure 13.1 Age distribution of leukaemia cases in Ireland, 1995-2007, by sex
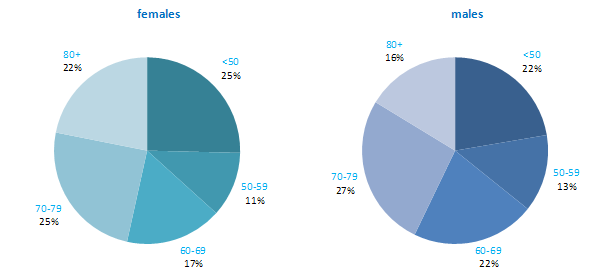
Leukaemia rates in RoI were relatively high compared with many other developed countries, while rates in NI were relatively low, especially for men (Figure 13.2). New Zealand, USA, Australia and Canada had the highest male rates, while Poland and Japan had the lowest. New Zealand and Italy had the highest female rates of the disease, while Poland and Japan also had the lowest female rates.
Figure 13.2 Estimated incidence rate per 100,000 in 2008 for selected developed countries compared to 2005-2007 incidence rate for RoI and NI: leukaemia | |
| females | males |
 | 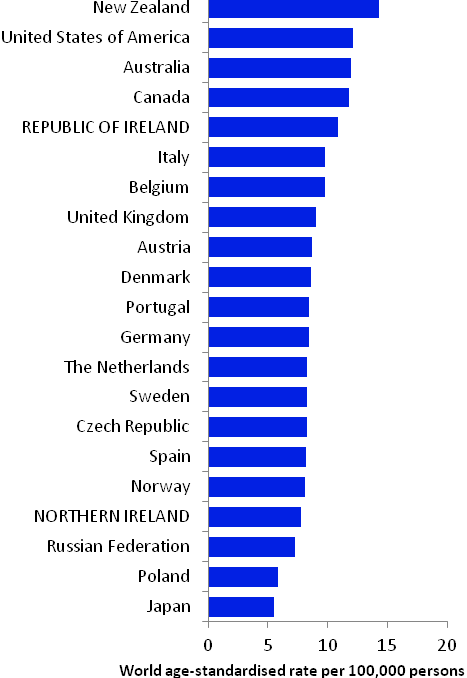 |
Source: GLOBOCAN 2008 (Ferlay et al., 2008) (excluding RoI and NI data, which is derived from Cancer Registry data for 2005-2007) | |
Table 13.2 Risk factors for leukaemia, by direction of association and strength of evidence
Increases risk | Decreases risk | |
Convincing or probable | Ionizing radiation1,2,3 | |
| Anti-neoplastic drugs4 | |
| Myelodysplastic syndromes5,6 | |
| Human T-cell lymphotrophic virus, type-1 (HTLV-1)7 | |
| Smoking8 | |
| Occupational exposure to formaldehyde, benzene or styrene9,10,11 | |
| Employment in the rubber manufacturing industry9 | |
| Family history of leukaemia12 | |
Possible | Employment in pesticide manufacturing13 | |
Overweight and obesity14,15 | ||
| ||
1 exposure to alpha-particle or beta-particle emitters, x-rays or gamma rays; 2 El Ghissassi et al., 2009; 3 Daniels and Schubauer-Berigan, 2011; 4 International Agency for Research on Cancer, 2011a; 5 conditions of the blood or bone marrow, where individuals have too few of one or more types of healthy blood cells; 6 Garcia-Manero, 2011; 7 International Agency for Research on Cancer, 2011b; 8 Secretan et al., 2009; 9 Baan et al., 2009; 10 Schwilk et al., 2010; 11 National Toxicology Program, 2011; 12 Brown, 2008; 13 Van Maele-Fabry et al., 2008; 14 Larsson and Wolk, 2008; 15 Lichtman, 2010 | ||
The chronic leukaemias (CLL, CML) almost never affect children; AML may affect adults and children; while ALL is the most common type of leukaemia in children, but may affect adults also. The description of risk factors below refers to leukaemia in adults.
Ionizing radiation exposure has long been established as a risk factor for leukaemia. Risk of all types of leukaemia other than CLL is increased in individuals who receive particular types of radiation therapy or undergo multiple x-rays, or have protracted exposure to low-dose gamma radiation. A variety of anti-neoplastic drugs (alkylating agents), given as part of the treatment for other types of cancer, can cause leukaemia, most usually AML. Risk is increased in individuals with myelodysplastic syndrome, a diverse collection of conditions related to the blood and bone marrow which, if left untreated, may progress to AML. Infection with the human T-cell lymphotrophic virus, type 1 (HTLV-1) causes a rare type of leukaemia known as adult T-cell leukaemia. Approximately 10% of individuals with CLL report a family history of the condition or a related lymphoproliferative disorder, but the genes which account for increased susceptibility have not been identified.
Occupational exposure to benzene (an industrial solvent and precursor to basic industrial chemicals including drugs, plastics, synthetic rubber, and dyes); formaldehyde (used in the production of industrial resins that are then used in the manufacture of products such as adhesives and binders for wood products, plastic and synthetic fibres); and styrene (used in the production of polymers, which are incorporated into products such as rubber, plastic, insulation, fibreglass, and car parts) are all linked with leukaemia. Formaldehyde is particularly associated with AML. Workers in the rubber manufacturing industry have increased risk, but due to the complexity of exposures in this industry, the causative agents have not yet been firmly identified. Risk of myeloid leukaemias may also be raised in individuals employed in plants manufacturing pesticides.
In terms of lifestyle-related risk factors, tobacco smoking is a causal agent for myeloid leukaemia. Overweight and obesity may modestly increase risk of all four main subtypes, but the evidence-base is sparse.
Figure 13.3 Adjusted relative risks (with 95% confidence intervals) of leukaemia by socio-economic characteristics of geographic area of residence: males | MalesLeukaemia risk among men was 23% lower in NI than RoI during 1995-2007 (Figure 13.3). Adjustments for different area-based characteristics in each country increased this difference slightly to 25%. There was no association between male leukaemia risk and population density, unemployment or education. Risk increased with an increasing proportion of elderly people in the area living alone. The difference in risk between areas with the least and greatest proportion of elderly people living alone was 17%. |
Figure 13.4 Adjusted relative risks (with 95% confidence intervals) of leukaemia by socio-economic characteristics of geographic area of residence: females
| FemalesLeukaemia risk for women was lower in NI than RoI, by 21% after adjustments for population density and socio-economic factors (Figure 13.4). As for men, there was no association between female leukaemia risk and population density, unemployment or education. The risk of female leukaemia was 14% greater in areas with the greatest proportion of elderly people living alone, compared to areas with the smallest proportion. |
Leukaemia had a very strong geographical pattern of relative risk, which was similar for men and women, although more pronounced in men (Maps 13.1-13.3).
The maps show a gradient of risk across the island, highest in the south-west and reducing uniformly across the country, with the lowest risk in the north-east (Map 13.1).
This pattern was more pronounced for men (Map 13.2) than women (Map 13.3). There was no marked variation in risk within the urban areas, which had similar risks to their surrounding rural areas.
Map 13.1 Leukaemia, smoothed relative risks: both sexes
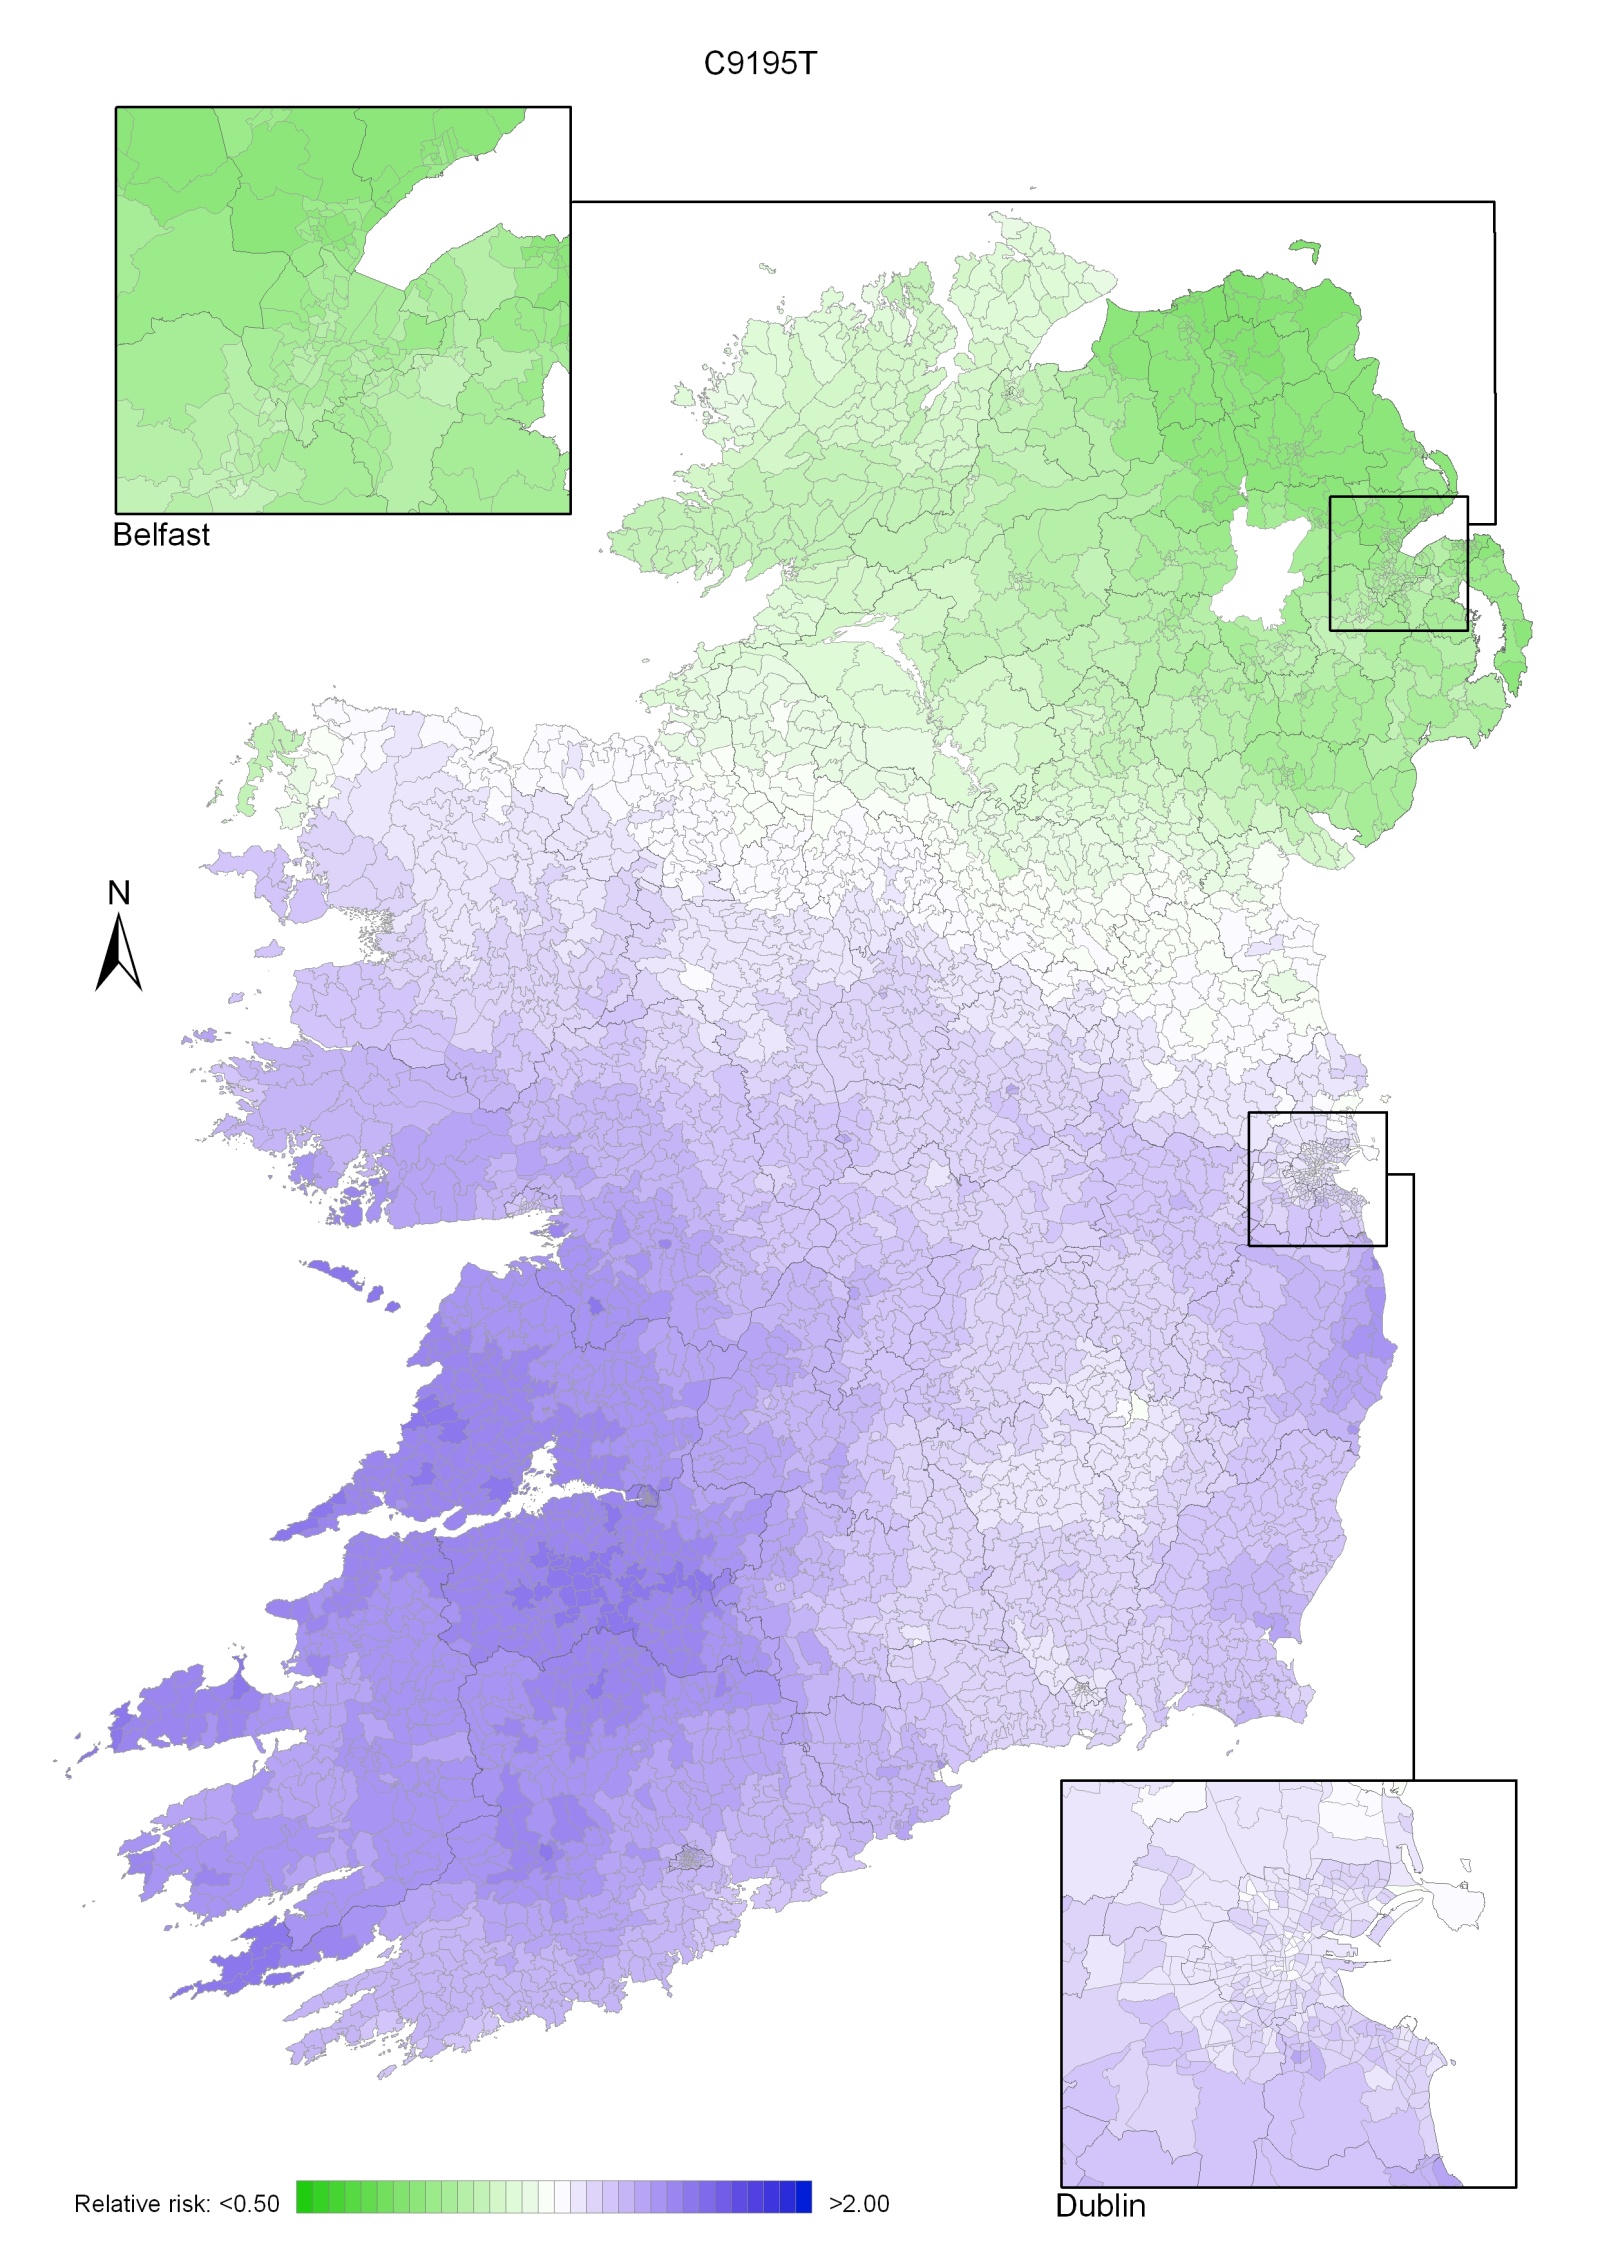
Map 13.2 Leukaemia, smoothed relative risks: males
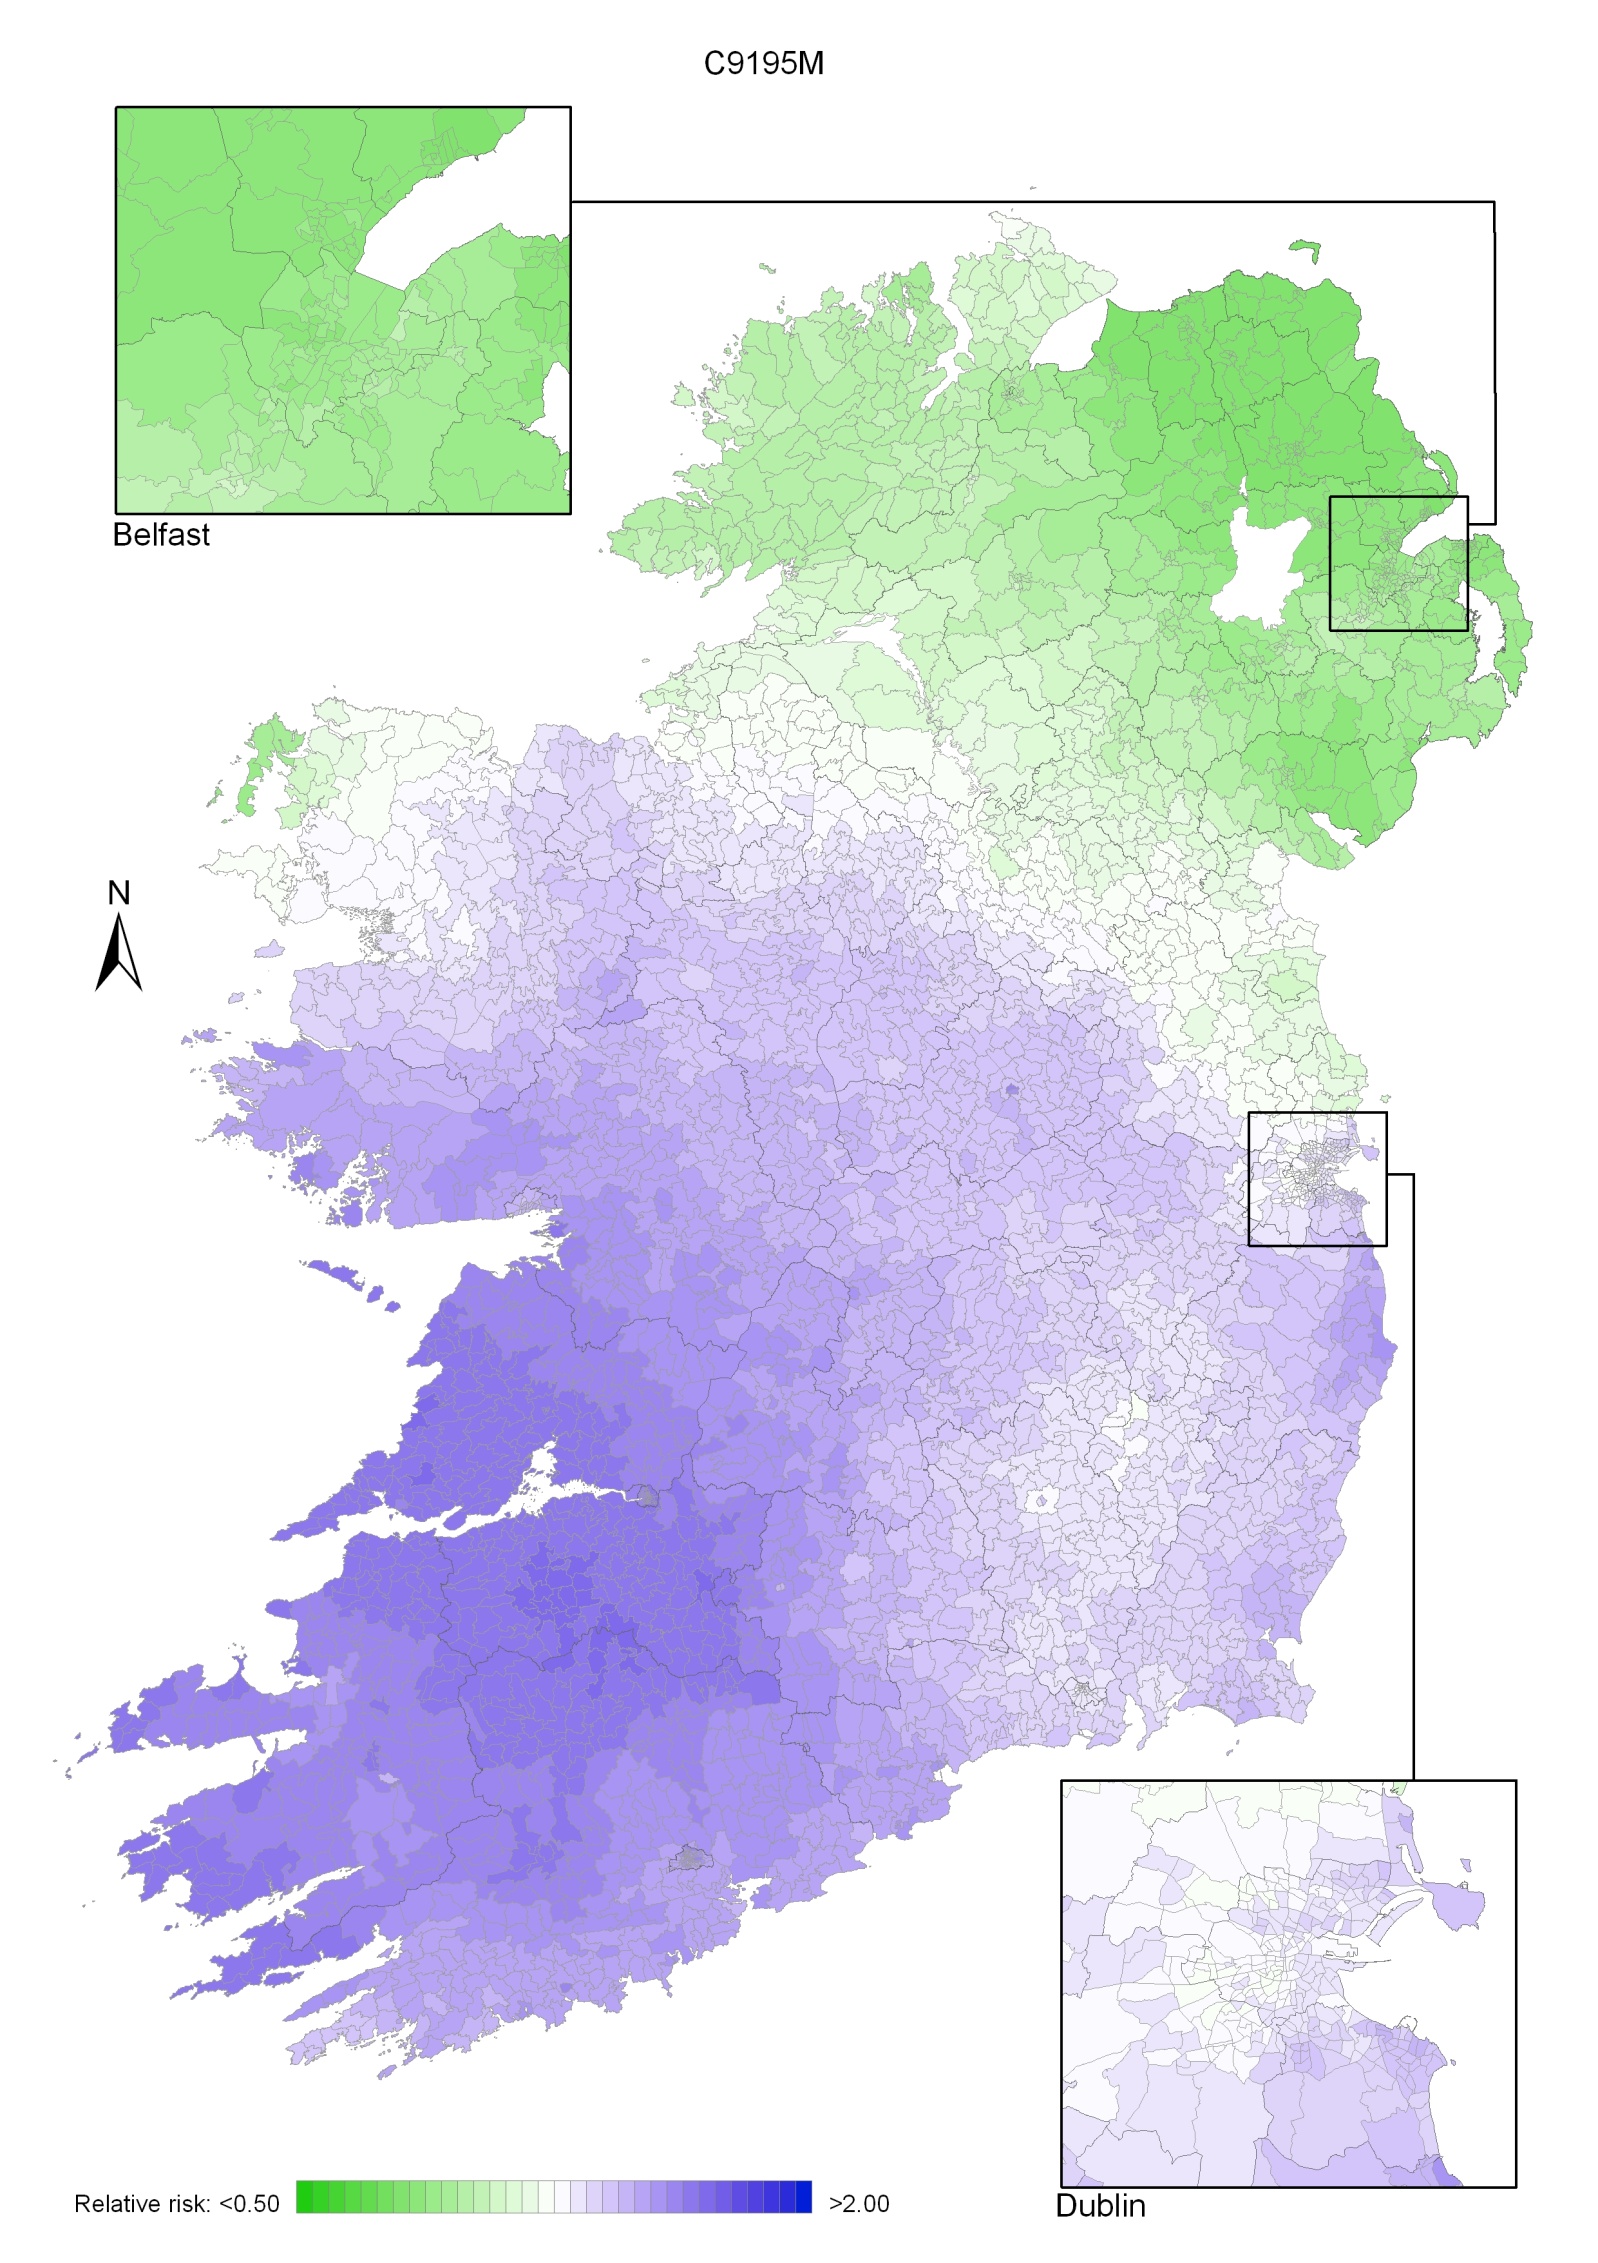
Map 13.3 Leukaemia, smoothed relative risks: females
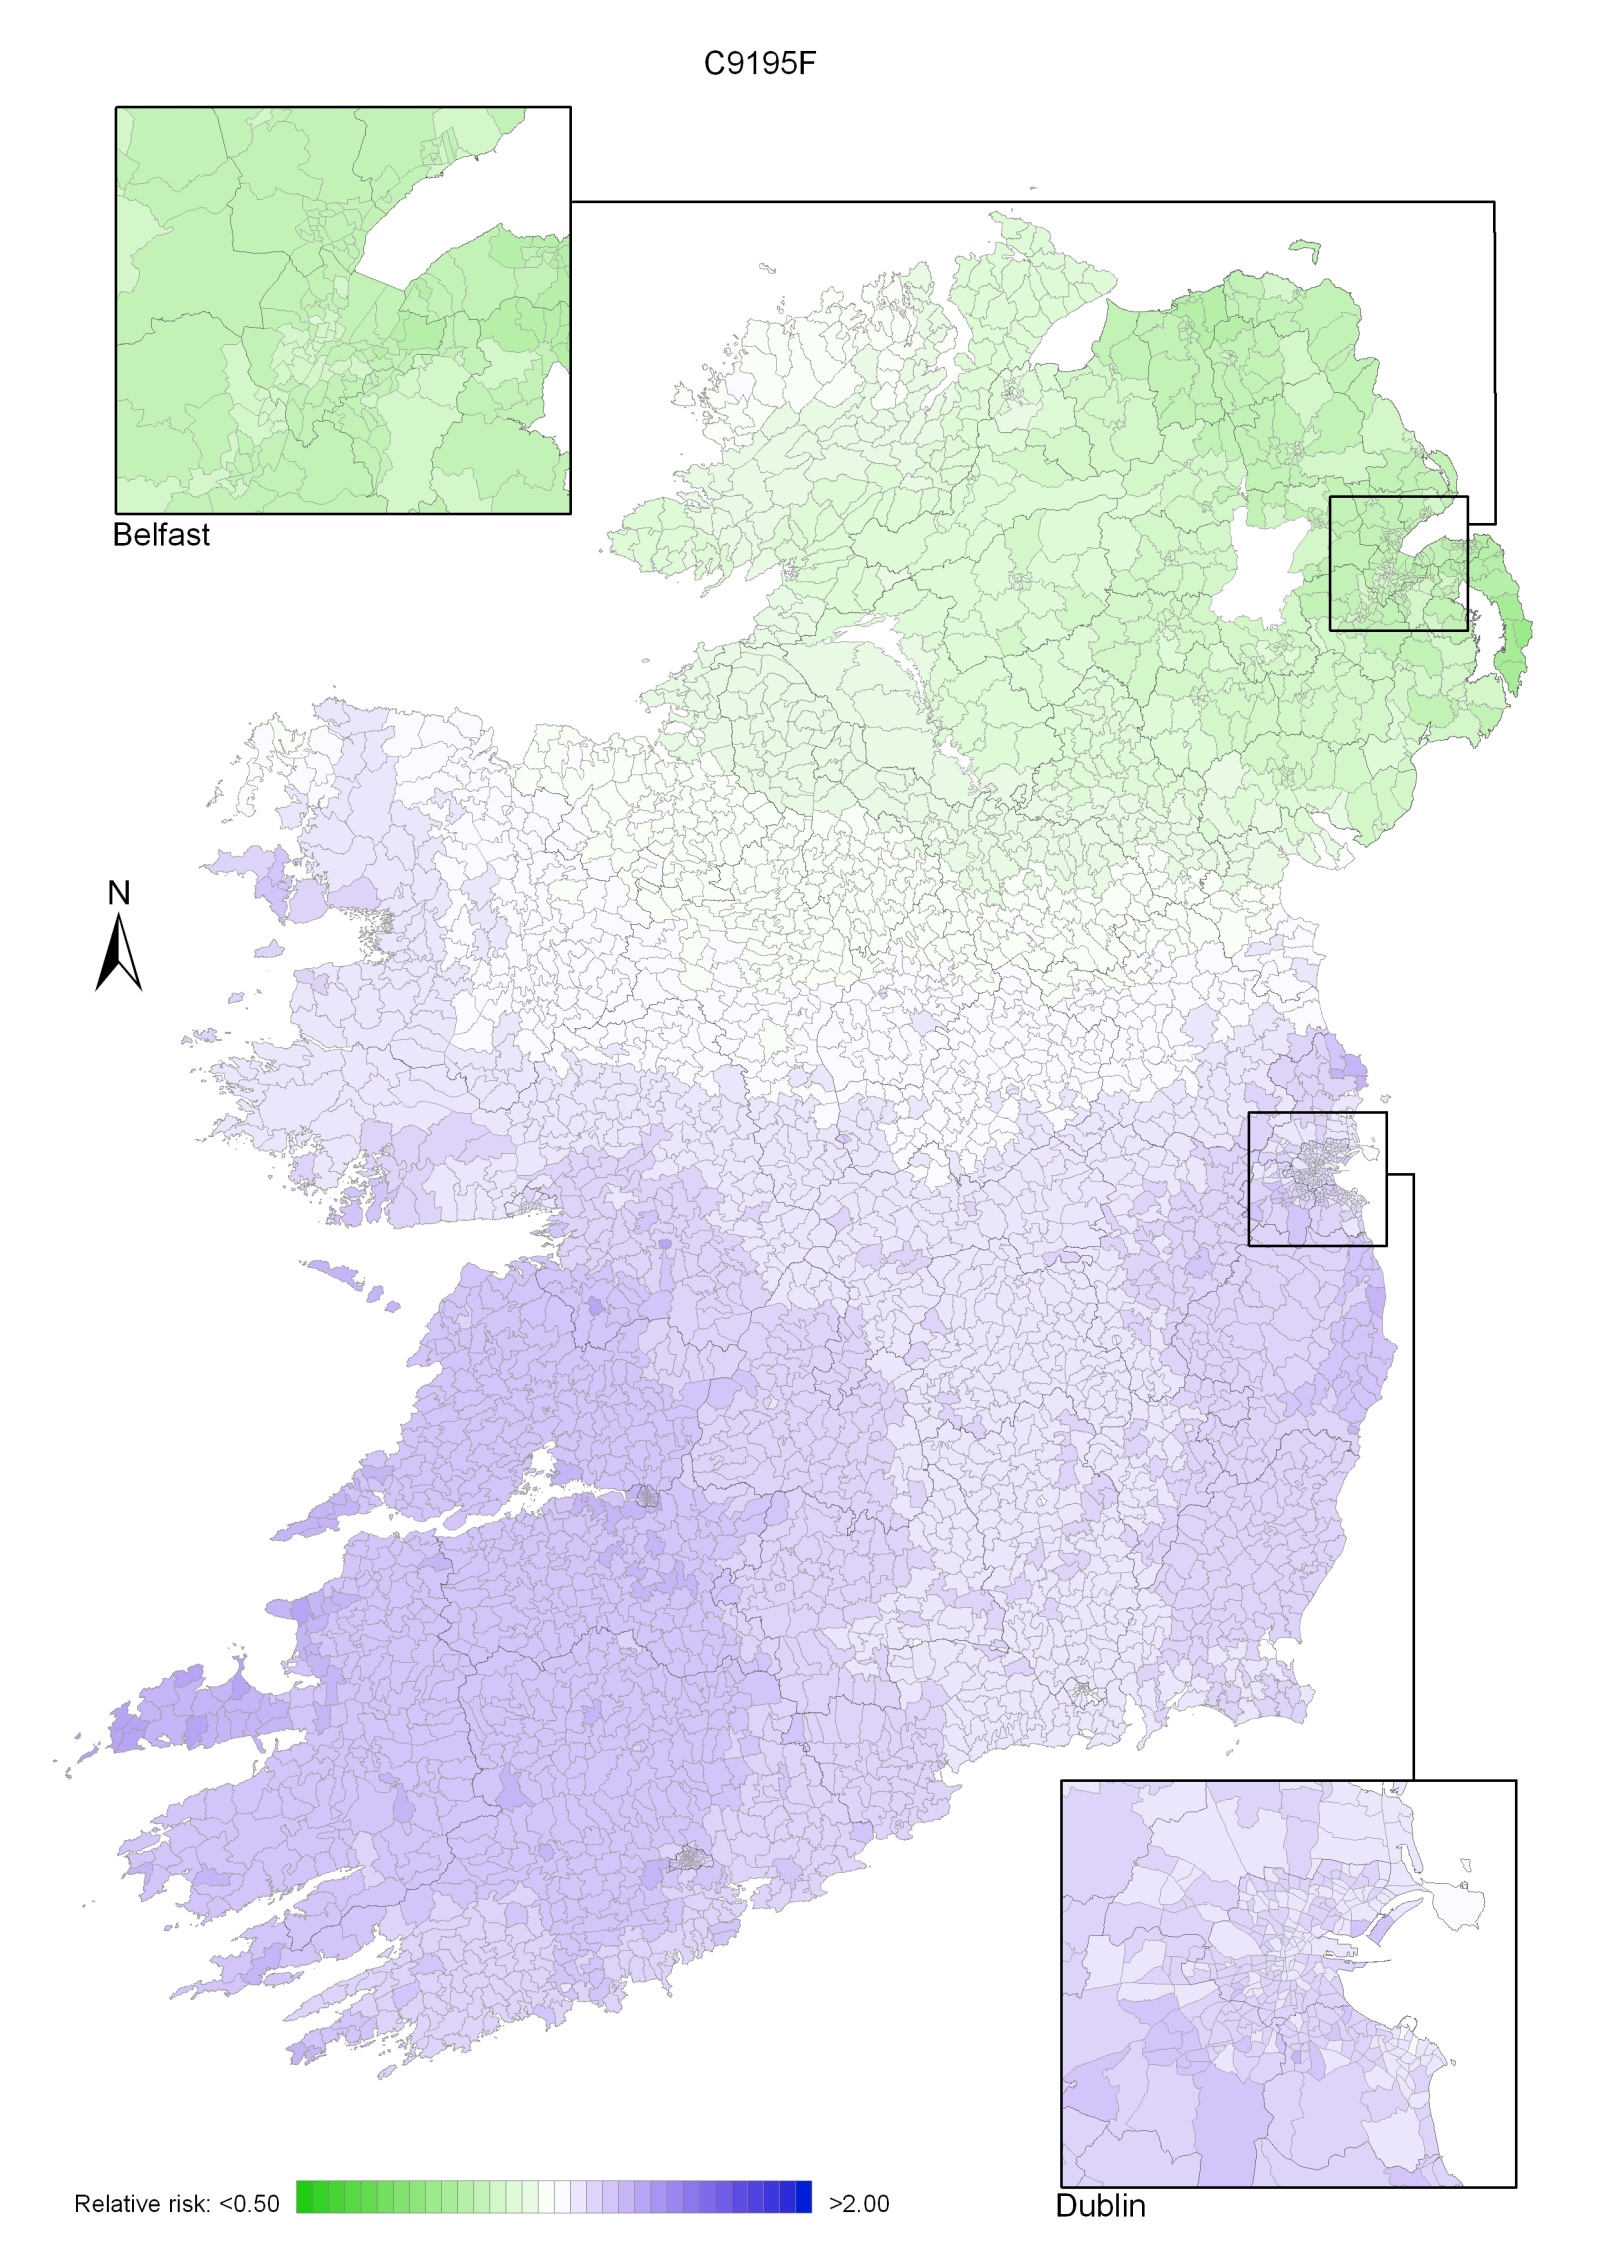
Pancreatic cancer was the eleventh most common cancer in Ireland, accounting for 2.6% of all malignant neoplasms, excluding non-melanoma skin cancer, in women and 2.5% in men (Table 14.1). The average number of new cases diagnosed each year was 272 in women and 269 in men. During 1995-2007, the number of new cases diagnosed showed an overall increase of approximately 4% per annum.
The risk of developing pancreatic cancer up to the age of 74 was 1 in 169 for women and 1 in 123 for men and was similar in RoI and NI. At the end of 2008, 101 women and 115 men aged under 65, and 197 women and 154 men aged 65 and over, were alive up to 15 years after their pancreatic cancer diagnosis.
Table 14.1 Summary information for pancreatic cancer in Ireland, 1995-2007
Ireland | RoI | NI | ||||
females | males | females | males | females | males | |
% of all new cancer cases | 1.9% | 1.8% | 2.0% | 1.8% | 1.7% | 1.8% |
% of all new cancer cases excluding non-melanoma skin cancer | 2.6% | 2.5% | 2.8% | 2.5% | 2.3% | 2.4% |
average number of new cases per year | 272 | 269 | 192 | 189 | 80 | 81 |
cumulative risk to age 74 | 0.6% | 0.8% | 0.6% | 0.8% | 0.5% | 0.8% |
15-year prevalence (1994-2008) | 298 | 269 | 239 | 198 | 59 | 71 |
Pancreatic cancer is a disease of older people; fewer than 20% of new cases were diagnosed in persons under 60 years old, while almost 60% presented at 70 years or over (Figure 14.1). The average age at diagnosis was older for women than men, with a similar age distribution in RoI and NI.
Figure 14.1 Age distribution of pancreatic cancer cases in Ireland, 1995-2007, by sex

Pancreatic cancer rates were highest in the Czech Republic for both men and women, and lowest in Sweden for men and in Portugal for women (Figure 14.2). Male rates of pancreatic cancer in both RoI and NI were close to the median of the countries shown; for women, they were below the median in NI and above the median in RoI.
Figure 14.2 Estimated incidence rate per 100,000 in 2008 for selected developed countries compared to 2005-2007 incidence rate for RoI and NI: pancreatic cancer | |
| females | males |
 | 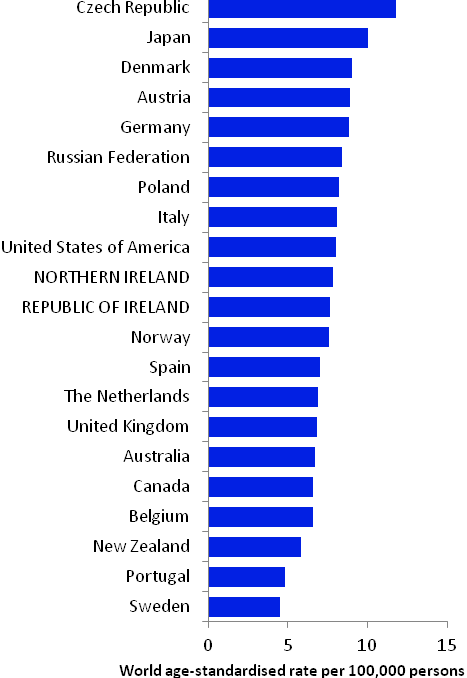 |
Source: GLOBOCAN 2008 (Ferlay et al., 2008) (excluding RoI and NI data, which is derived from Cancer Registry data for 2005-2007) | |
Table 14.2 Risk factors for pancreatic cancer, by direction of association and strength of evidence
| Increases risk | Decreases risk |
Convincing or probable | Tobacco smoking1 | |
| Smokeless tobacco1,2 | |
| Alcohol1,3,4 | |
| Chronic pancreatitis5 | |
| Diabetes6,7 | |
| Greater body fatness/abdominal fatness8,9 | |
| Height/tallness10 | |
| Occupational exposure to styrene11 | |
| Family history of pancreatic cancer12,13,14 | |
Possible | Involuntary (passive) smoking15,16 | Metformin19 |
Insulin resistance/metabolic syndrome17 | Physical activity20 | |
Red meat10,18 | Folate10,21 | |
Allergic conditions and/or atopy22,23 | ||
1 Secretan et al., 2009; 2 chewing tobacco or snuff; 3 Michaud et al., 2010; 4 Lucenteforte et al., 2011; 5 Raimondi et al., 2010; 6 Ben et al., 2011; 7 Li et al., 2011b; 8 Jiao et al., 2010; 9 Arslan et al., 2010; 10 World Cancer Research Fund / American Institute for Cancer Research, 2007; 11 National Toxicology Program, 2008; 12 one or more first degree relatives(s) with cancer of the pancreas; 13 Maisonneuve and Lowenfels, 2010; 14 Jacobs et al., 2010; 15 exposure in childhood and/or in adulthood at home or work; 16 Vrieling et al., 2010; 17 Rosato et al., 2011; 18 beef, pork and lamb; 19 Decensi et al., 2010; 20 O’Rorke et al., 2010; 21 found in green leafy vegetables and beans, peas and lentils; 22 including eczema, hay fever and rhinitis; 23 Gandini et al., 2005c | ||
Tobacco smoking is causally related to pancreatic cancer (Table 14.2) and accounts for 20-25% of cases (Maisonneuve & Lowenfels, 2010). Smokers of cigarettes, cigars and pipes are all at increased risk; risk increases with duration of smoking and cumulative smoking dose, and decreases to background levels 15 years after smoking cessation (Lynch et al., 2009). Use of smokeless tobacco is also a causal factor and there are suggestions that individuals exposed to environmental tobacco smoke either in childhood, or at home or work as adults, have increased risk of pancreatic cancer. Alcohol is also causally related to pancreatic cancer although the association appears to be restricted to individuals with high alcohol intake, and may be limited to men.
As regards medical conditions, around 5% of patients with long-term inflammation of the pancreas (chronic pancreatitis) are likely to develop pancreatic cancer over a 20 year period. Diabetics have increased risk, especially insulin users, but some uncertainties remain regarding the association (Magruder et al., 2011). In a few studies, insulin resistance and metabolic syndrome have also been linked to elevated pancreatic cancer risk, while use of metformin as a treatment for diabetes has been associated with reduced risk. Inverse associations have been reported between allergic conditions and atopy and pancreatic cancer risk.
Taller adults have increased risk, but height per se is unlikely to affect risk; it is most probably a marker for a risk factor related to linear growth in childhood. Risk of pancreatic cancer increases with increasing body fatness, by 6% for men and 12% for women per 5kg/m2 increase in body mass index. In addition, most studies which have examined measures of abdominal fatness have reported positive findings. Some other lifestyle-related factors have been linked to pancreatic cancer (e.g. physical activity, aspects of diet), but the evidence regarding these remains somewhat uncertain.
An estimated 5-10% of pancreatic cancers arise as a result of genetic syndromes. One affected first degree relative confers a 75% increased risk.
Figure 14.3 Adjusted relative risks (with 95% confidence intervals) of pancreatic cancer by socio-economic characteristics of geographic area of residence: males | MalesAmong men, after adjustment for age, population density and socio-economic factors, pancreatic cancer risk was lower in NI than in RoI (RR=0.85, 95%CI=0.79-0.93). Socio-economic factors accounted for only a small proportion of this difference (Figure 14.3). Male pancreatic cancer was not associated with population density, education or the proportion of persons aged 75 and over living alone. Unemployment was positively associated with male pancreatic cancer, with a steady increase in risk as unemployment levels in an area increased. |
Figure 14.4 Adjusted relative risks (with 95% confidence intervals) of pancreatic cancer by socio-economic characteristics of geographic area of residence: females
| FemalesThe risk of pancreatic cancer in women was 22% lower in NI than in RoI; as in men adjustment for socio-economic factors had a relatively small effect on this difference (Figure 14.4). As with men, there was no significant variation in risk of female pancreatic cancer by population density. However, unlike men, there was no association with unemployment and a positive association with lower educational attainment. Areas with the highest proportion of persons aged 75 and over living alone had a 16% greater risk of female pancreatic cancer than areas with the lowest proportion. |
Pancreatic cancer had a strong geographical pattern which was similar for men and women (Maps 14.1-14.3).
This consisted of a fairly smooth gradient, from the area of lowest risk in the north-east to the area of highest risk in the south-west (Map 14.1), highest around Cork city for men (Map 14.2) and centred on north Kerry in women, for whom there were also some areas of higher risk in Donegal (Map 14.3). The variation in risk was more pronounced for women than for men.
Map 14.1 Pancreatic cancer, smoothed relative risks: both sexes
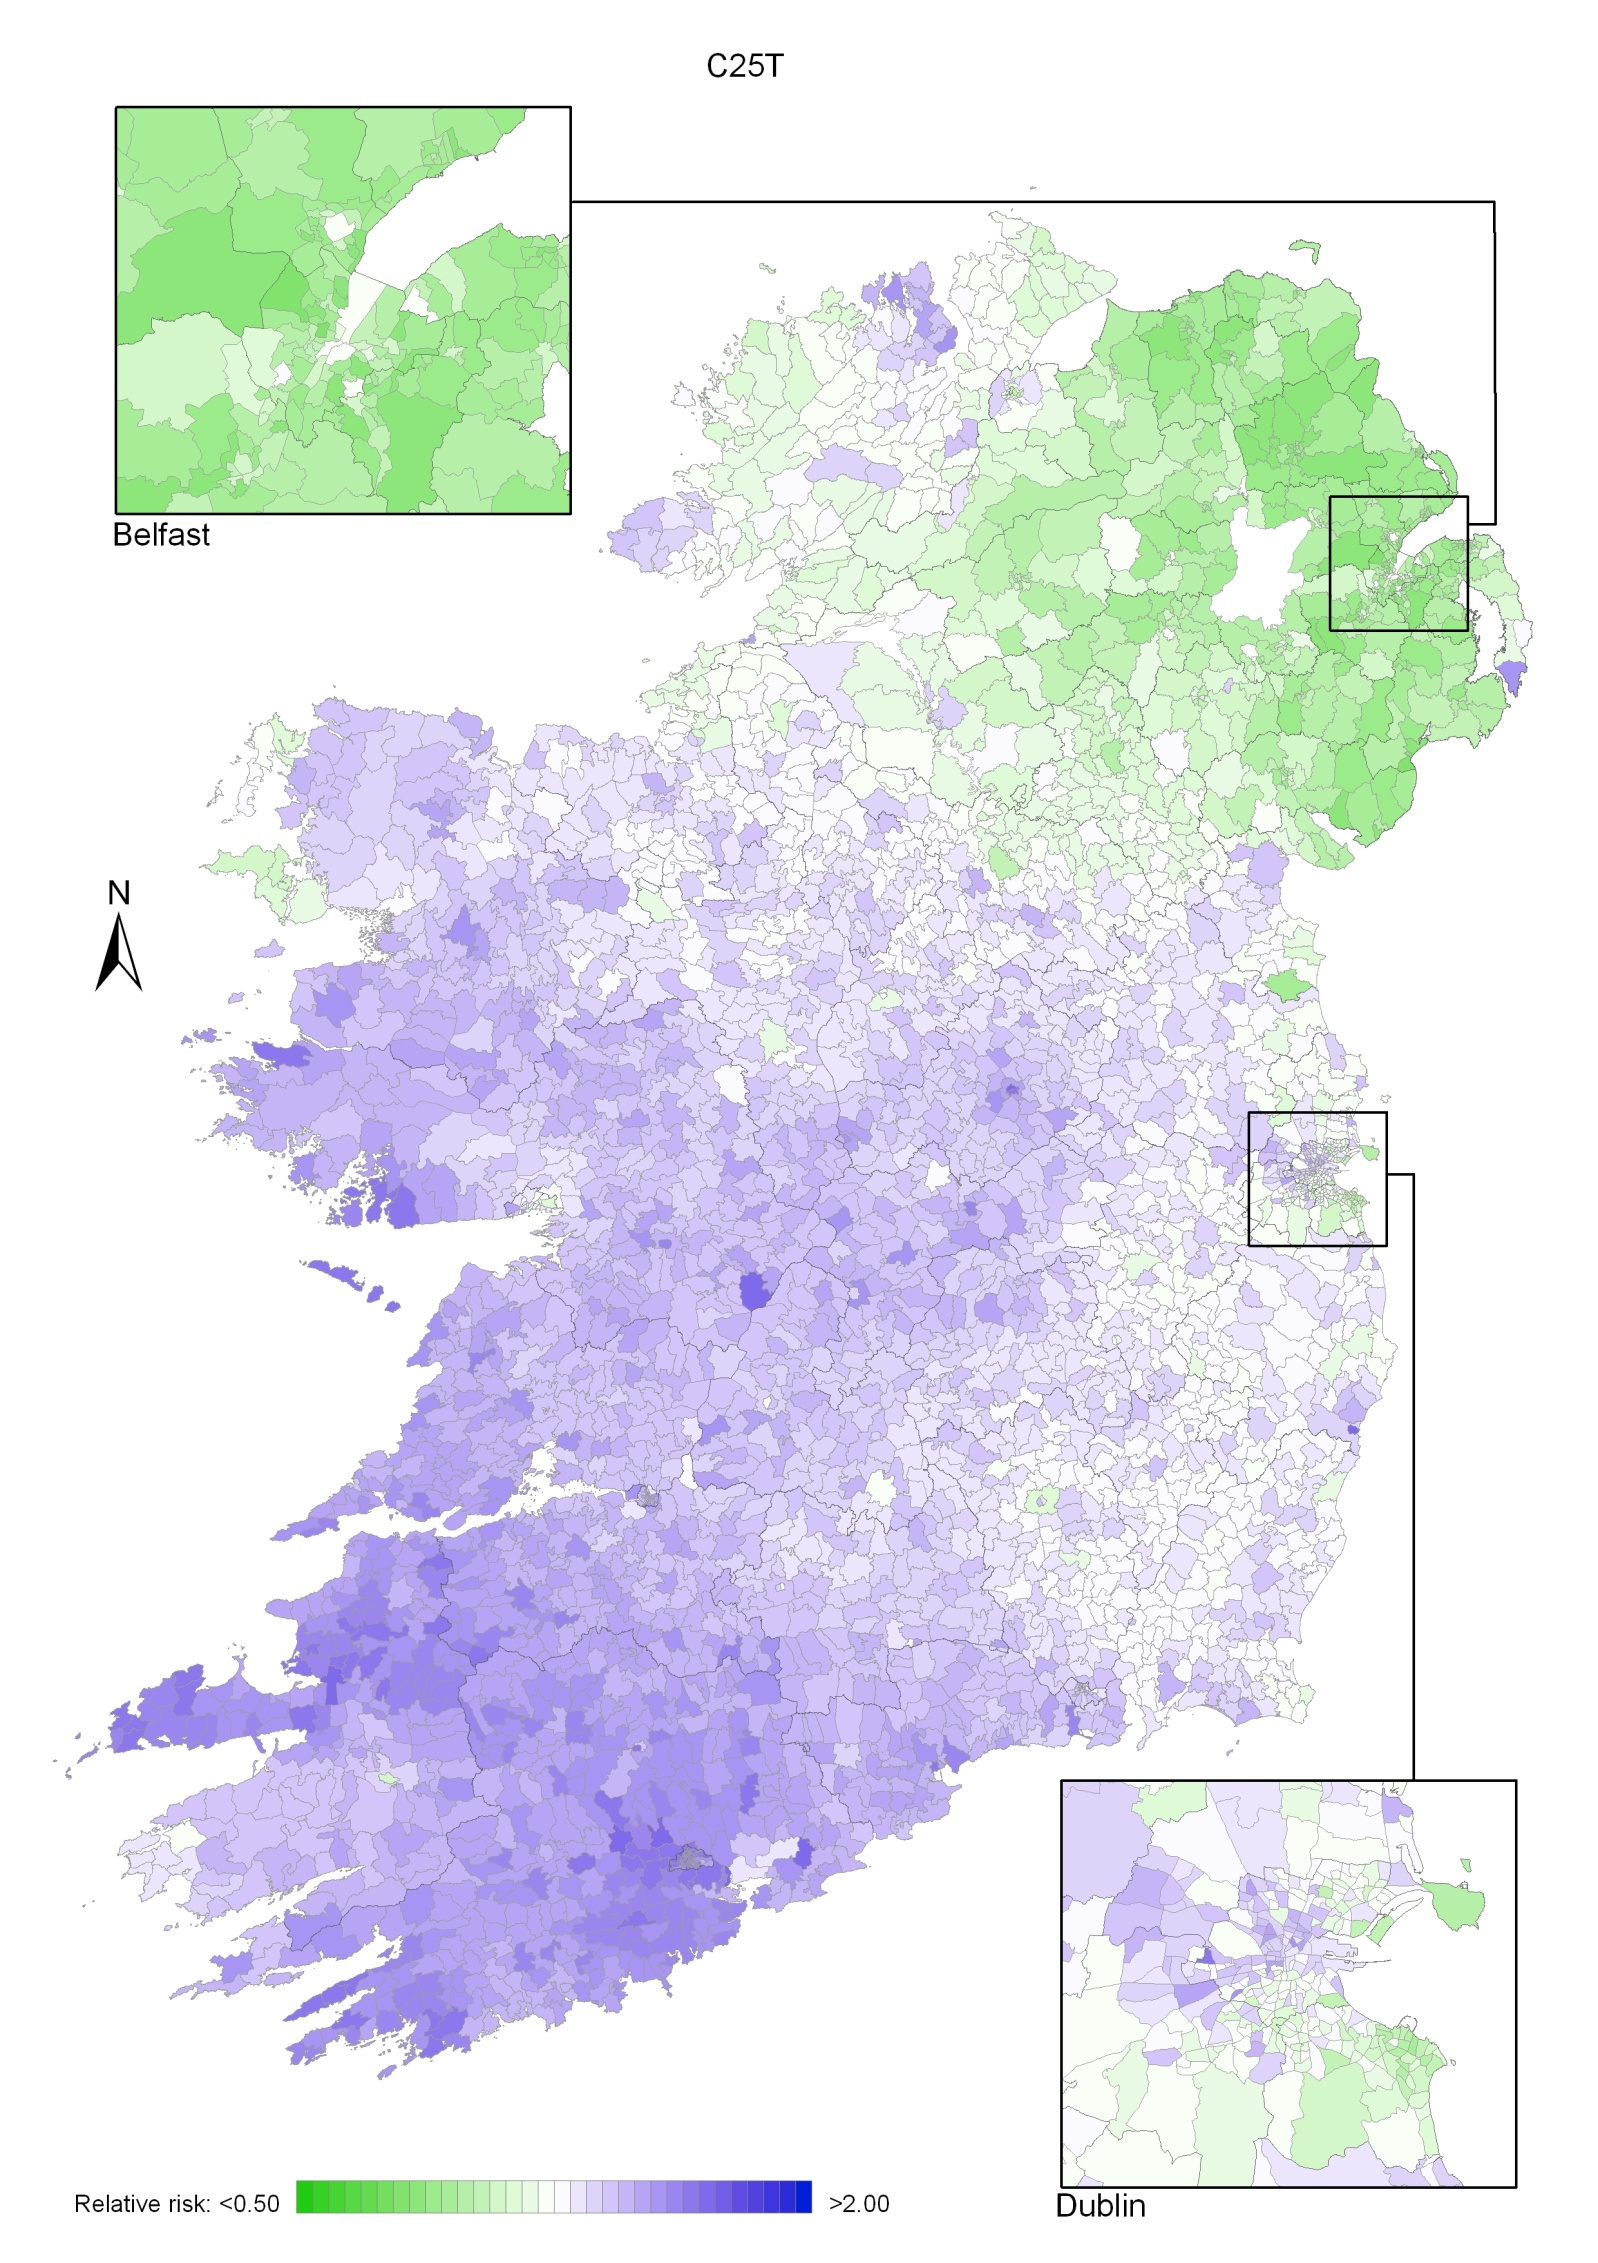
Map 14.2 Pancreatic cancer, smoothed relative risks: males
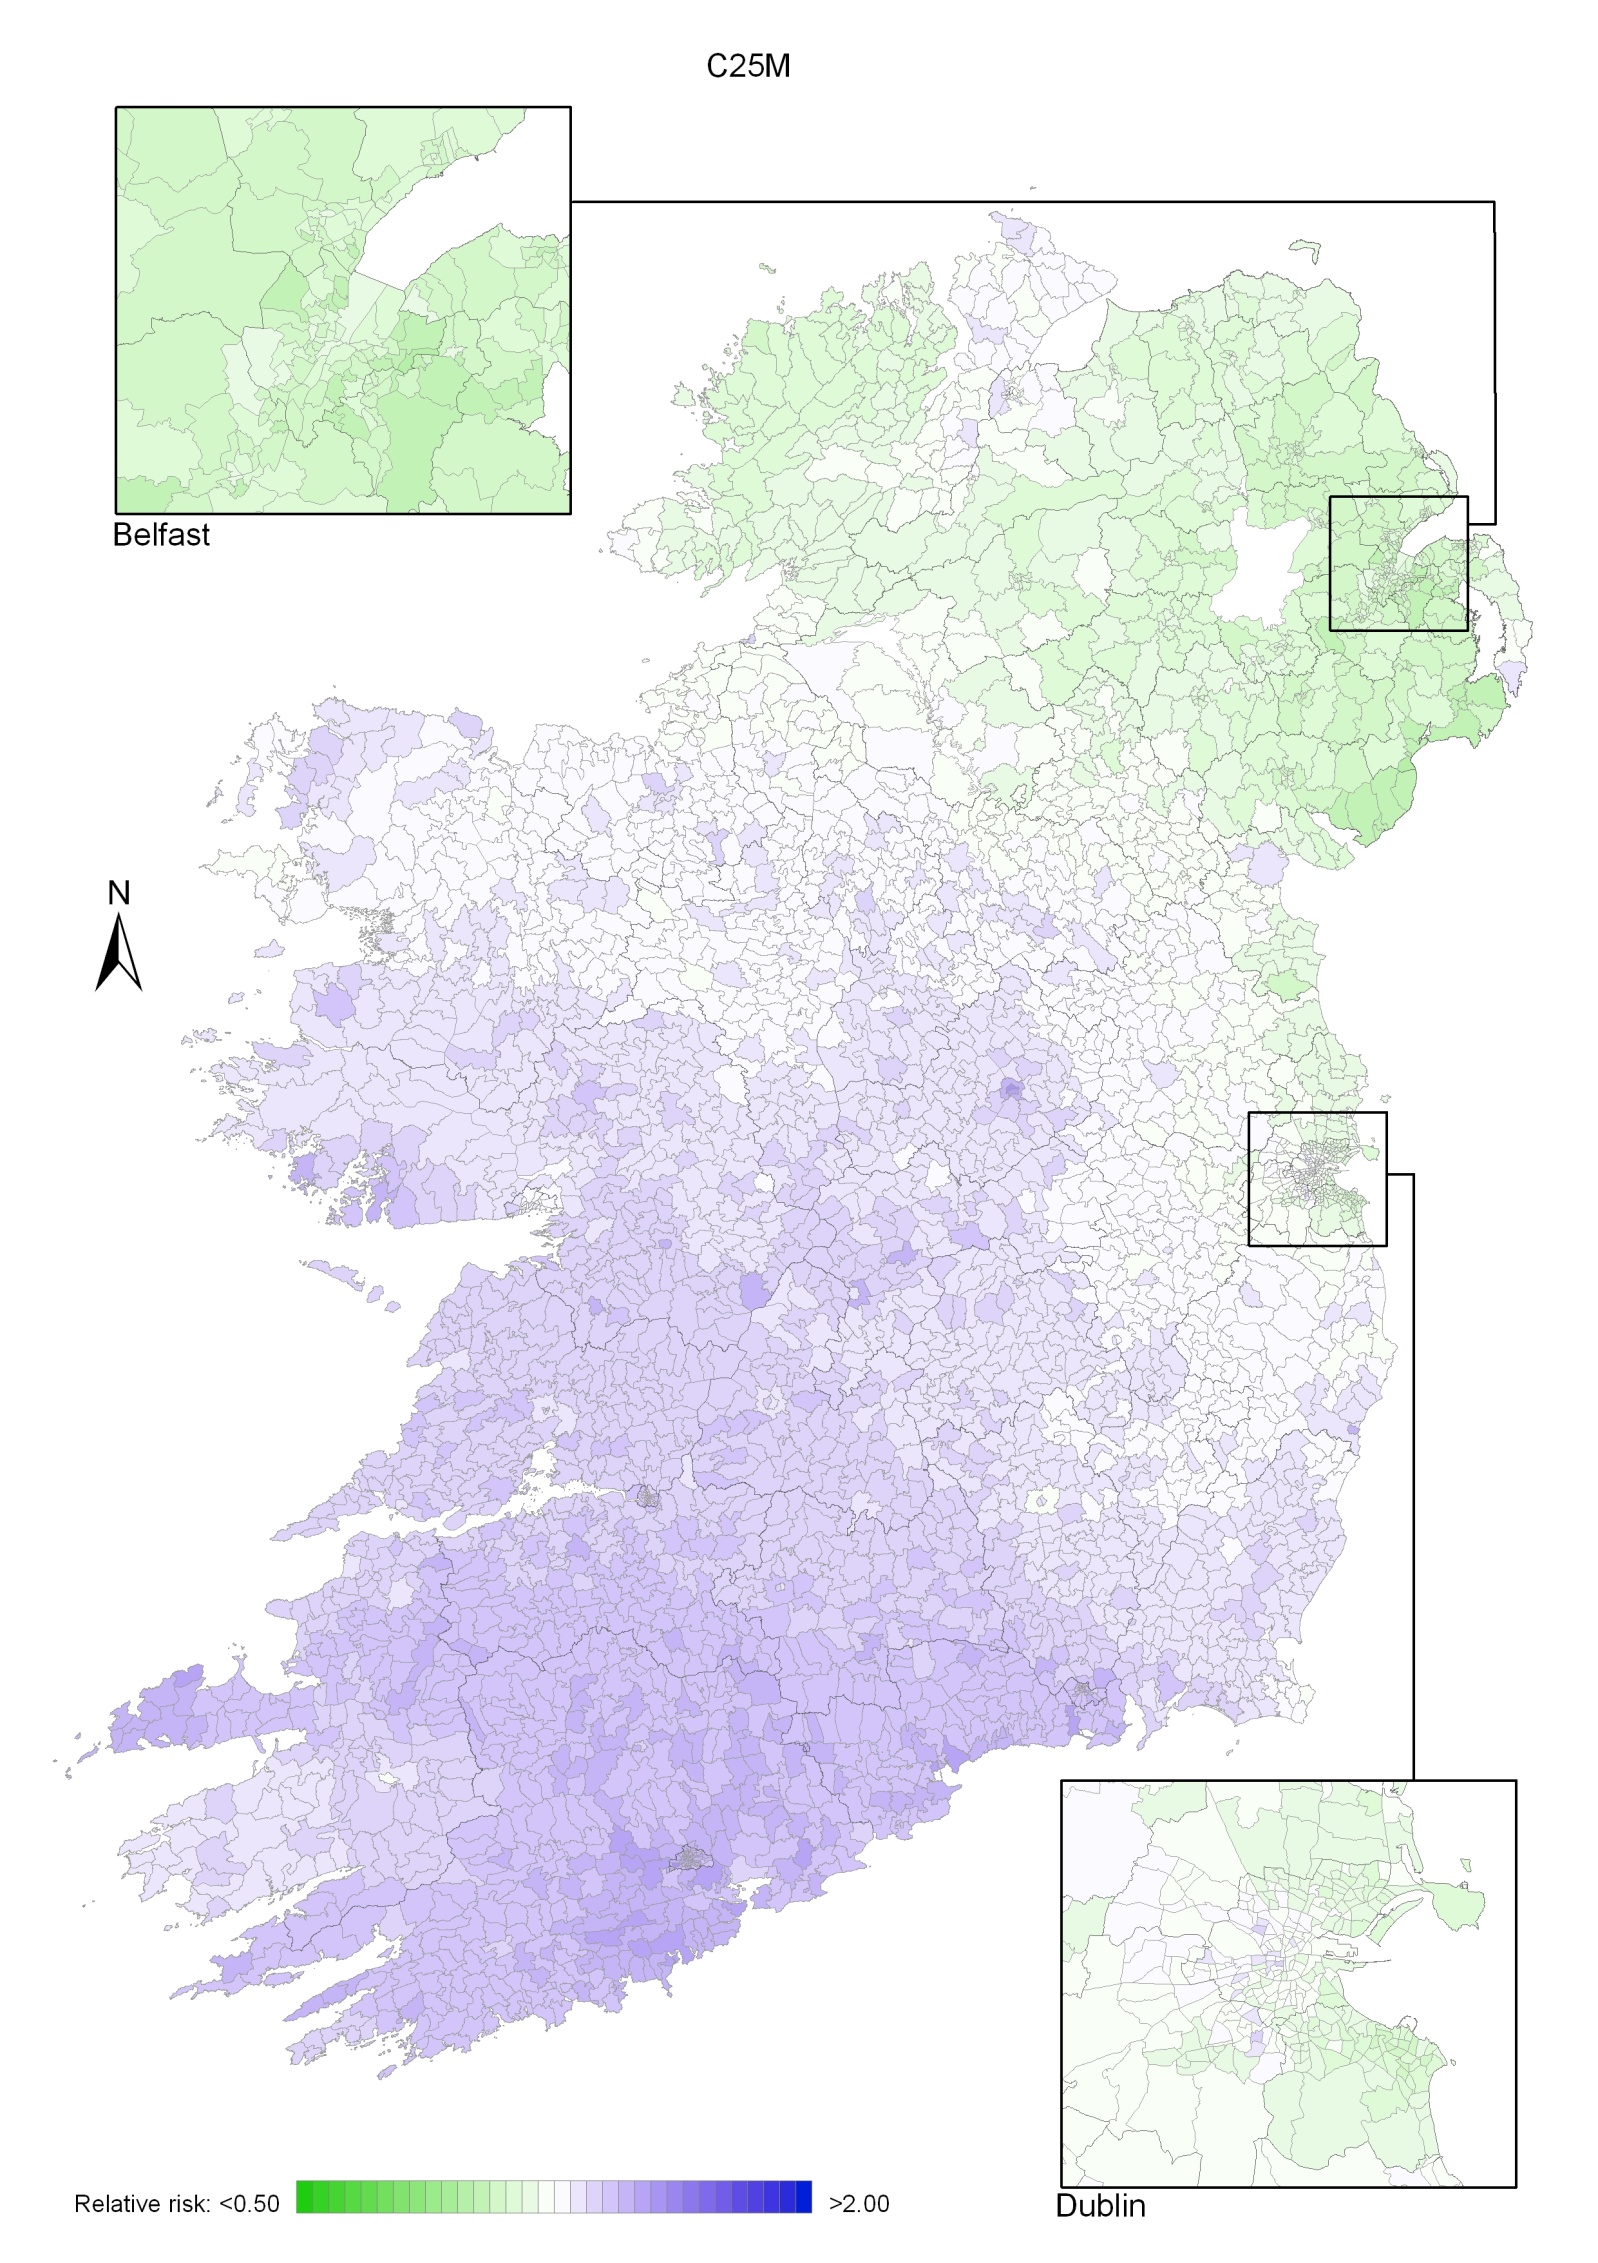
Map 14.3 Pancreatic cancer, smoothed relative risks: females
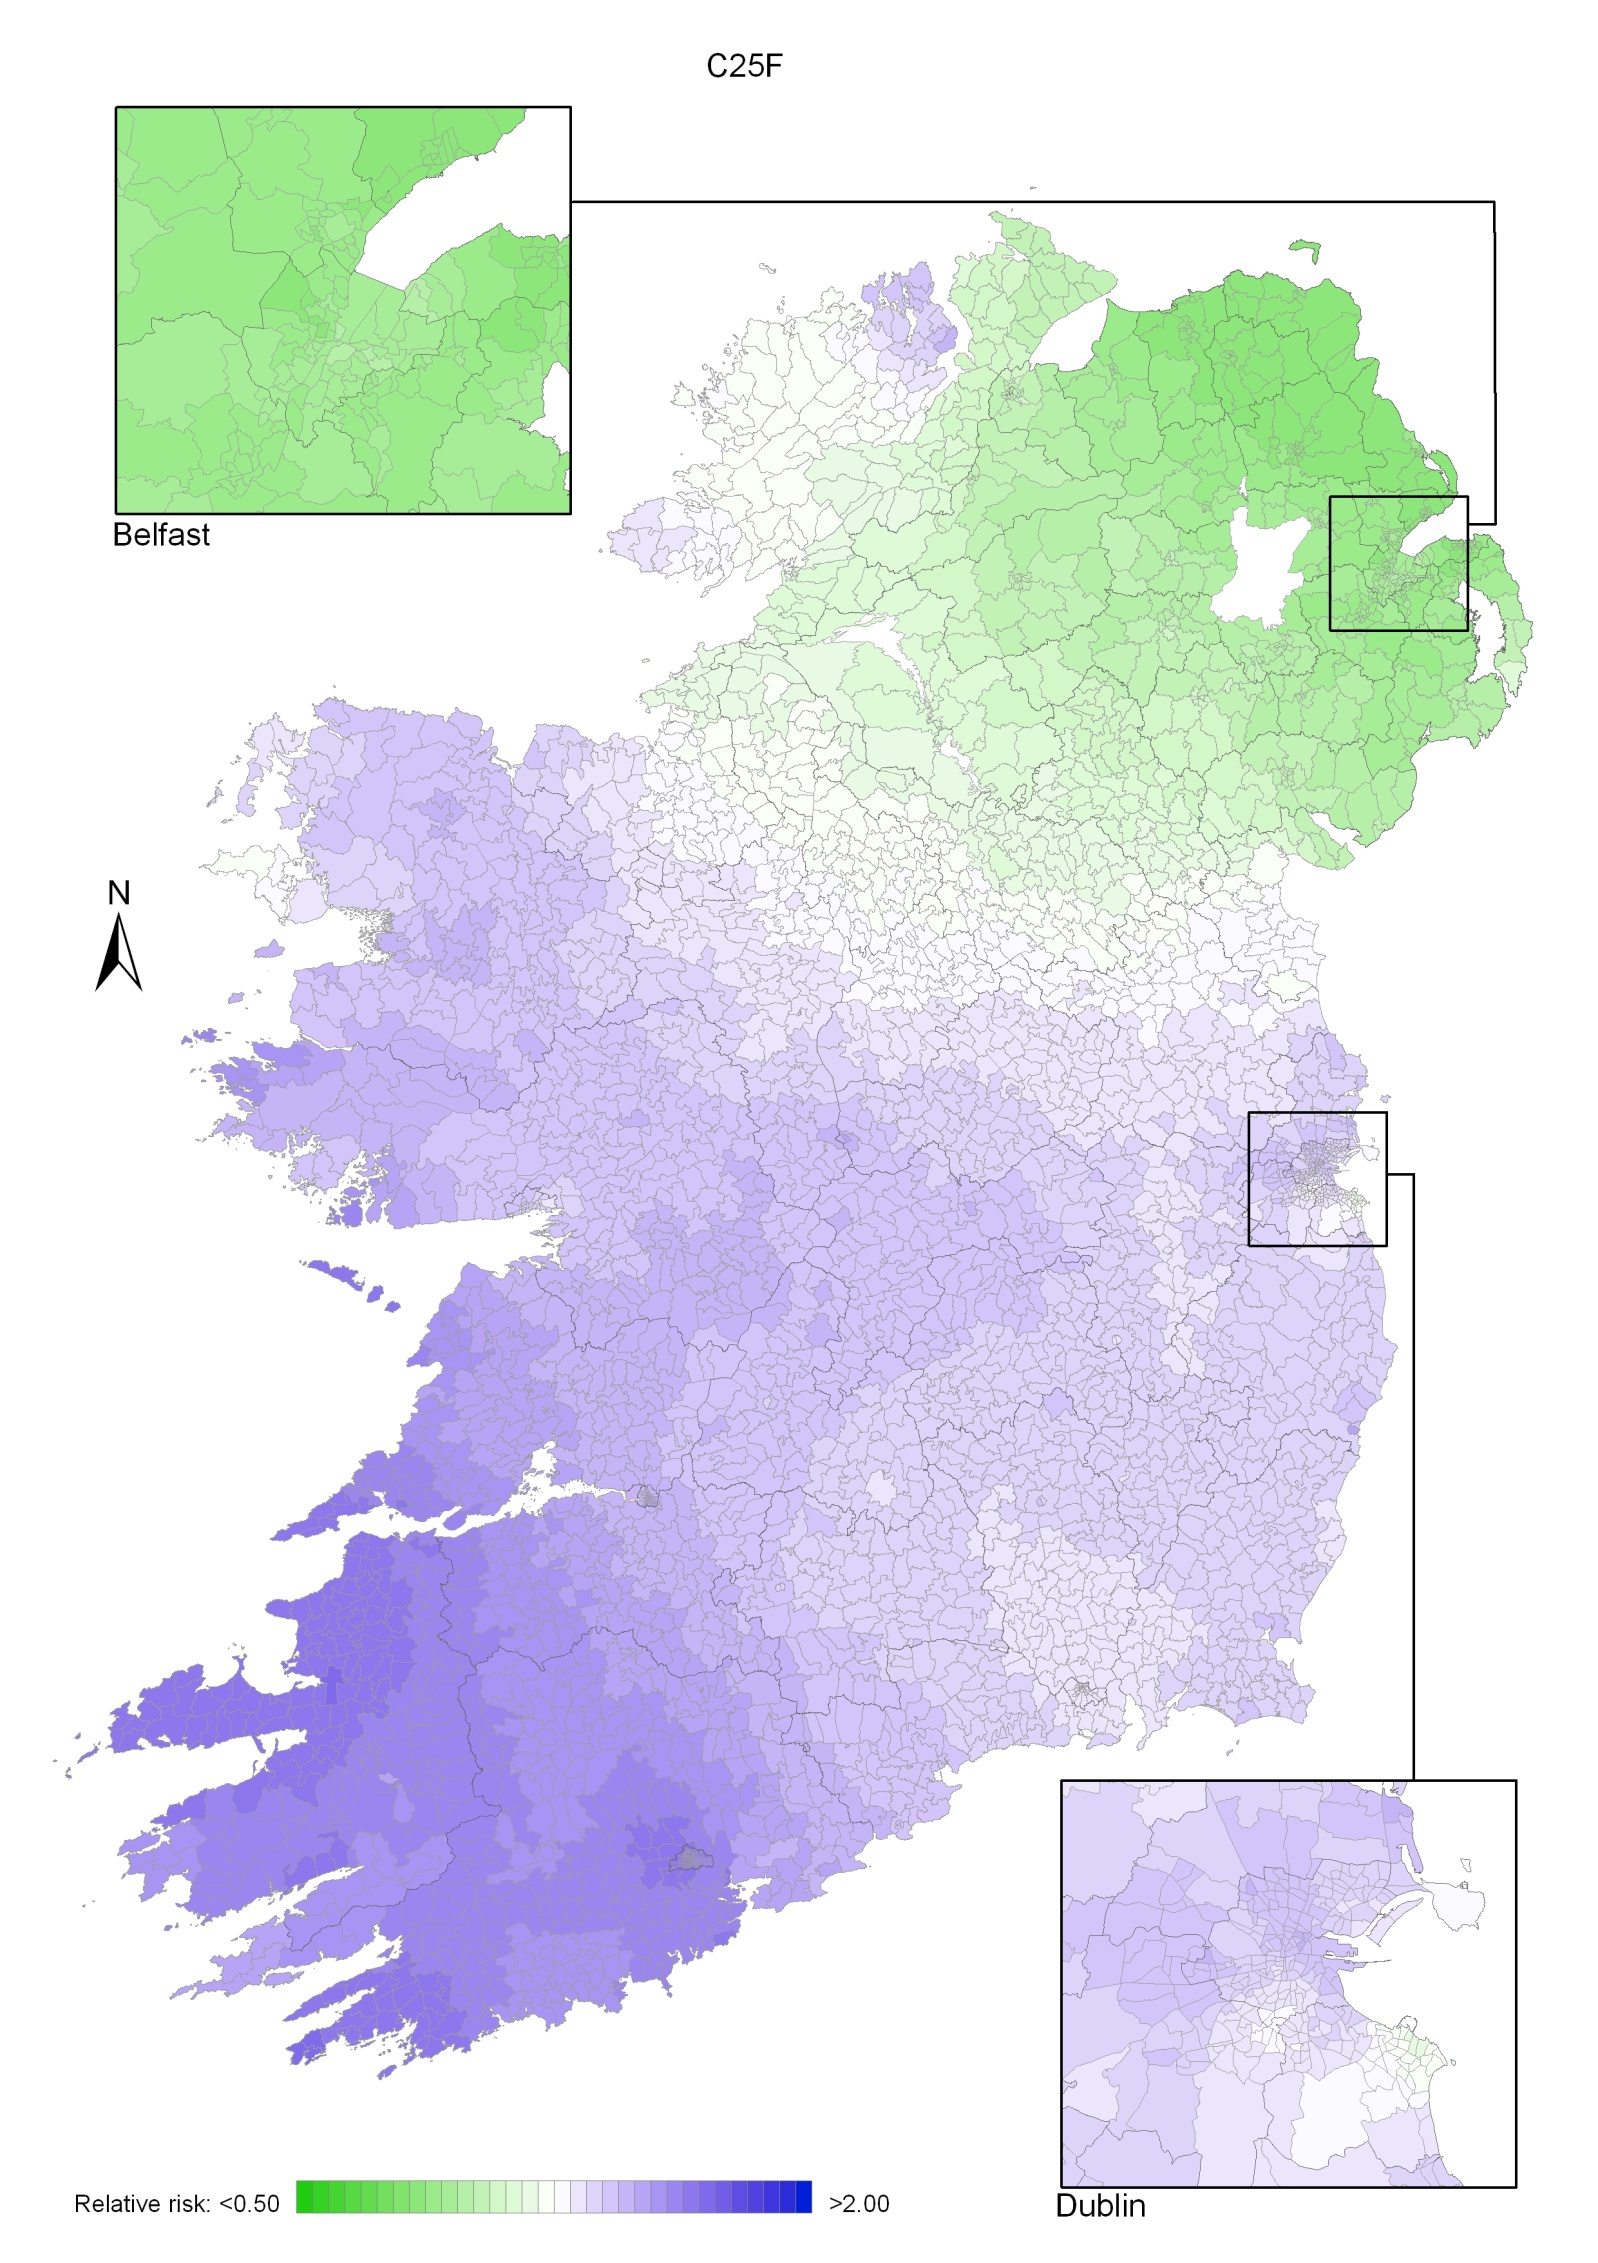
Kidney cancer was the twelfth most common cancer in Ireland, accounting for 1.8% of all malignant neoplasms, excluding non-melanoma skin cancer, in women and 2.8% in men (Table 15.1). The average number of new cases diagnosed each year was 188 in women and 310 in men. During 1995-2007, the number of new cases diagnosed showed an overall increase of approximately 6% per annum in RoI; the rate of increase was lower in NI at approximately 3%.
The risk of developing kidney cancer up to the age of 74 was 1 in 188 for women and 1 in 98 for men and was similar in NI and RoI. At the end of 2008, 606 women and 959 men aged under 65, and 765 women and 1,070 men aged 65 and over, were alive up to 15 years after their kidney cancer diagnosis.
Table 15.1 Summary information for kidney cancer in Ireland, 1995-2007
Ireland | RoI | NI | ||||
female | male | female | male | female | male | |
% of all new cancer cases | 1.3% | 2.0% | 1.3% | 2.0% | 1.4% | 2.1% |
% of all new cancer cases excluding non-melanoma skin cancer | 1.8% | 2.8% | 1.8% | 2.8% | 1.9% | 2.9% |
average number of new cases per year | 188 | 310 | 123 | 214 | 65 | 96 |
cumulative risk to age 74 | 0.5% | 1.0% | 0.5% | 1.0% | 0.5% | 1.0% |
15-year prevalence (1994-2008) | 1371 | 2029 | 913 | 1407 | 458 | 622 |
Kidney cancer is a disease of older ages, with only about 30% of new cases diagnosed in persons under 60 years old, and the majority of new cases presenting between 60 and 79 years. A significant percentage of women (16%) were diagnosed at 80 years and over (Figure 15.1). Age at diagnosis was slightly younger in RoI than in NI.
Figure 15.1 Age distribution of kidney cancer cases in Ireland, 1995-2007, by sex
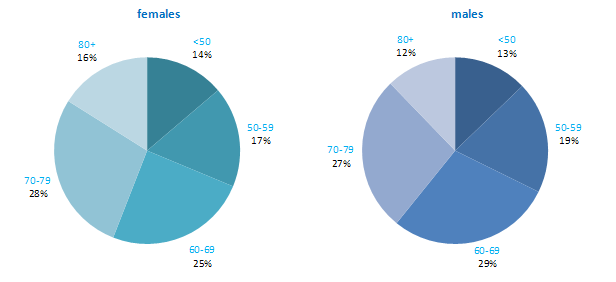
Kidney cancer rates were highest in the Czech Republic, followed by the USA, for both men and women (Figure 15.2). The lowest rates occurred in Japan and Portugal for both men and women. Compared to other developed countries, the rates of kidney cancer were slightly below the median in both RoI and NI.
Figure 15.2 Estimated incidence rate per 100,000 in 2008 for selected developed countries compared to 2005-2007 incidence rate for RoI and NI: kidney cancer | |
| females | males |
 | 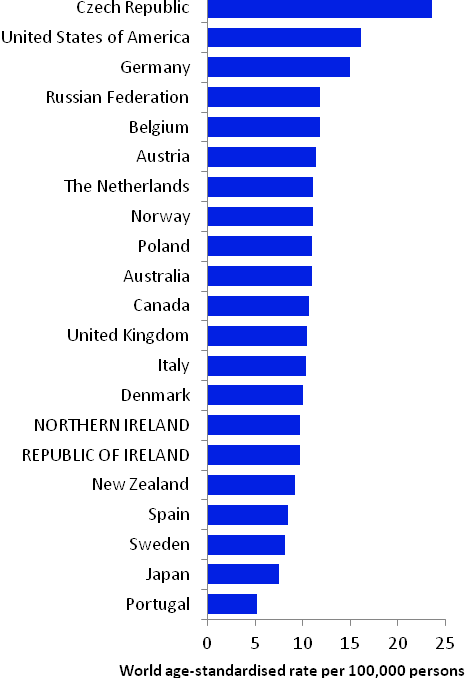 |
Source: GLOBOCAN 2008 (Ferlay et al., 2008) (excluding RoI and NI data, which is derived from Cancer Registry data for 2005-2007) NOTE: KIdney cancer was defined in GLOBOCAN 2008 by ICD10 codes C64-C66 but in this atlas we have used codes C64-C65 (see Table 2.1.). The incidence rates shown for NI and RoI in Figure 15.2 use the GLOBOCAN definition, and are consequently slightly inconsistent with data in the rest of this chapter. | |
Table 15.2 Risk factors for kidney cancer, by direction of association and strength of evidence
Increases risk | Decreases risk | |
Convincing or probable | Tobacco smoking1 | |
| Body fatness2,3,4 | |
| Dialysis5 | |
| High blood pressure6 | |
| Arsenic and inorganic arsenic compounds7 | |
| Cadmium and cadmium compounds7 | |
| Ionizing radiation8 | |
| Family history of kidney cancer9,10,11 | |
Possible | Smokeless tobacco12,13 | Alcohol17 |
Antihypertensive drugs6,14, 15 | ||
Occupational exposure to trichloroethylene16 | ||
1 Secretan et al., 2009; 2 World Cancer Research Fund / American Institute of Cancer Research, 2007; 3 Ildaphonse et al., 2009; 4 Mathew et al., 2009; 5 Ljunberg et al., 2011; 6 Corrao et al., 2007; 7 Straif et al., 2009; 8 El Ghissassi et al., 2009; 9 one or more first degree relative(s) with cancer of the kidney; 10 Hung et al., 2007; 11 Clague et al., 2009; 12 chewing tobacco or snuff; 13 Lee and Hamling, 2009; 14 diuretic and non-diuretic; 15 Grossman et al., 2001; 16 Kelsh et al., 2010; 17 Lee et al., 2007 | ||
The two most common types of kidney cancer are renal cell carcinoma and urothelial cell carcinoma of the renal pelvis; the majority (over 90%) are renal cell carcinomas. Tobacco smoking is causally associated with renal cell cancer in both men and women (Table 15.2): there is a dose-response relationship with number of cigarettes smoked and, in some studies, risk reduces after cessation of smoking (International Agency for Research on Cancer, 2004b). An association between use of smokeless tobacco and kidney cancers in general has also been suggested.
As regards other lifestyle-related risk factors, pooled analysis of prospective studies suggests that drinking alcohol may be associated with a moderately decreased risk of renal cell cancers. In contrast, studies consistently show that body fatness is associated with elevated risk. Overall, risk increases by almost one-third per 5kg/m2 increase in body mass index and perhaps to a slightly greater extent in women than men.
Advanced kidney disease, which makes dialysis necessary, raises the risk of renal cell cancer, but the underlying mechanism is unclear. Hypertension has also been associated with a 60% increased risk of renal cell cancer. Risk may also be raised in those who have used antihypertensive drugs, but whether the associations hold in men and women and after adjustment for other risk factors is somewhat uncertain.
Exposure to cadmium and cadmium compounds, which generally takes place occupationally, and to arsenic or inorganic arsenic compounds, which may be occupational or ingested in food or drinking water, is likely to cause kidney cancer. Occupational exposure to tricholoroethylene, a hydrocarbon commonly used as an industrial solvent, has been associated with a modestly raised risk, but concerns remain about whether the association could be due to uncontrolled confounding.
After accounting for other risk factors, risk of kidney cancer in general, and renal cell cancer in particular, is increased by between 40% and 100% in those with at least one affected first degree relative.
Figure 15.3 Adjusted relative risks (with 95% confidence intervals) of kidney cancer by socio-economic characteristics of geographic area of residence: males | MalesAdjusting for age alone, there was no significant difference between RoI and NI in the risk of kidney cancer in men during 1995-2007 (Figure 15.3). However once adjustments for population density and socio-economic factors were made, a lower relative risk for NI, compared to RoI, of 0.92 (95%CI=0.85-0.99) was identified. There was no association between male kidney cancer risk and population density, educational attainment or socio-economic characteristics, although quintile 4 of the unemployment area-based measure had a slightly elevated rate of kidney cancer. |
Figure 15.4 Adjusted relative risks (with 95% confidence intervals) of kidney cancer by socio-economic characteristics of geographic area of residence: females
| FemalesThe risk of kidney cancer in women did not differ significantly between RoI and NI (Figure 15.4). There was a weak positive association between female kidney cancer and population density, with those resident in the most densely populated areas having a 13% greater risk than those in the least dense areas. There were no overall associations with socio-economic characteristics and kidney cancer among women, although those resident in quintile 2 of the unemployment measure, and quintile 3 of the elderly living alone measure had an elevated risk of the disease. |
The geographical pattern of relative risk for kidney cancer showed only modest variation, which was different for men and women (Maps 15.1-15.3).
For both sexes combined, the area of highest relative risk was mainly confined to Leinster, with lower relative risks in the western half of Ireland (Map 15.1).
For men, the relative risk was higher in a wide band across the country extending from Sligo to Wexford. The relative risks were lower in the south-west and north (Map 15.2).
For women, there were just two areas of higher relative risk, along the north coast (from Donegal in RoI to Moyle/Larne in NI) and in the area from Louth to Wicklow, while the west had lower relative risks (Map 15.3).
Map 15.1 Kidney cancer, smoothed relative risks: both sexes
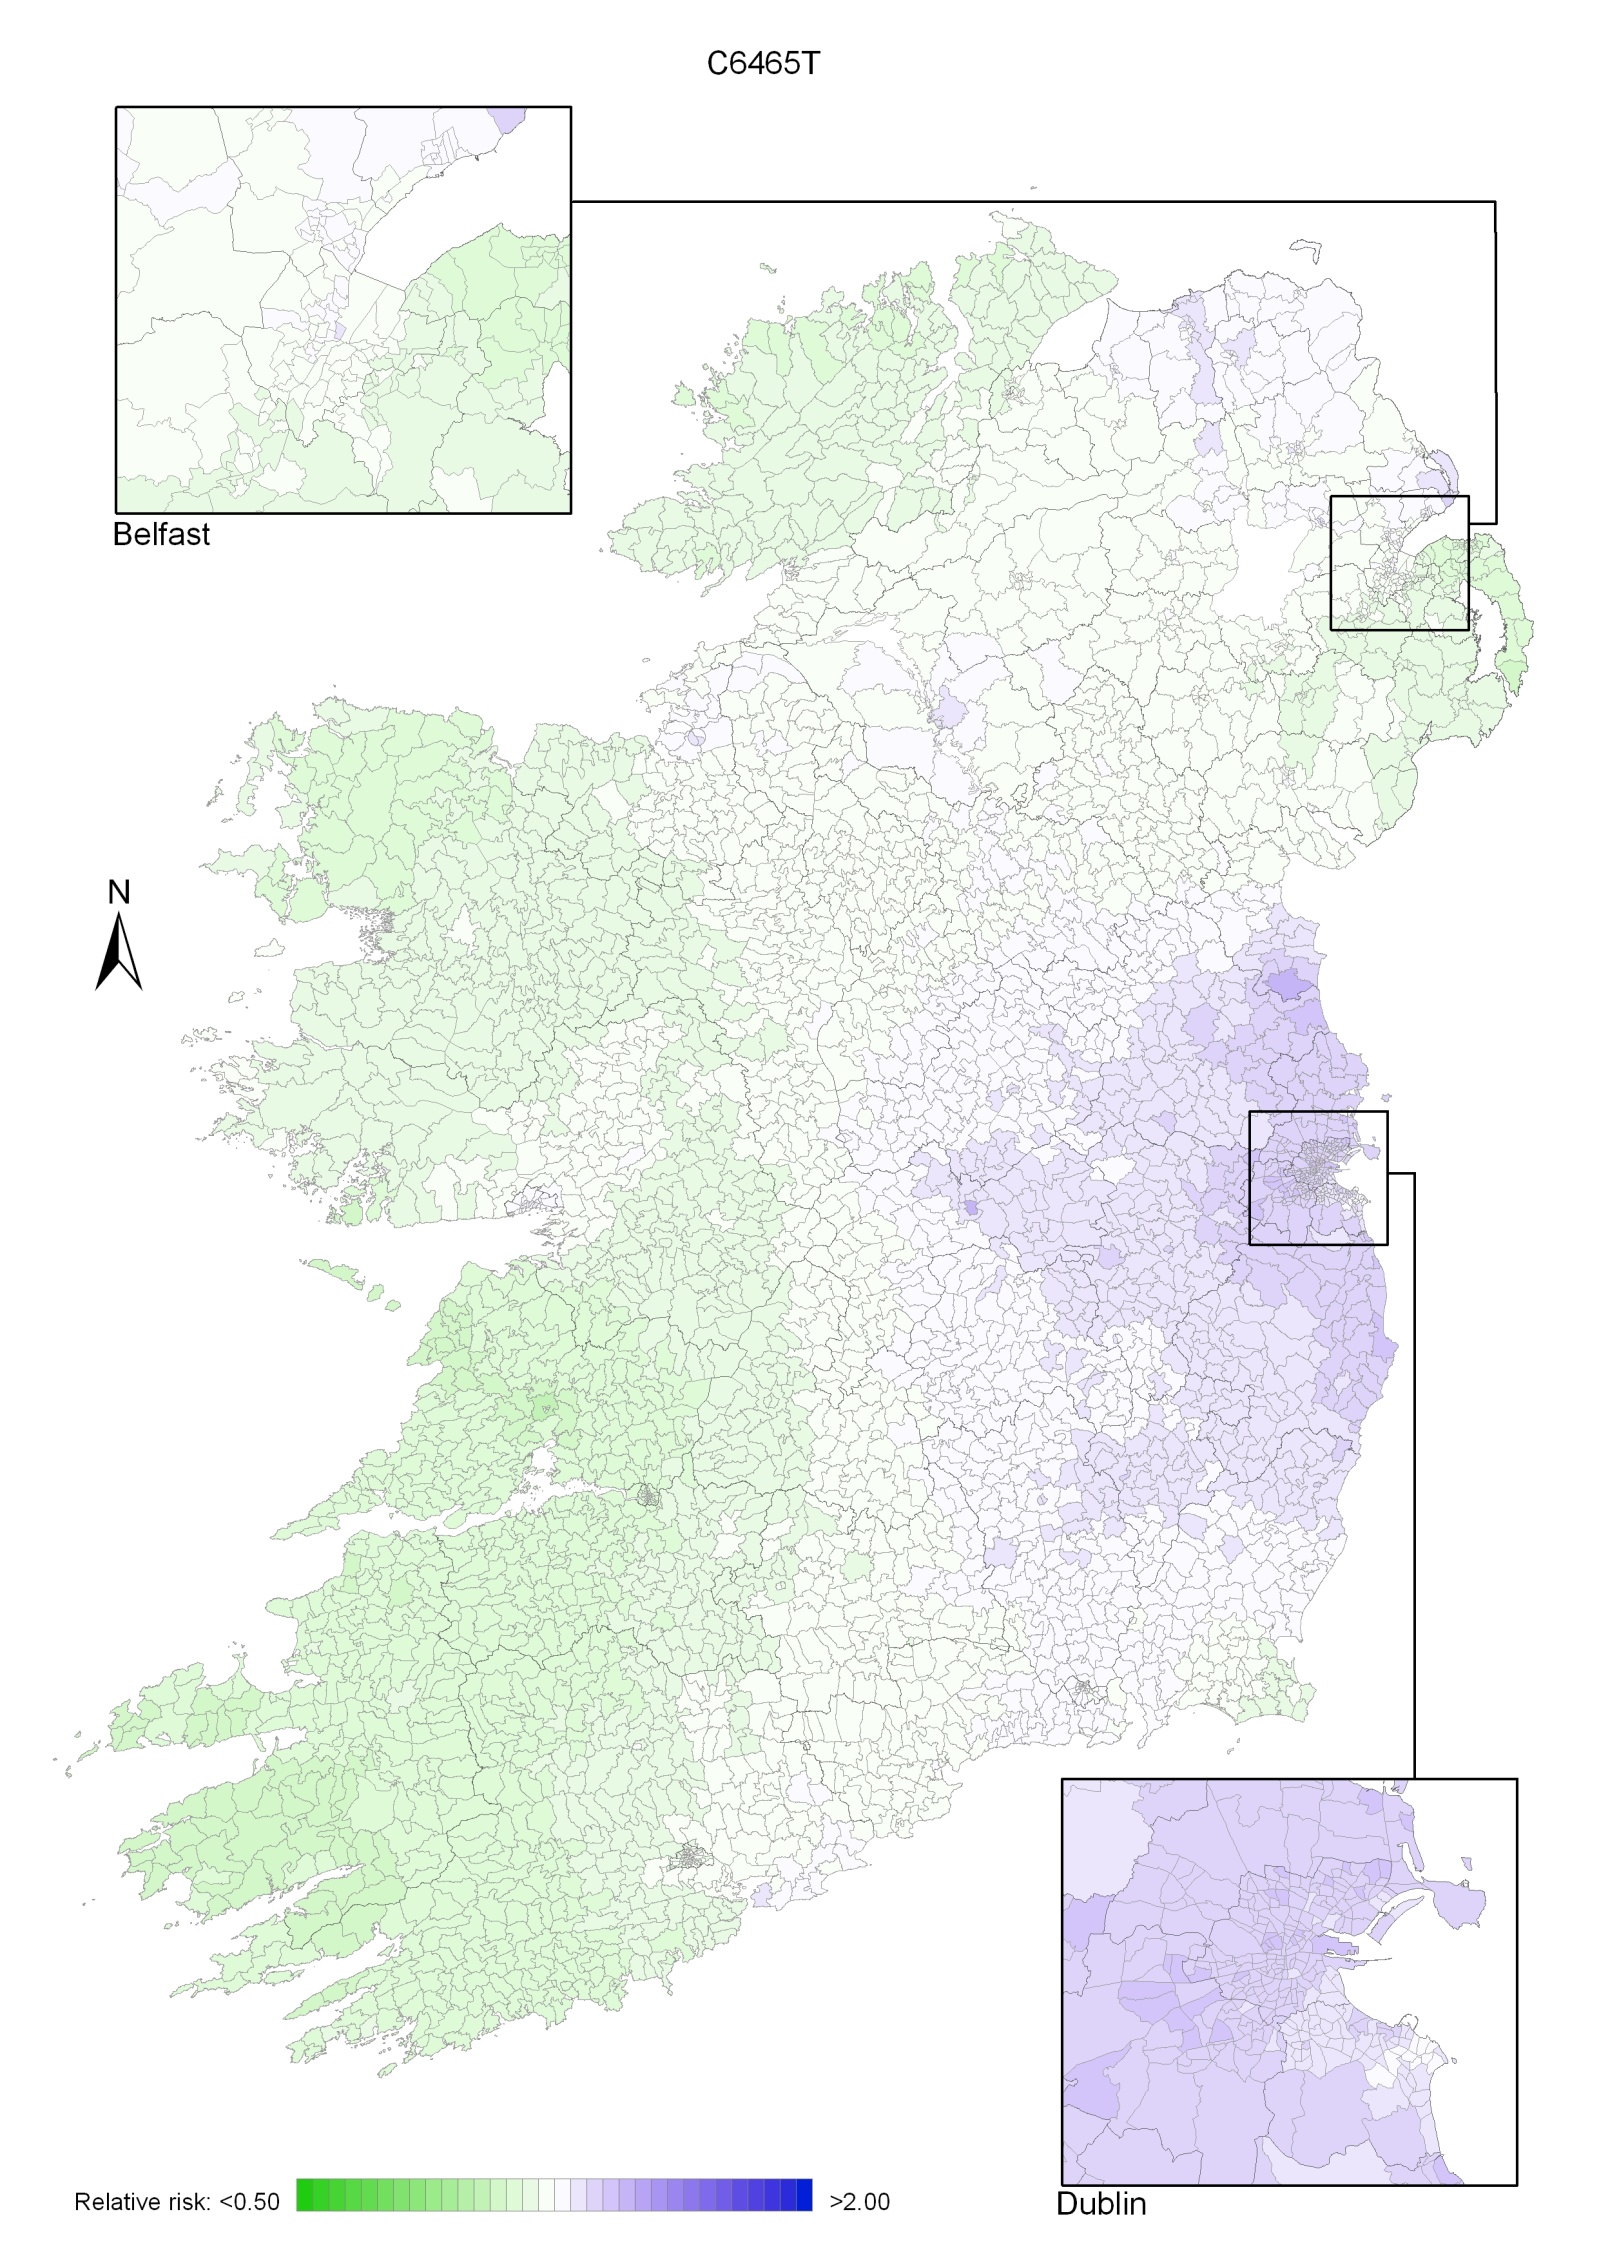
Map 15.2 Kidney cancer, smoothed relative risks: males
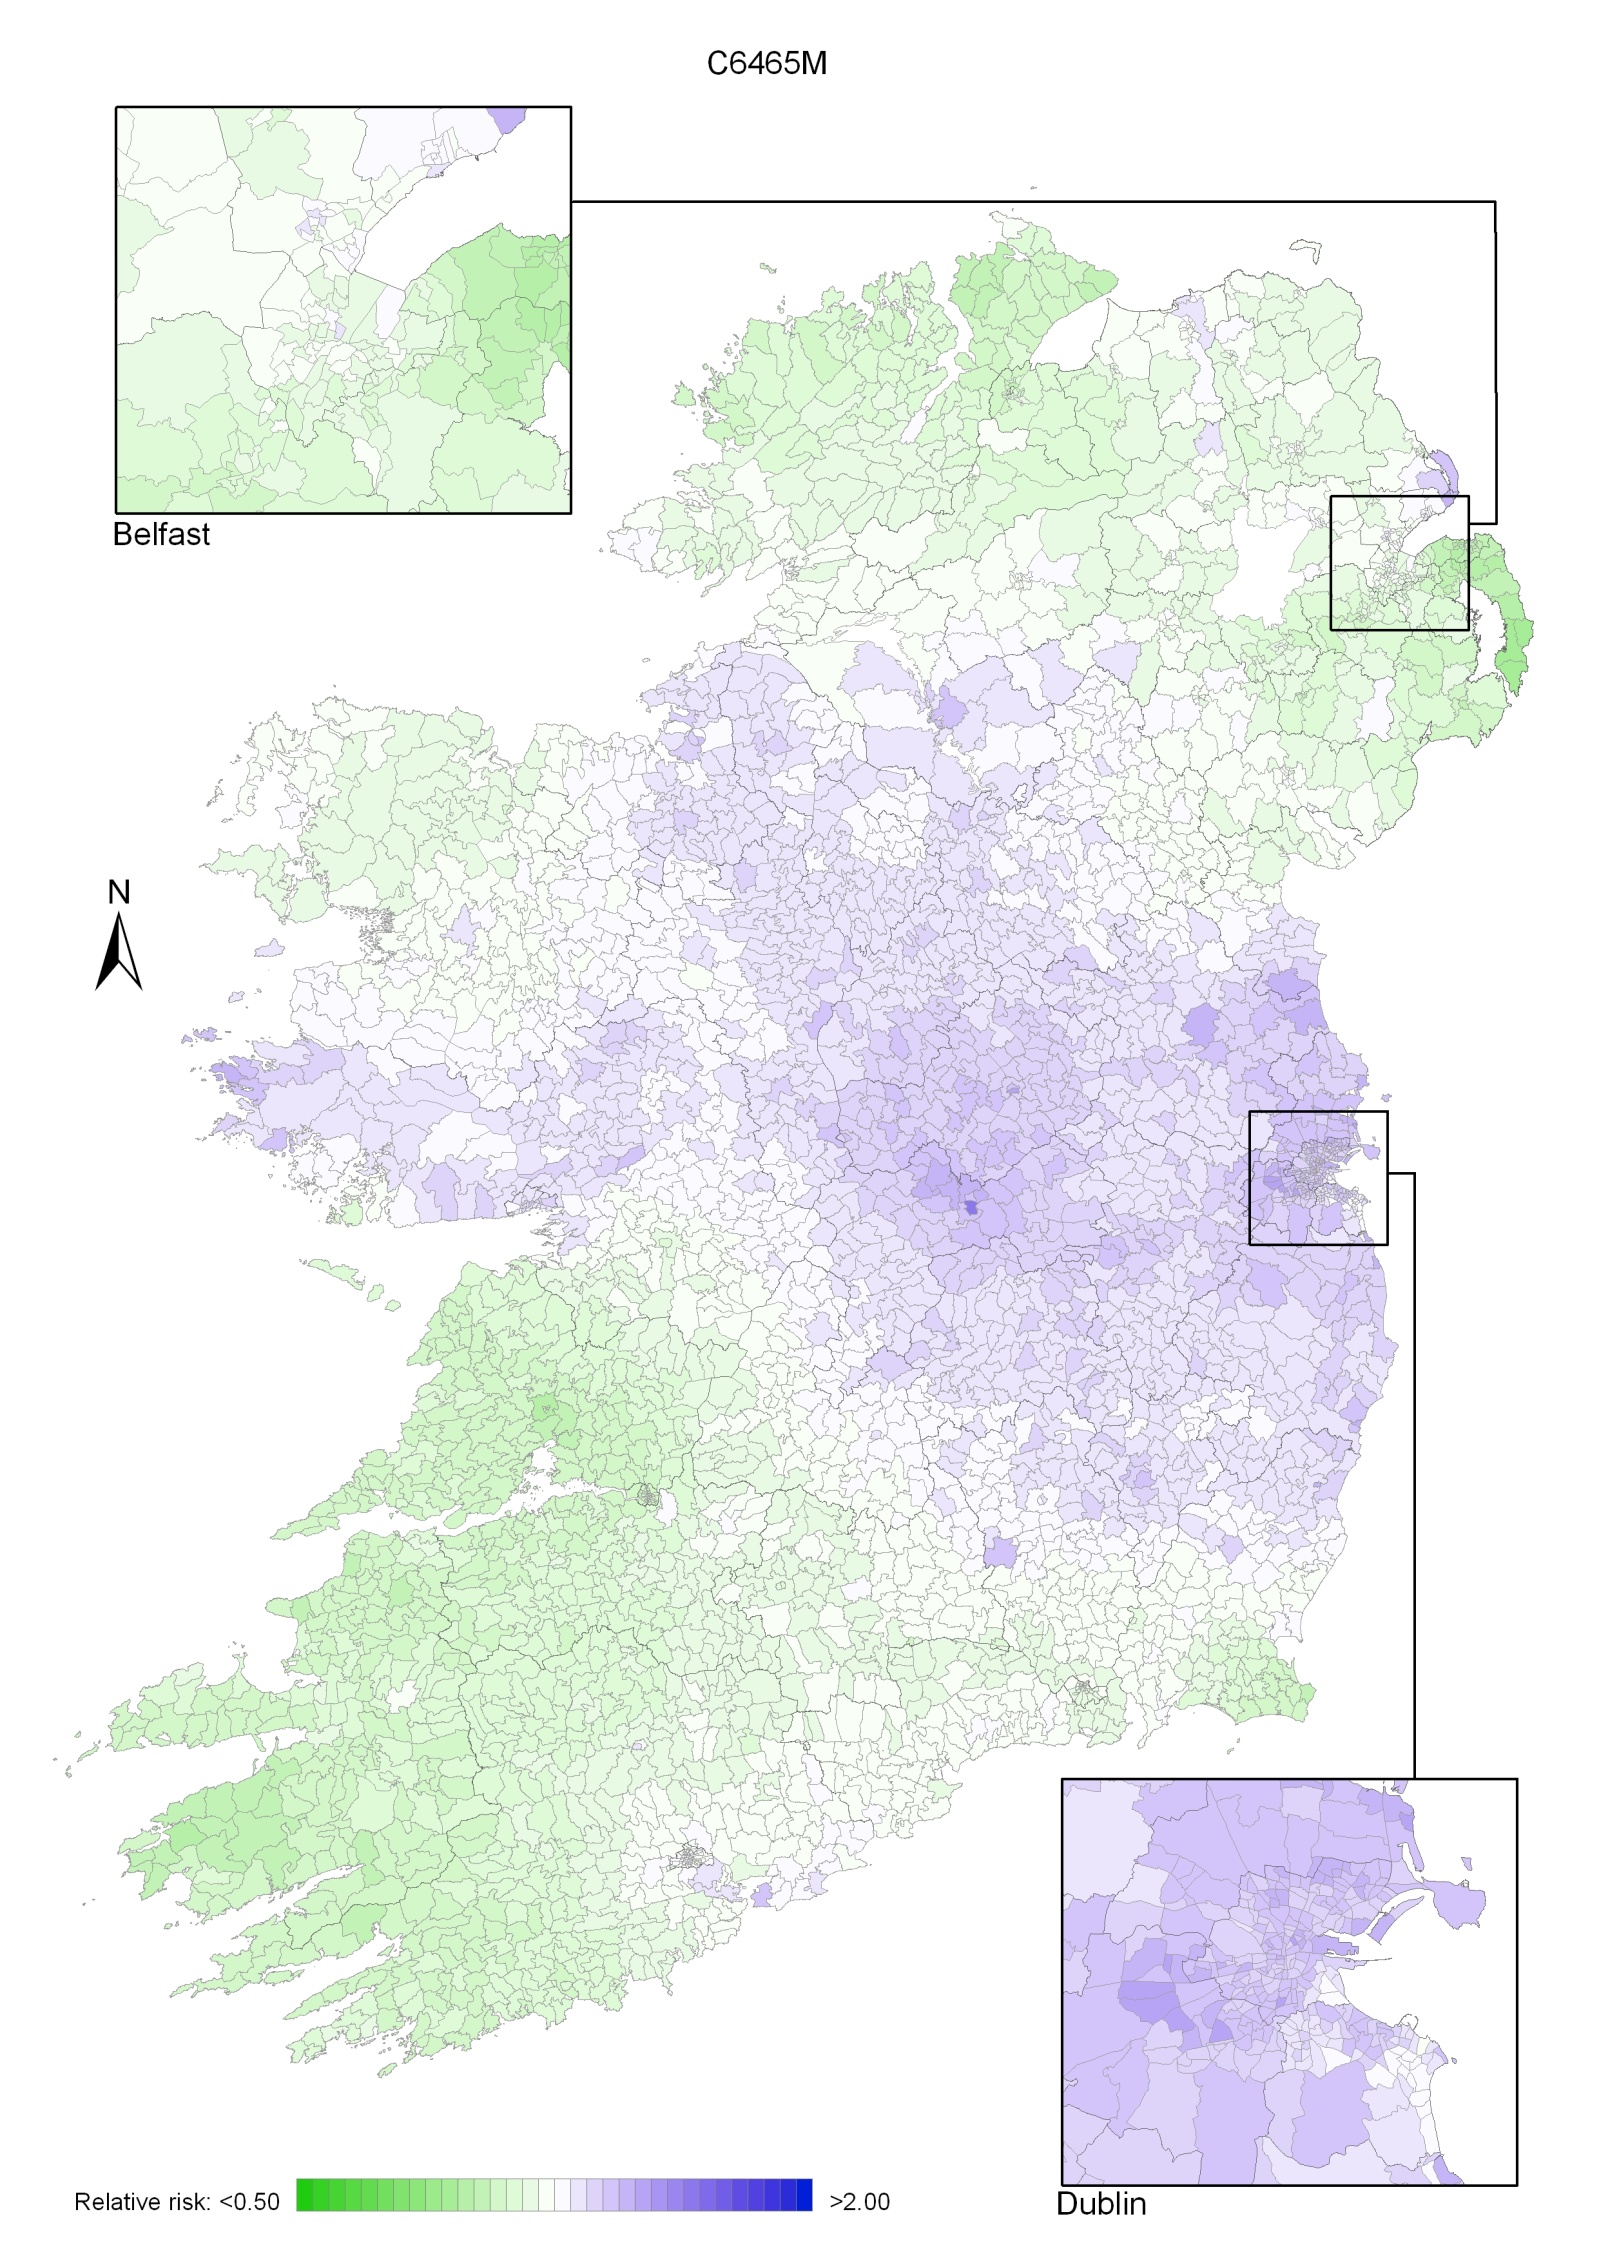
Map 15.3 Kidney cancer, smoothed relative risks: females
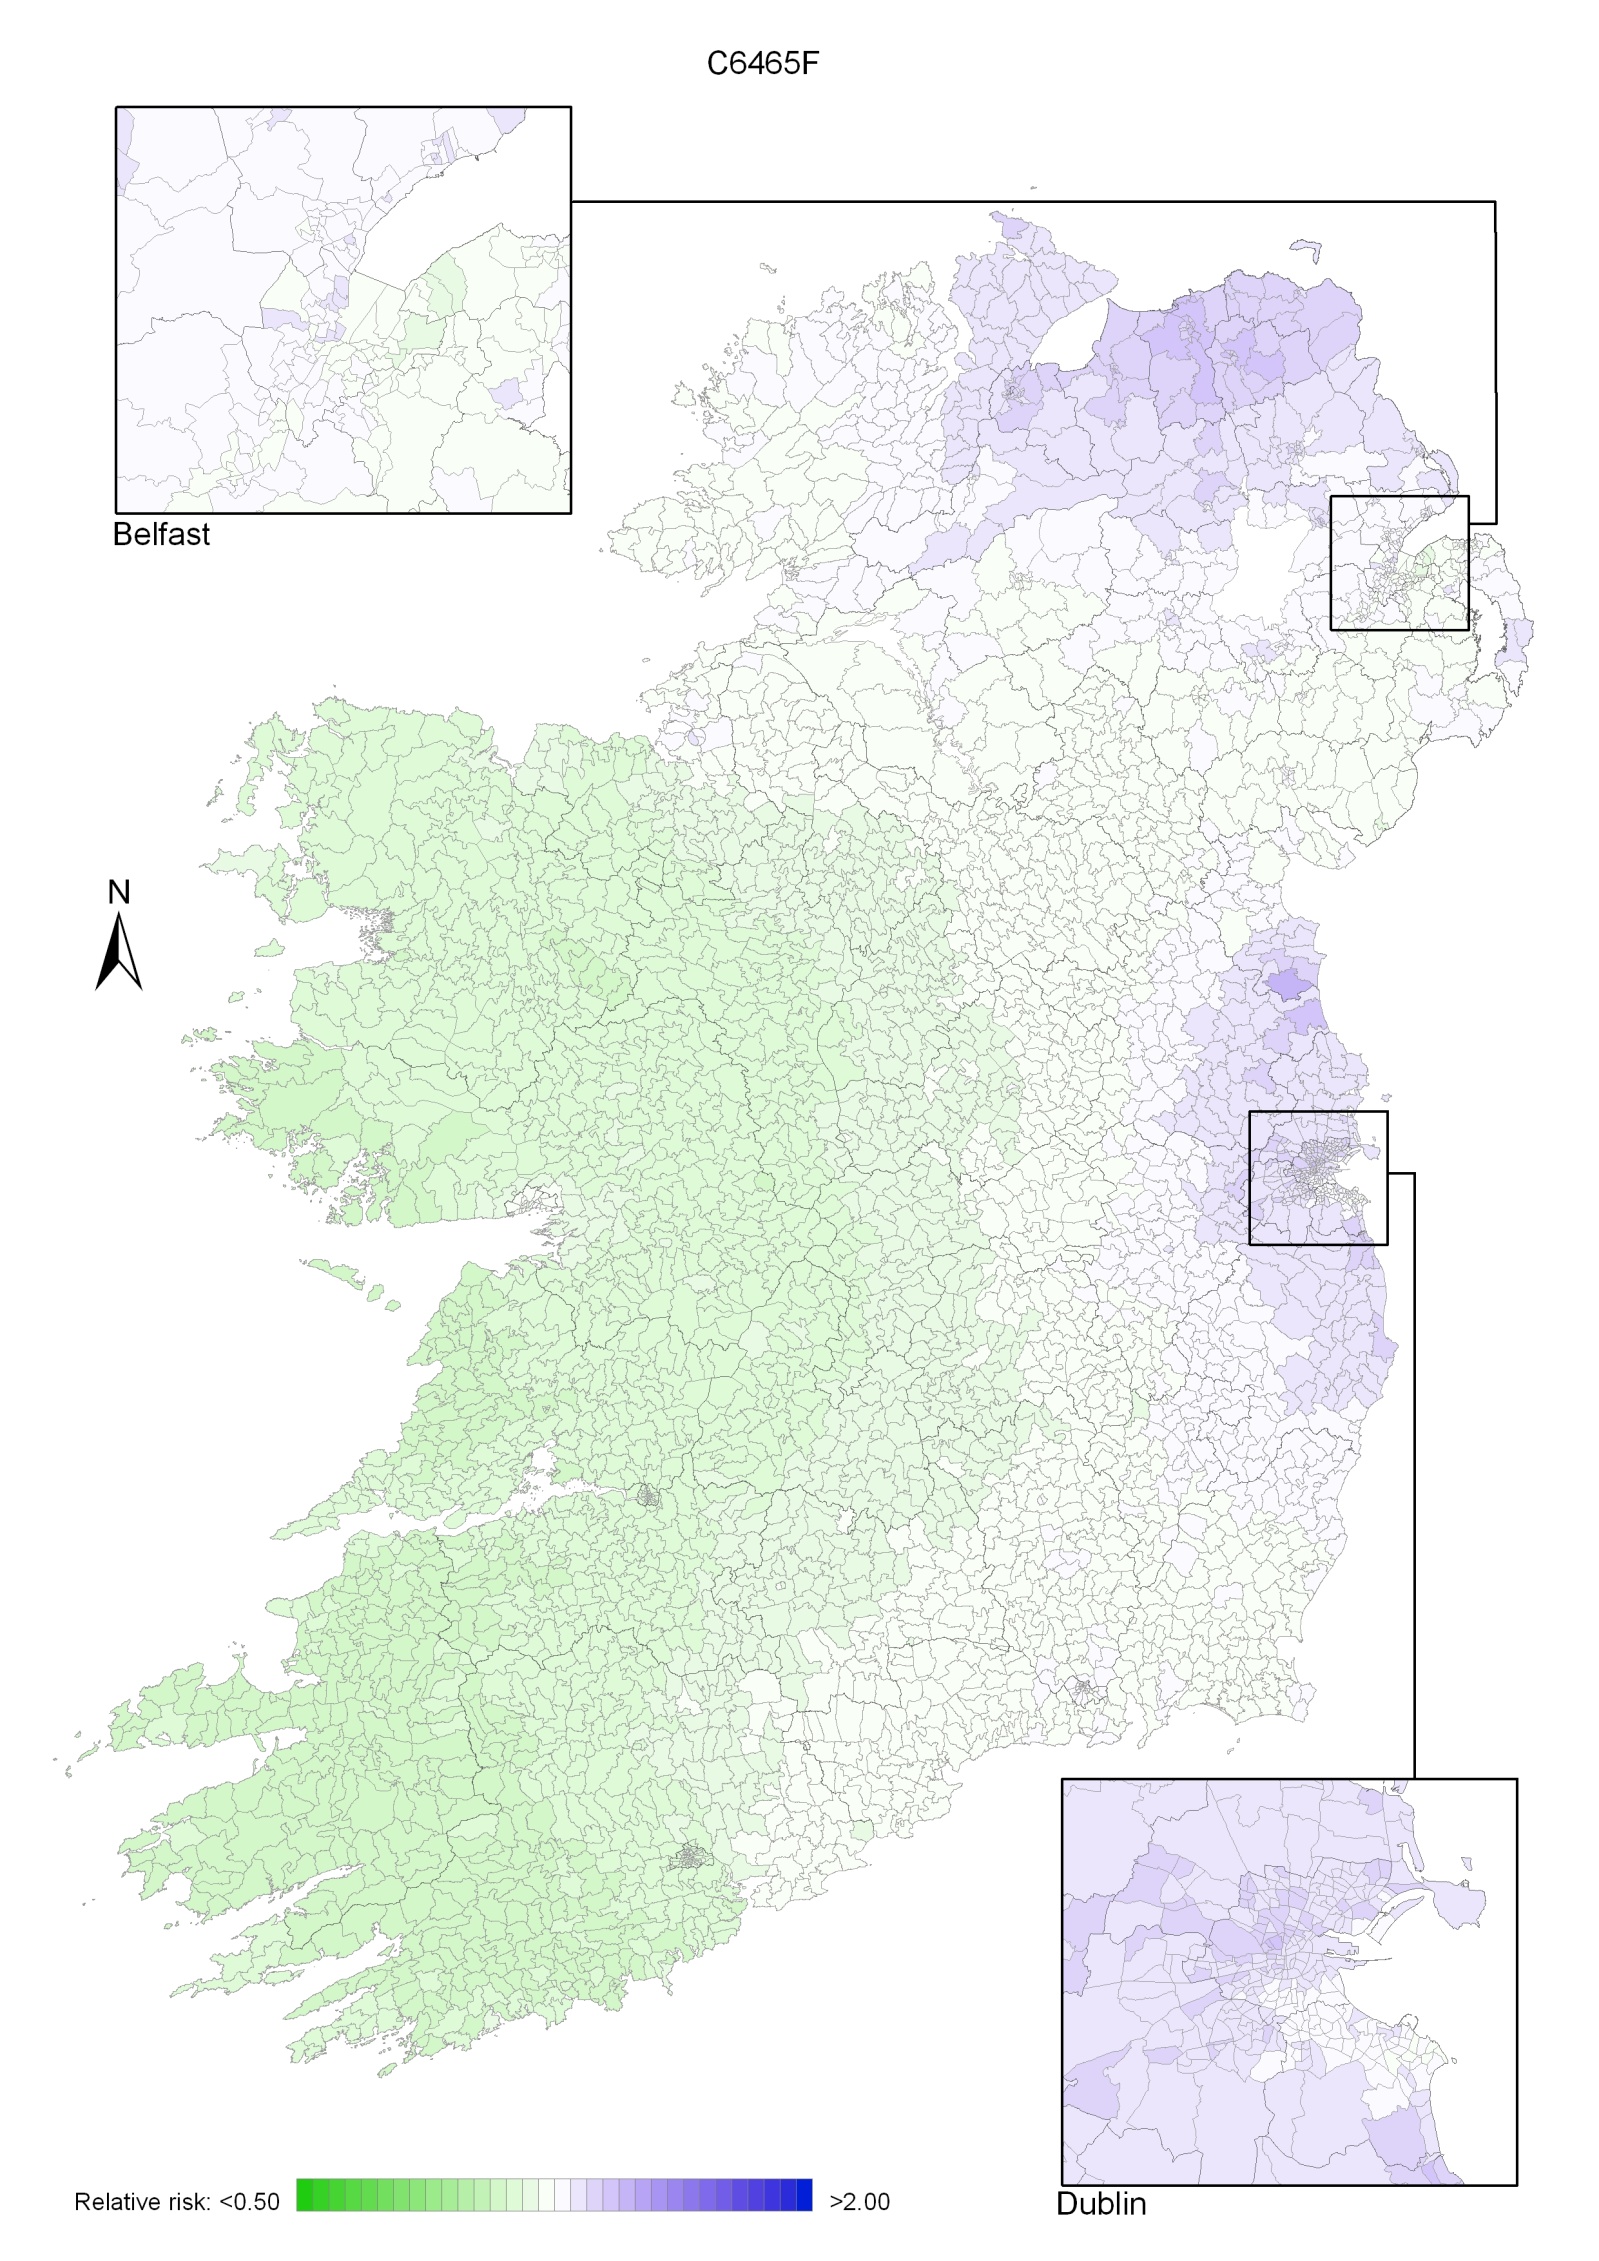
Oesophageal cancer was the thirteenth most common cancer in Ireland, accounting for 1.8% of all malignant neoplasms, excluding non-melanoma skin cancer, in women and 2.7% in men (Table 16.1). The average number of new cases diagnosed each year was 182 in women and 301 in men. During 1995-2007, the number of new cases diagnosed increased by approximately 2% per annum.
The risk of developing oesophageal cancer up to the age of 74 was 1 in 258 for women and 1 in 105 for men and was similar in NI and RoI. At the end of 2008, 118 women and 278 men aged under 65, and 308 women and 423 men aged 65 and over, were alive up to 15 years after their oesophageal cancer diagnosis.
Table 16.1 Summary information for oesophageal cancer in Ireland, 1995-2007
Ireland | RoI | NI | ||||
female | male | female | male | female | male | |
% of all new cancer cases | 1.3% | 2.0% | 1.3% | 1.9% | 1.3% | 2.2% |
% of all new cancer cases excluding non-melanoma skin cancer | 1.8% | 2.7% | 1.8% | 2.7% | 1.7% | 2.9% |
average number of new cases per year | 182 | 301 | 122 | 202 | 60 | 98 |
cumulative risk to age 74 | 0.4% | 1.0% | 0.4% | 0.9% | 0.4% | 1.0% |
15-year prevalence (1994-2008) | 426 | 701 | 289 | 454 | 137 | 247 |
The age distribution at diagnosis was different for men and women (Figure 16.1). More than half of men, but only one-third of women, presented at under 70 years of age, while a further third of women, but only 16% of men, was aged 80 years or older at diagnosis. The pattern was similar in RoI and NI.
Figure 16.1 Age distribution of oesophageal cancer cases in Ireland, 1995-2007, by sex
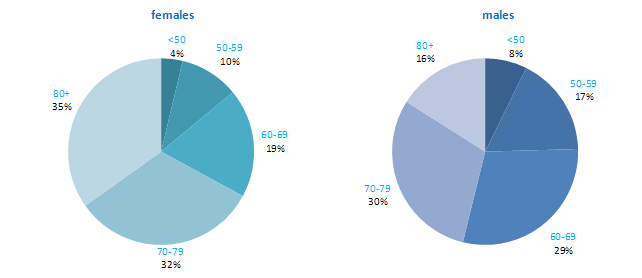
Among developed countries, only the UK had higher rates of oesophageal cancer in women than NI and RoI (Figure 16.2). Among men, NI and RoI also had relatively high rates of the disease, with only UK, Netherlands and Japan having higher rates. The lowest rates were in Sweden and Italy for men and in Austria and Portugal for women.
Figure 16.2 Estimated incidence rate per 100,000 in 2008 for selected developed countries compared to 2005-2007 incidence rate for RoI and NI: oesophageal cancer | |
| females | males |
 | 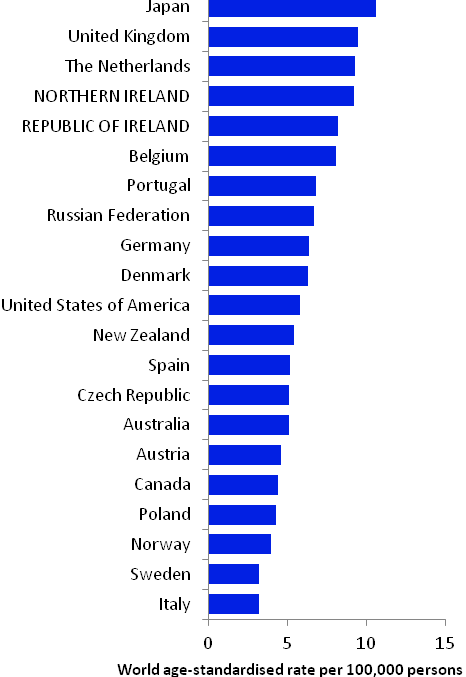 |
Source: GLOBOCAN 2008 (Ferlay et al., 2008) (excluding RoI and NI data, which is derived from Cancer Registry data for 2005-2007) | |
Table 16.2 Risk factors for oesophageal cancer, by direction of association and strength of evidence
| Increases risk | Decreases risk |
Convincing or probable | Tobacco smoking1,2,3 | Non-starchy vegetables6,14 |
| Smokeless tobacco3,4 | Fruit6,14 |
| Alcohol3,5 | Foods containing beta-carotene6,15 |
| Greater body fatness/higher body mass index6 | Foods containing vitamin C6,16 |
| Gastro-oesophageal reflux disease7 | Helicobacter pylori infection17,18 |
| Low socio-economic status8 | Aspirin and other non-steroidal anti-inflammatory drugs19,20 |
Possible | Red meat6 | Gastric atrophy (adenocarcinoma)13 |
| Processed meat6 | |
| Pickled vegetables9 | |
| High temperature drinks10 | |
Infection with human papilloma viruses (HPV)11 | ||
Occupational exposure to hexavalent chromium12 | ||
Gastric atrophy (squamous cell carcinoma)13 | ||
1 International Agency for Research on Cancer, 2004b; 2 Boffetta et al., 2008; 3 Secretan et al., 2009; 4 chewing tobacco or snuff; 5 Islami et al., 2010; 6 World Cancer Research Fund / American Institute for Cancer Research, 2007; 7 Pera et al., 2005; 8 Faggiano et al., 1997; 9 Islami et al. 2009a; 10 Islami et al., 2009b; 11 International Agency for Research on Cancer, 2007; 12 Gatto et al., 2010; 13 Islami et al., 2011; 14 International Agency for Research on Cancer, 2003; 15 beta-carotene is found in yellow, orange and green fruits and green leafy vegetables; 16 vitamin C is found in fruit, vegetables and tubers;17 Islami and Kamangar, 2008; 18 Rokkas et al., 2007; 19 Bosetti et al., 2006; 20 Abnet et al., 2009 | ||
The two main types of oesophageal cancer are squamous cell carcinoma and adenocarcinoma. Some risk factors are shared by both types, while others are involved in one type only. Tobacco smoking causes both squamous cell carcinoma and adenocarcinoma of the oesophagus (Table 16.2). Smokers have at least a two-fold higher risk than non-smokers and risk increases with number of cigarettes smoked daily and duration of smoking. Use of smokeless tobacco products (e.g. snuff, chewing tobacco) is also associated with increased disease risk. Alcohol is also causally related to oesophageal cancer and risk increases with amount consumed.
Obesity and overweight are positively associated with adenocarcinoma. In contrast, higher levels of body fatness are either unrelated to risk of squamous cell carcinoma, or associated with a decreased risk (Smith et al., 2008). A history of gastro-oesophageal reflux disease has been associated with increased risk of adenocarcinoma, but not of squamous cell carcinoma. Gastric atrophy may be positively associated with squamous cell carcinomas and negatively associated with adenocarcinoma. Infection with the Helicobacter pylori (H pylori) bacterium has been associated with reduced risk of adenocarcinoma, while infection with human papilloma virus may play a role in squamous cell carcinoma.
Various aspects of diet have been linked with oesophageal cancer risk. Higher intakes of fruit and vegetables, particularly those containing beta-carotene (yellow, orange and green fruits and green leafy vegetables) or vitamin C, probably reduce risk. Higher intakes of red or processed meat may increase risk, but the evidence is less consistent than for fruit and vegetables. Risk may also be increased in those with higher intakes of pickled vegetables, and those who prefer to consume their hot drinks at a high temperature.
Risk of oesophageal cancer is higher in those of low socio-economic status, probably reflecting variations in exposure to tobacco and other lifestyle risk factors by social class.
Figure 16.3 Adjusted relative risks (with 95% confidence intervals) of oesophageal cancer by socio-economic characteristics of geographic area of residence: males | MalesThere was little difference between NI and RoI with regard to risk of male oesophageal cancer, either with or without adjustments for socio-economic factors and population density (Figure 16.3). Risk of oesophageal cancer increased with increasing population density, with the most densely populated areas having a 21% increased risk compared to the least densely populated areas. Neither education nor unemployment was associated with male oesophageal cancer overall. However, men resident in quintile 4 of the unemployment measure had a slightly (15%) elevated risk of the disease. Oesophageal cancer risk was highest (21% above the risk for Q1) in areas with a high proportion of elderly people living alone. |
Figure 16.4 Adjusted relative risks (with 95% confidence intervals) of oesophageal cancer by socio-economic characteristics of geographic area of residence: females
| FemalesThe risk of oesophageal cancer in women was lower in NI than in RoI (RR=0.92, 95%CI=0.84-1.00) (Figure 16.4). Adjusting for differences in socio-economic and population density characteristics in the two countries increased this difference (RR=0.86, 95%CI=0.78-0.95). As with men, the risk of oesophageal cancer among women increased with increasing population density, with the highest density areas having a 21% increased risk compared to the lowest density areas. There was no association between either education or unemployment overall and female oesophageal cancer. However, as for men, an increased risk was identified in areas with a high proportion of elderly people living alone. |
Oesophageal cancer had a strong geographical pattern, which was similar for men and women. For both sexes combined there was a large area of higher relative risk extending south of a line from west Cork to Dublin with smaller areas of higher risk in Belfast, Carrickfergus, Larne and Ards. Areas in the west and north-west had a lower relative risk (Map 16.1).
The area of higher relative risk for men was slightly smaller and more diffuse, extending north-eastwards from Cork to the north-east of NI Antrim (including Belfast) and including most of the east of RoI with the exception of the area around Wexford (Map 16.2).
For women, the area of higher risk was more pronounced and there were also small areas of higher risk in Larne, Carrickfergus, Ards, along the Ards Peninsula (Map 16.3).
Map 16.1 Oesophageal cancer, smoothed relative risks: both sexes
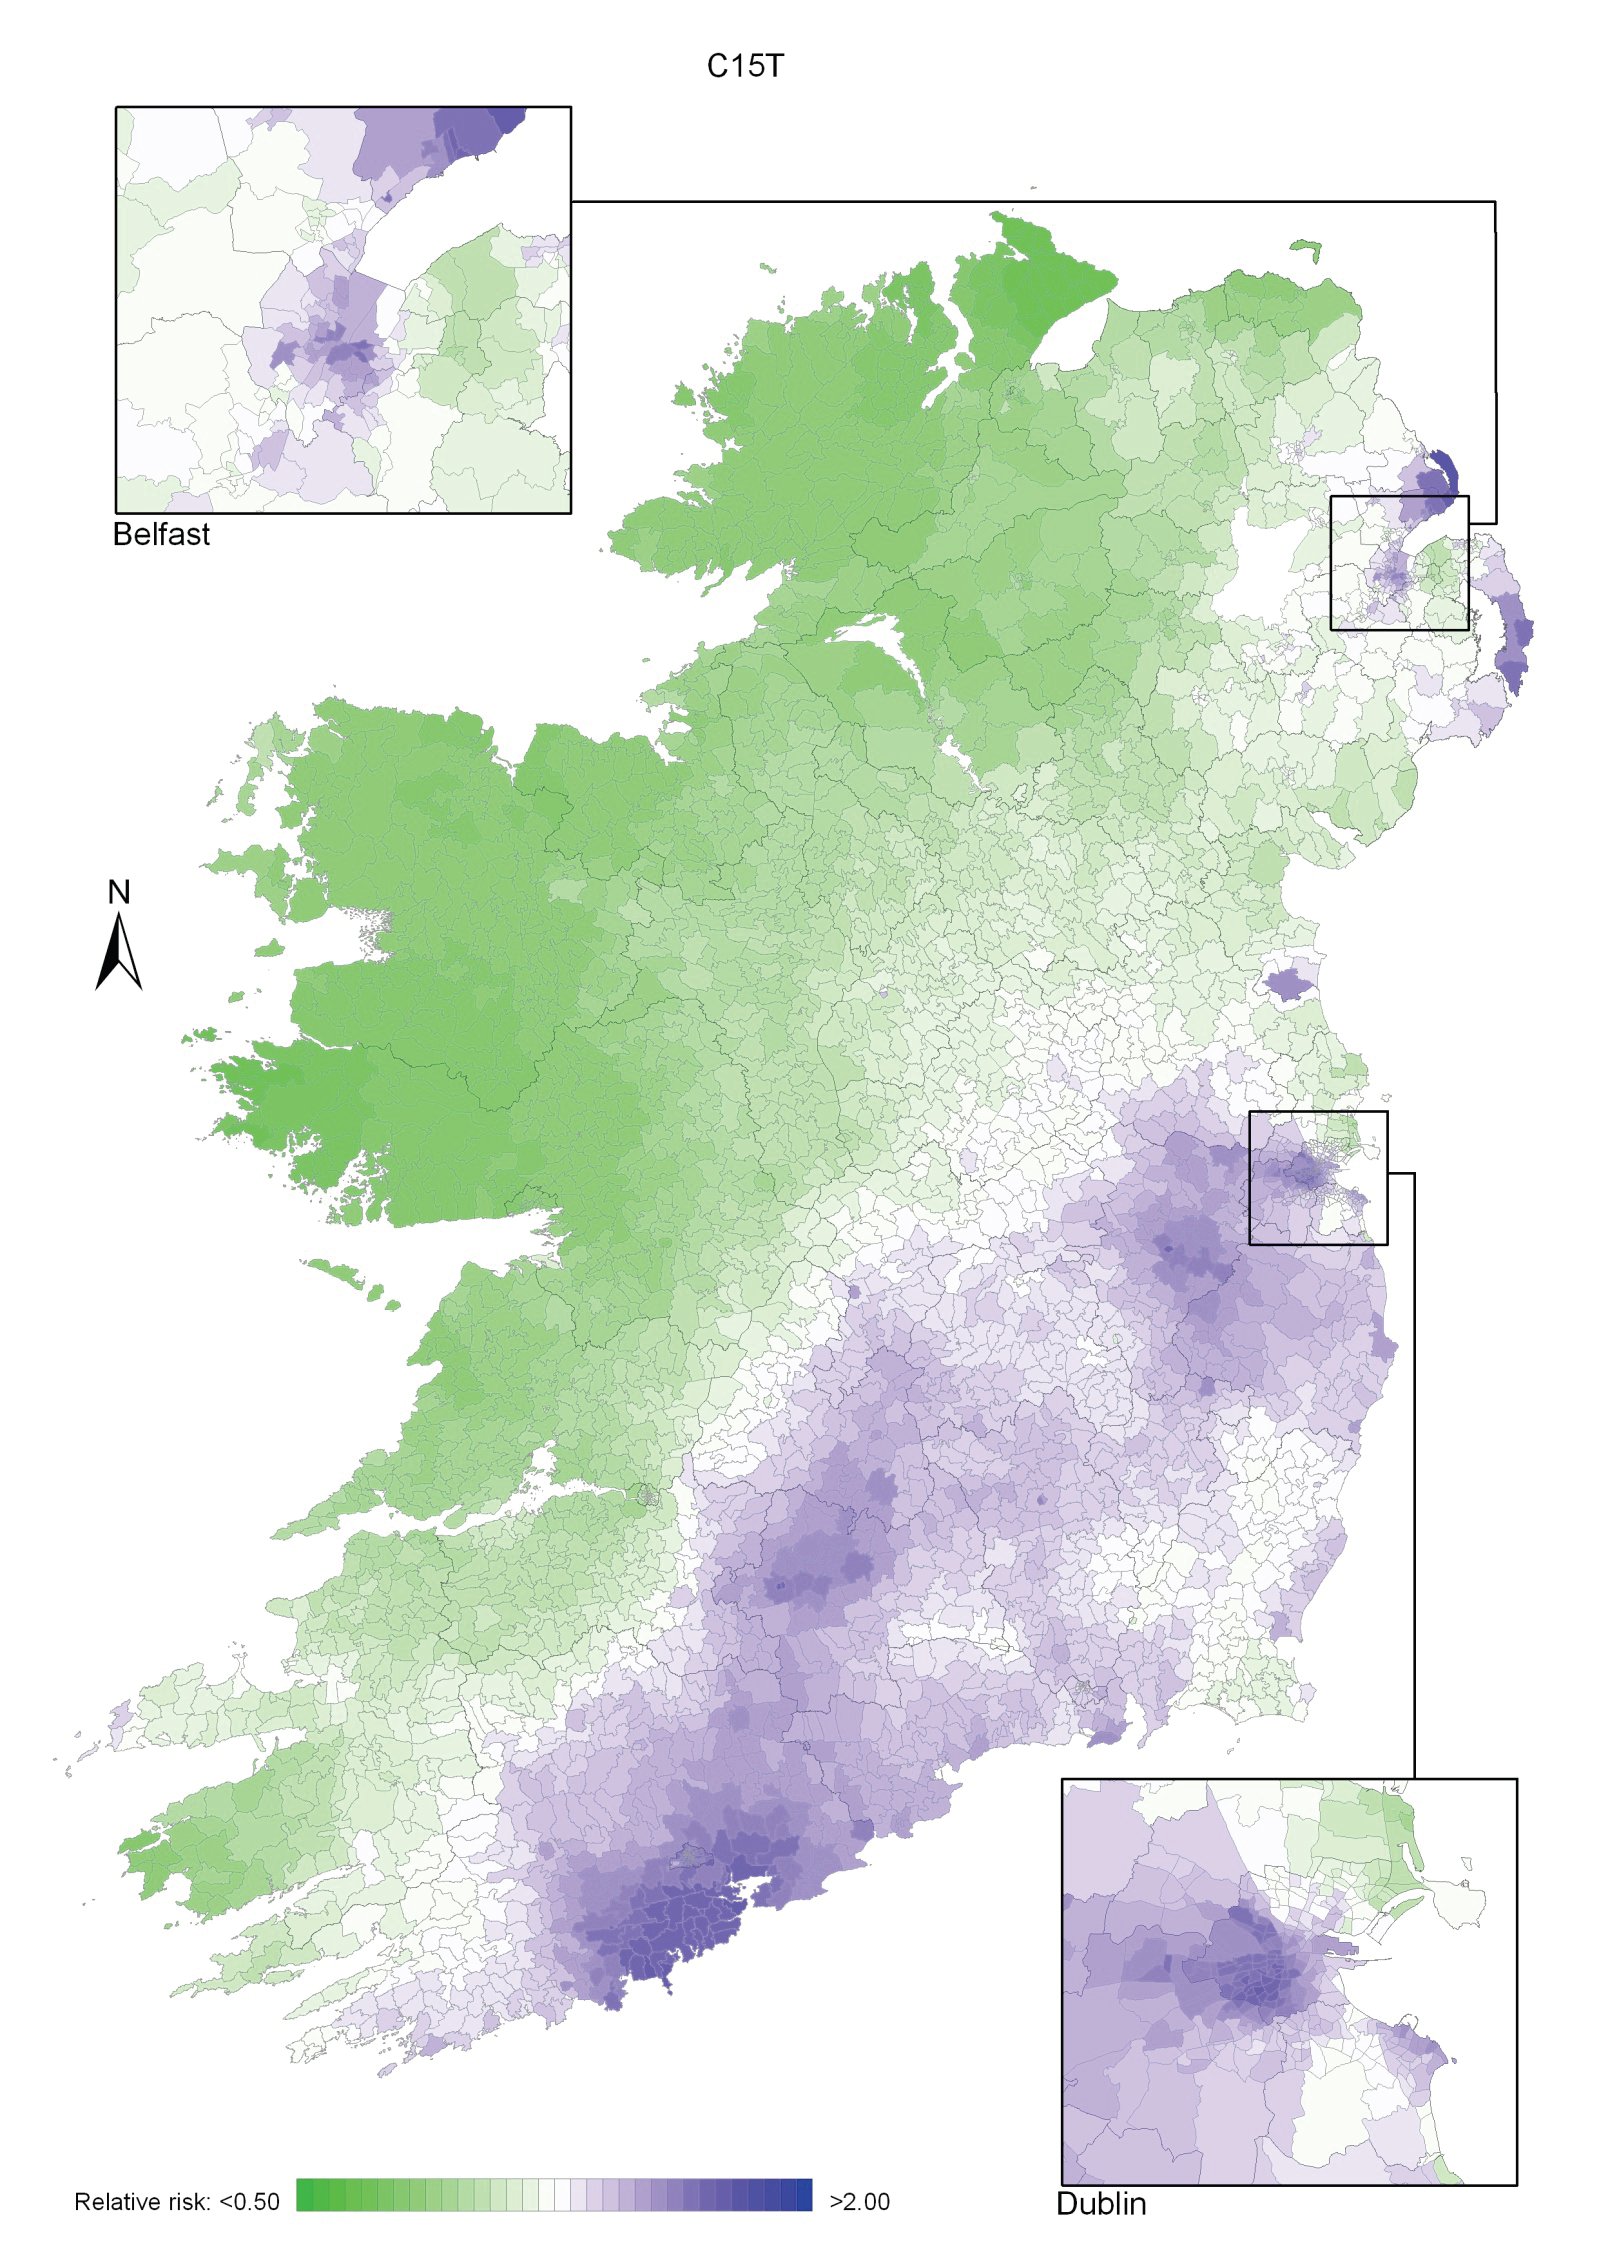
Map 16.2 Oesophageal cancer, smoothed relative risks: males
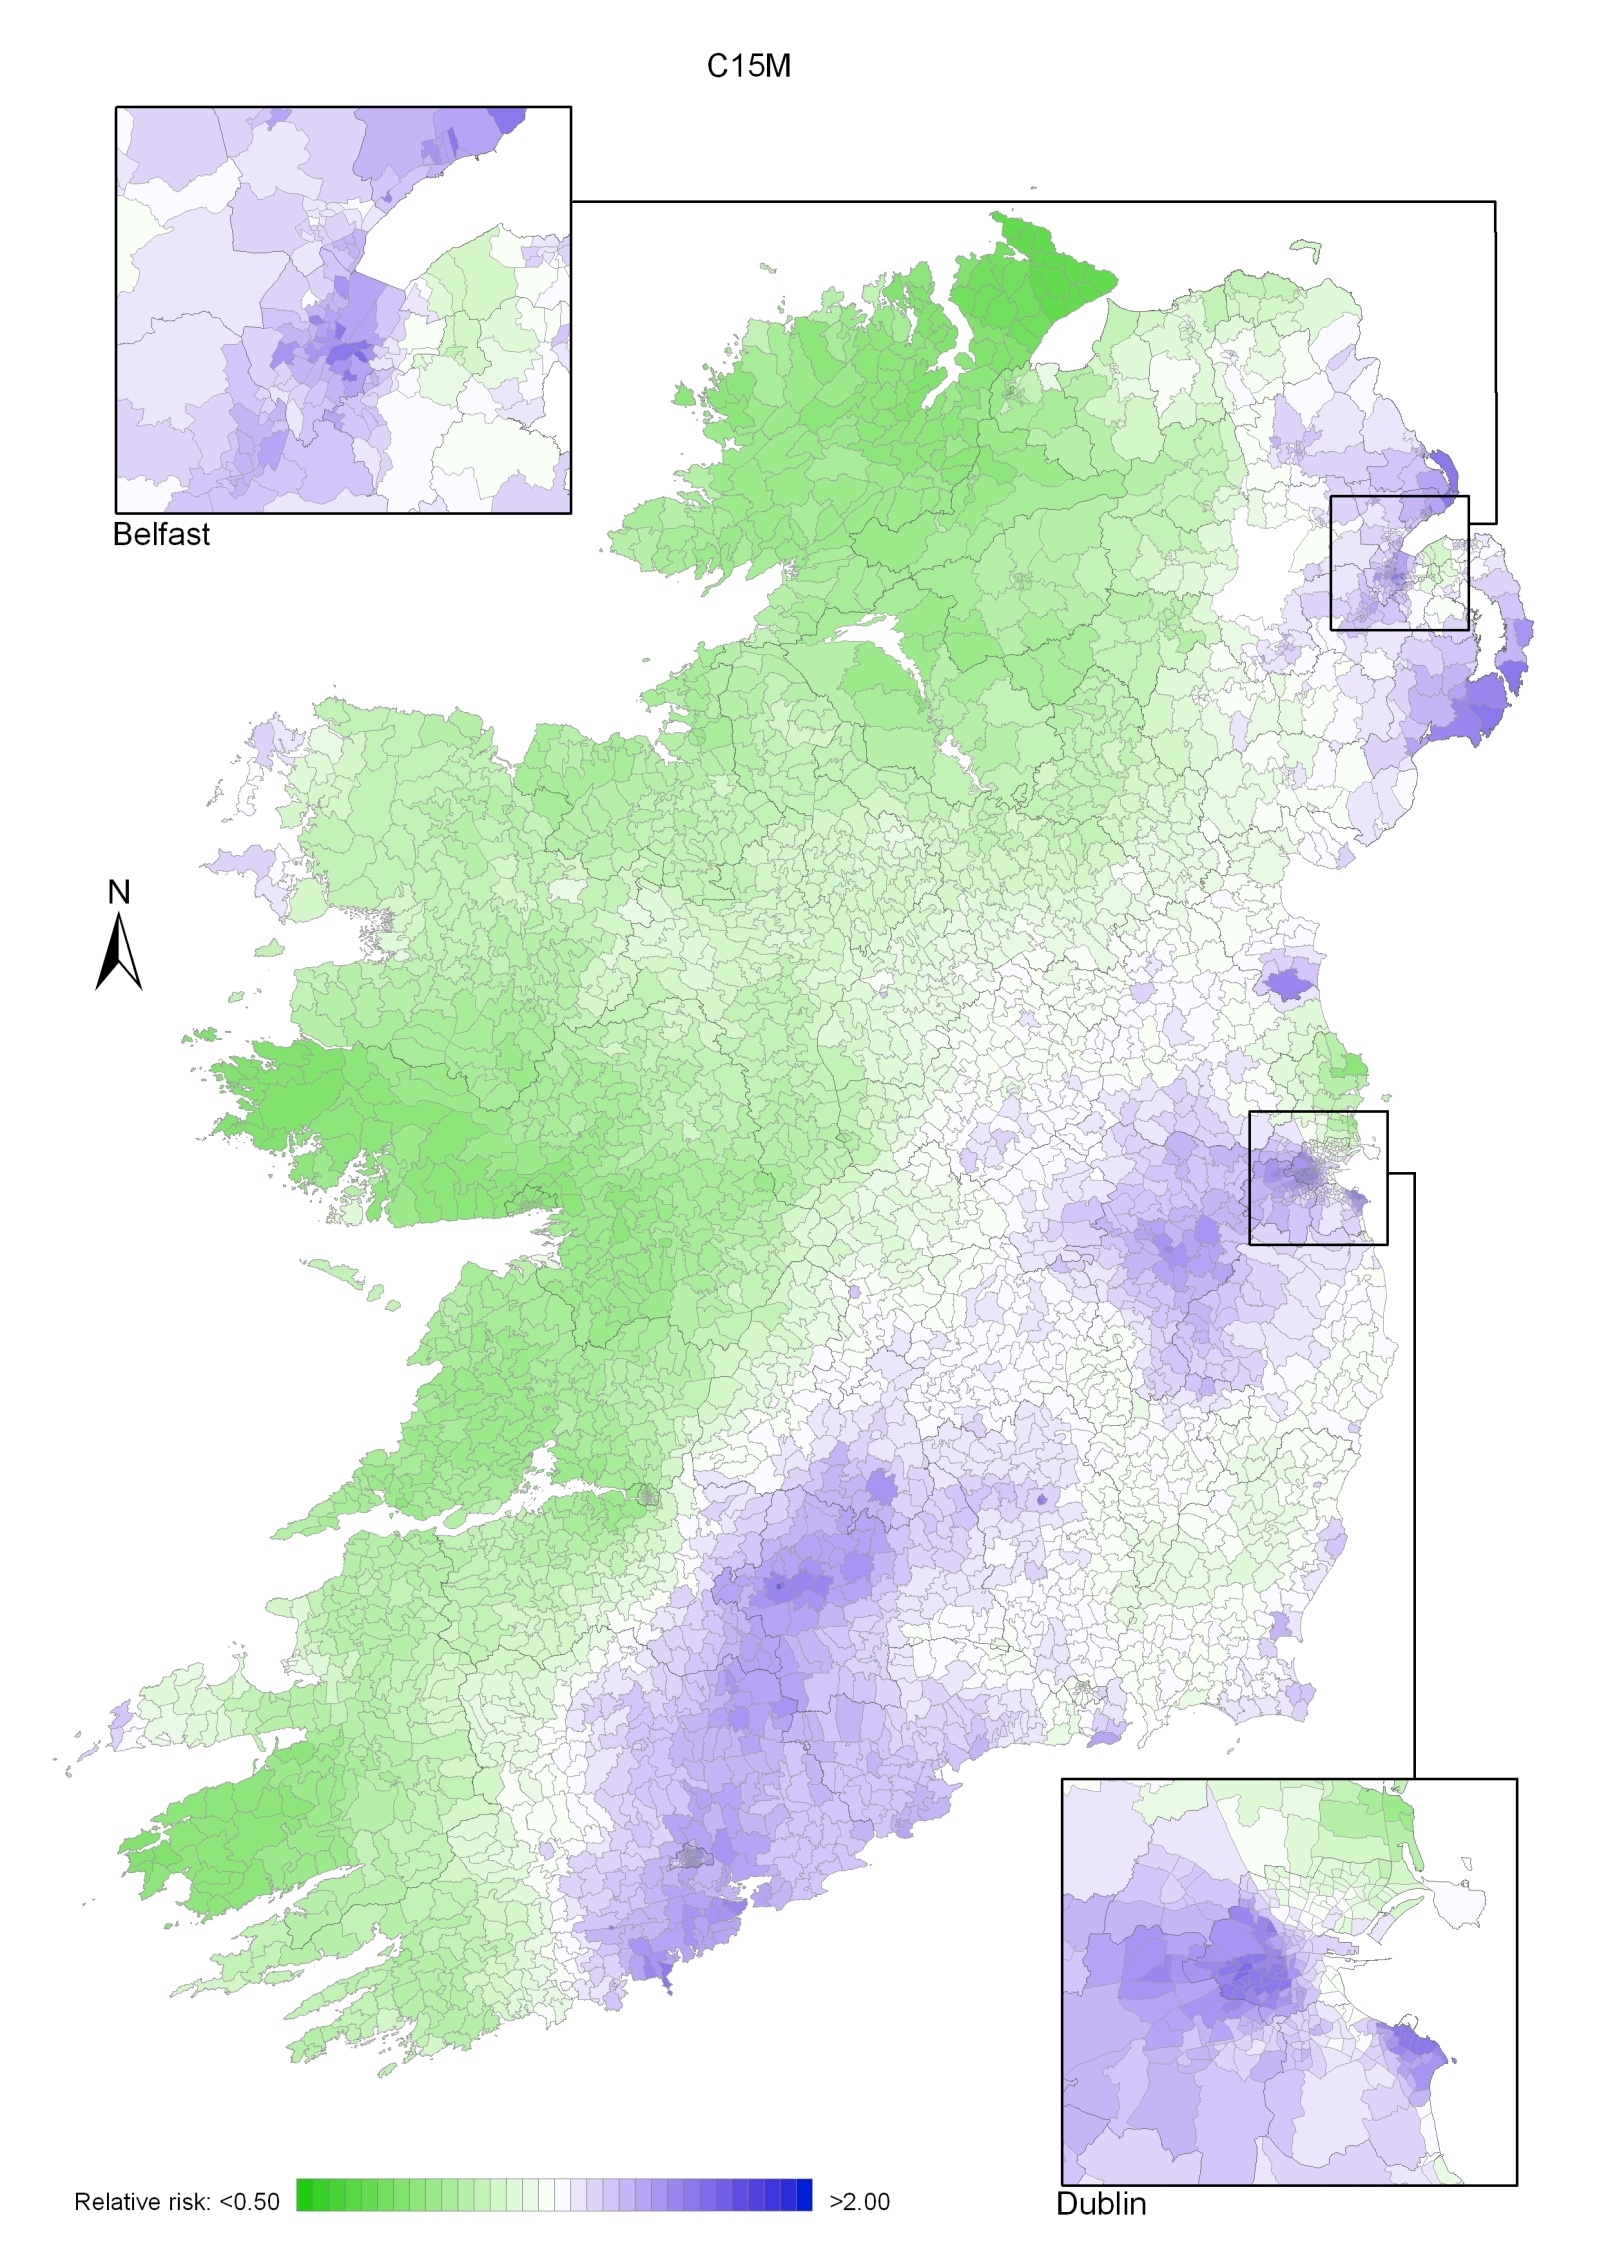
Map 16.3 Oesophageal cancer, smoothed relative risks: females
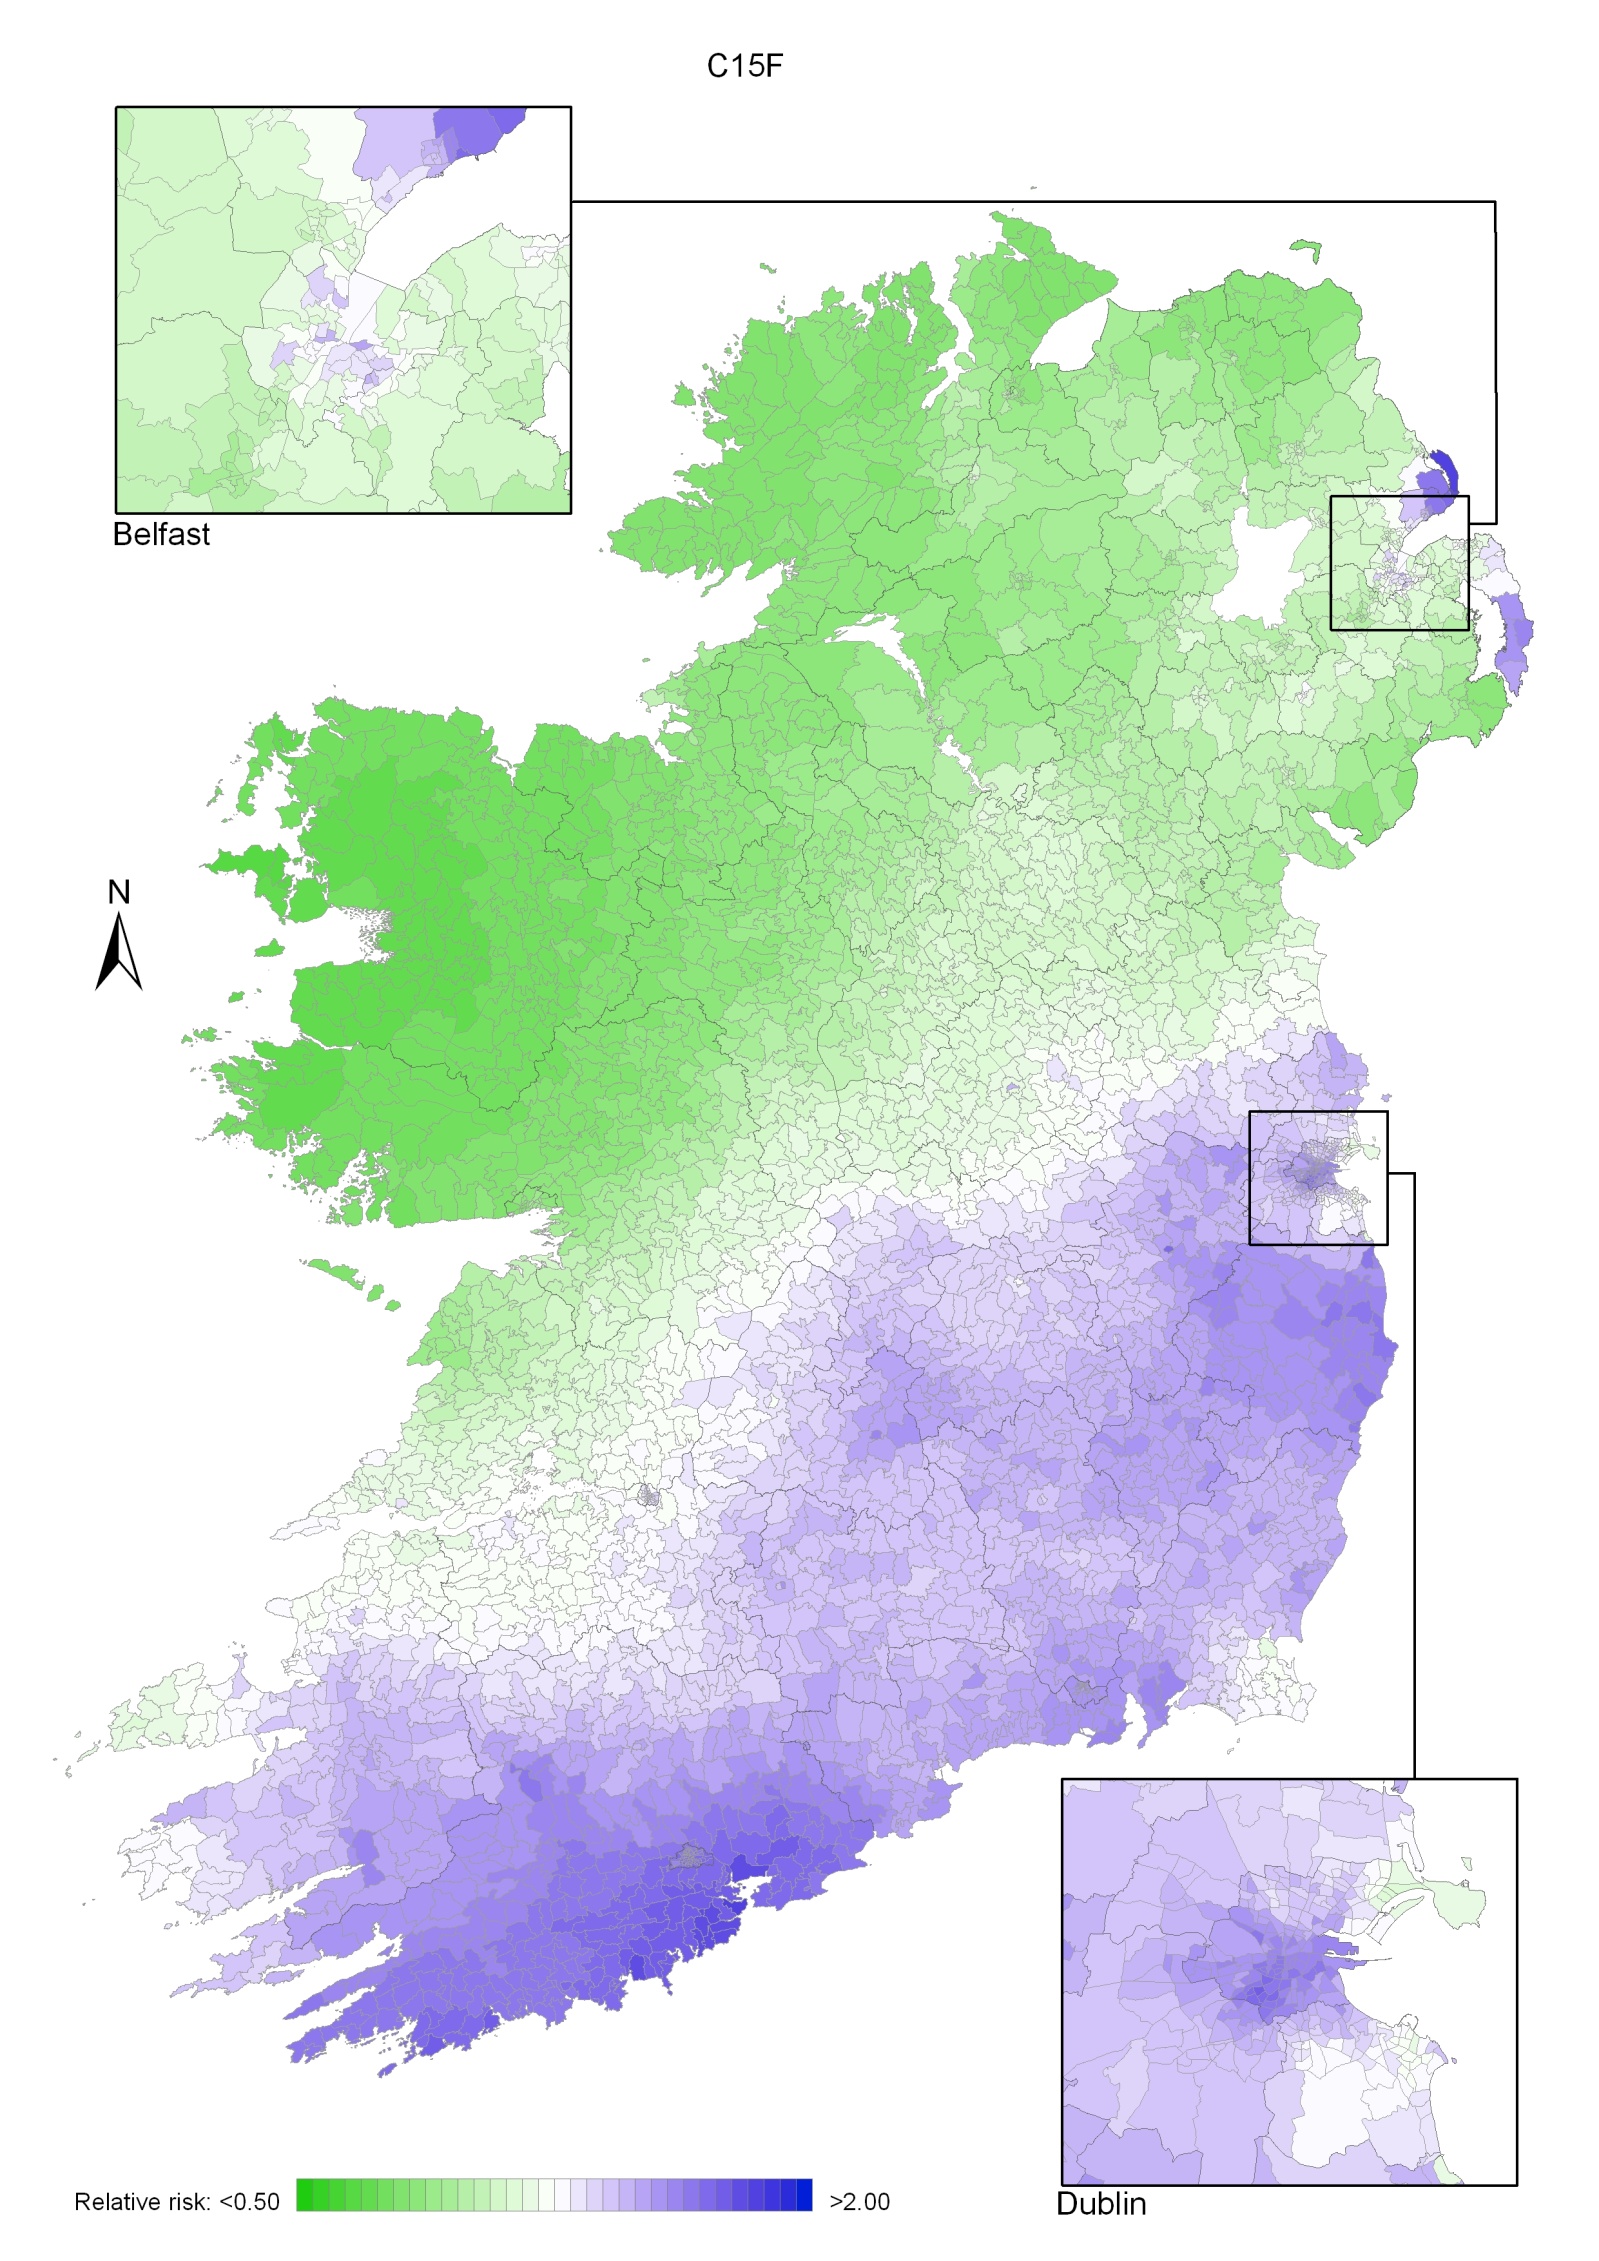
Ovarian cancer was the fourth most common cancer for women in Ireland, accounting for 4.6% of all malignant neoplasms, excluding non-melanoma skin cancer (Table 17.1). The average number of new cases diagnosed each year was 479. During 1995-2007, there was little change in the number of new cases diagnosed per year in RoI while the numbers decreased slightly in NI.
The risk of developing ovarian cancer up to the age of 74 was 1 in 71 and was similar in NI and RoI. At the end of 2008, 1,441 women aged under 65 and 994 women aged 65 and over were alive up to 15 years after their cancer diagnosis.
Table 17.1 Summary information for ovarian cancer in Ireland, 1995-2007
Ireland | RoI | NI | |
% of all new cancer cases | 3.4% | 3.3% | 3.5% |
% of all new cancer cases excluding non-melanoma skin cancer | 4.6% | 4.6% | 4.6% |
average number of new cases per year | 479 | 319 | 159 |
cumulative risk to age 74 | 1.4% | 1.4% | 1.4% |
15-year prevalence (1994-2008) | 2435 | 1564 | 871 |
The age distribution of ovarian cancer at diagnosis was more uniform than for most other cancers (Figure 17.1). Approximately 18% of cases presented under 50 years of age, 21% between 50 and 59, 25% between 60 and 69 and 23% between 70 and 79; the remainder (13%) presented at 80 years or over. There was a similar age pattern in RoI and NI.
Figure 17.1 Age distribution of ovarian cancer cases in Ireland, 1995-2007
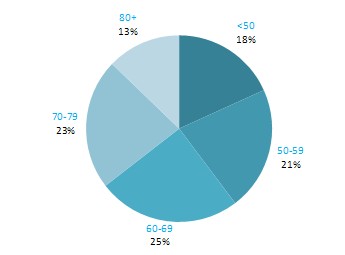
In 2008, estimated rates of ovarian cancer were high in the UK, RoI and NI and also in Poland and the Czech Republic (Figure 17.2). Rates of the disease were lowest in Portugal, followed by Japan, Australia and Canada. Differences in the coding of borderline ovarian cancers by cancer registries may account for some of the international differences in incidence rate.
Figure 17.2 Estimated incidence rate per 100,000 in 2008 for selected developed countries compared to 2005-2007 incidence rate for RoI and NI: ovarian cancer |
 |
Source: GLOBOCAN 2008 (Ferlay et al., 2008) (excluding RoI and NI data, which is derived from Cancer Registry data for 2005-2007) |
Table 17.2 Risk factors for ovarian cancer, by direction of association and strength of evidence
| Increases risk | Decreases risk |
Convincing or probable | Family history of ovarian cancer1,2 | Tubal ligation13 or hysterectomy with ovarian conservation11,14 |
| Nulliparity3 | Oral contraceptives6,15,16,17 |
| Hormone replacement therapy4,5,6 | |
| Height/tallness7 | |
| Tobacco smoking8,9 | |
| Asbestos10 | |
Possible | Fertility drugs3,11 | Breast feeding18 |
Greater body fatness7,12 | Non-starchy vegetables19,20 | |
Physical activity21 | ||
1 one or more first degree relative(s) with cancer of the ovary; 2 Stratton et al., 1998; 3 Ness et al., 2002; 4 particularly oestrogen-only formulations; 5 Pearce et al., 2009; 6 International Agency for Research on Cancer, 2011a; 7 Schouten et al., 2008; 8 associated with mucinous tumours only; 9 Secretan et al., 2009; 10 Straif et al., 2009; 11 Whittemore et al., 1992; 12 Lahmann et al., 2010; 13 surgical procedure involving cutting or blocking a woman’s fallopian tubes; 14 Cibula et al., 2011; 15 combined oestrogen-progestogen formulations; 16 Collaborative Group, 2008; 17 Cibula et al., 2010; 18 Ip et al., 2009; 19 includes broccoli, cabbage, carrots, cauliflower, celery, leeks, lettuce, onions, peas, peppers and spinach; 20 World Cancer Research Fund / American Institute of Cancer Research, 2007; 21 Olsen et al., 2007 | ||
Family history of the disease is the most important risk factor for ovarian cancer. Women with at least one affected first degree relative have a three-fold increased risk of developing ovarian cancer themselves. Together with breast cancer, ovarian cancer is a component of several autosomal dominant cancer syndromes, most notably the BRCA1 and BRCA2 mutation syndromes. Women who have mutations in the BRCA1 or BRCA2 genes have a high chance of developing ovarian cancer over their lifetime (39% risk for BRCA1 mutation carriers and 11% for BRCA2 mutation carriers up to the age of 70; Antoniou et al., 2003).
Endogenous and exogenous oestrogens play a key role in the aetiology of ovarian cancer. Not having children (nulliparity) is associated with increased risk and, by contrast, each additional child confers a 20% reduction in risk (Riman et al., 2004). Women who have used fertility drugs may also have raised risk, especially if they remain nulligravid. Risk is reduced in women who have had bilateral tubal ligation (their fallopian tubes “tied”) or hysterectomy with ovarian conservation. In terms of exogenous hormones, use of hormone replacement therapy, particularly oestrogen-only formulations, is clearly related to increased risk, although formulations which include progestin are associated with only a modest risk. Women who have used combined oestrogen-progestogen oral contraceptives have decreased risk. Protection increases with increasing duration of use, and the reduction in risk persists for more than 30 years after use has ceased. Breastfeeding has also been associated with lower risk of ovarian cancer, but uncertainties remain in the evidence.
Risk of ovarian cancer is raised in taller women, but tallness in itself is unlikely to be a causal factor; it is most likely a marker for factors relating to promoters of growth in childhood (World Cancer Research Fund / American Institute of Cancer Research, 2007).
Several lifestyle factors have been related to ovarian cancer risk, but most of the associations remain somewhat uncertain. The exception is smoking, which is causally related to mucinous ovarian tumours, but not to other tumour types (Jordan et al., 2006). Higher intake of non-starchy vegetables may be associated with reduced risk, but this category includes a wide and disparate group of vegetables with many different plant food constituents (e.g. fibre, folate, flavonoids) and the contributions of the different constituents have not been unravelled (World Cancer Research Fund / American Institute of Cancer Research, 2007). There may be a modest (approximately 20%) reduction in risk among women with the highest, versus those with the lowest, levels of recreational physical activity. Body fatness and/or obesity may also be related to increased risk.
Figure 17.3 Adjusted relative risks (with 95% confidence intervals) of ovarian cancer by socio-economic characteristics of geographic area of residence | |
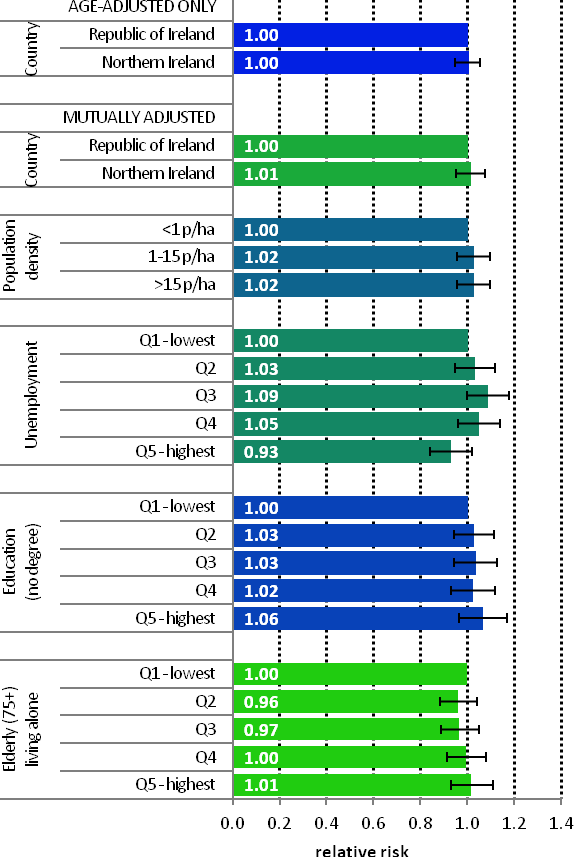 | The risk of ovarian cancer was similar in NI and RoI during 1995-2007, both with and without adjustment for socio-economic and population density factors (Figure 17.3). Variation in ovarian cancer risk by area-based socio-economic characteristics and population density was minimal. However, women living in areas with unemployment of between 4.8% and 6.2% (quintile 3) had a 9% elevated risk of this cancer. |
Ovarian cancer showed a strong geographical pattern with two main areas of higher relative risk (Map 17.1). The first area was centred on Cork city, extending over most of Munster and including the Dingle peninsula in particular. The second area was in the eastern half of NI.
Map 17.1 Ovarian cancer, smoothed relative risks
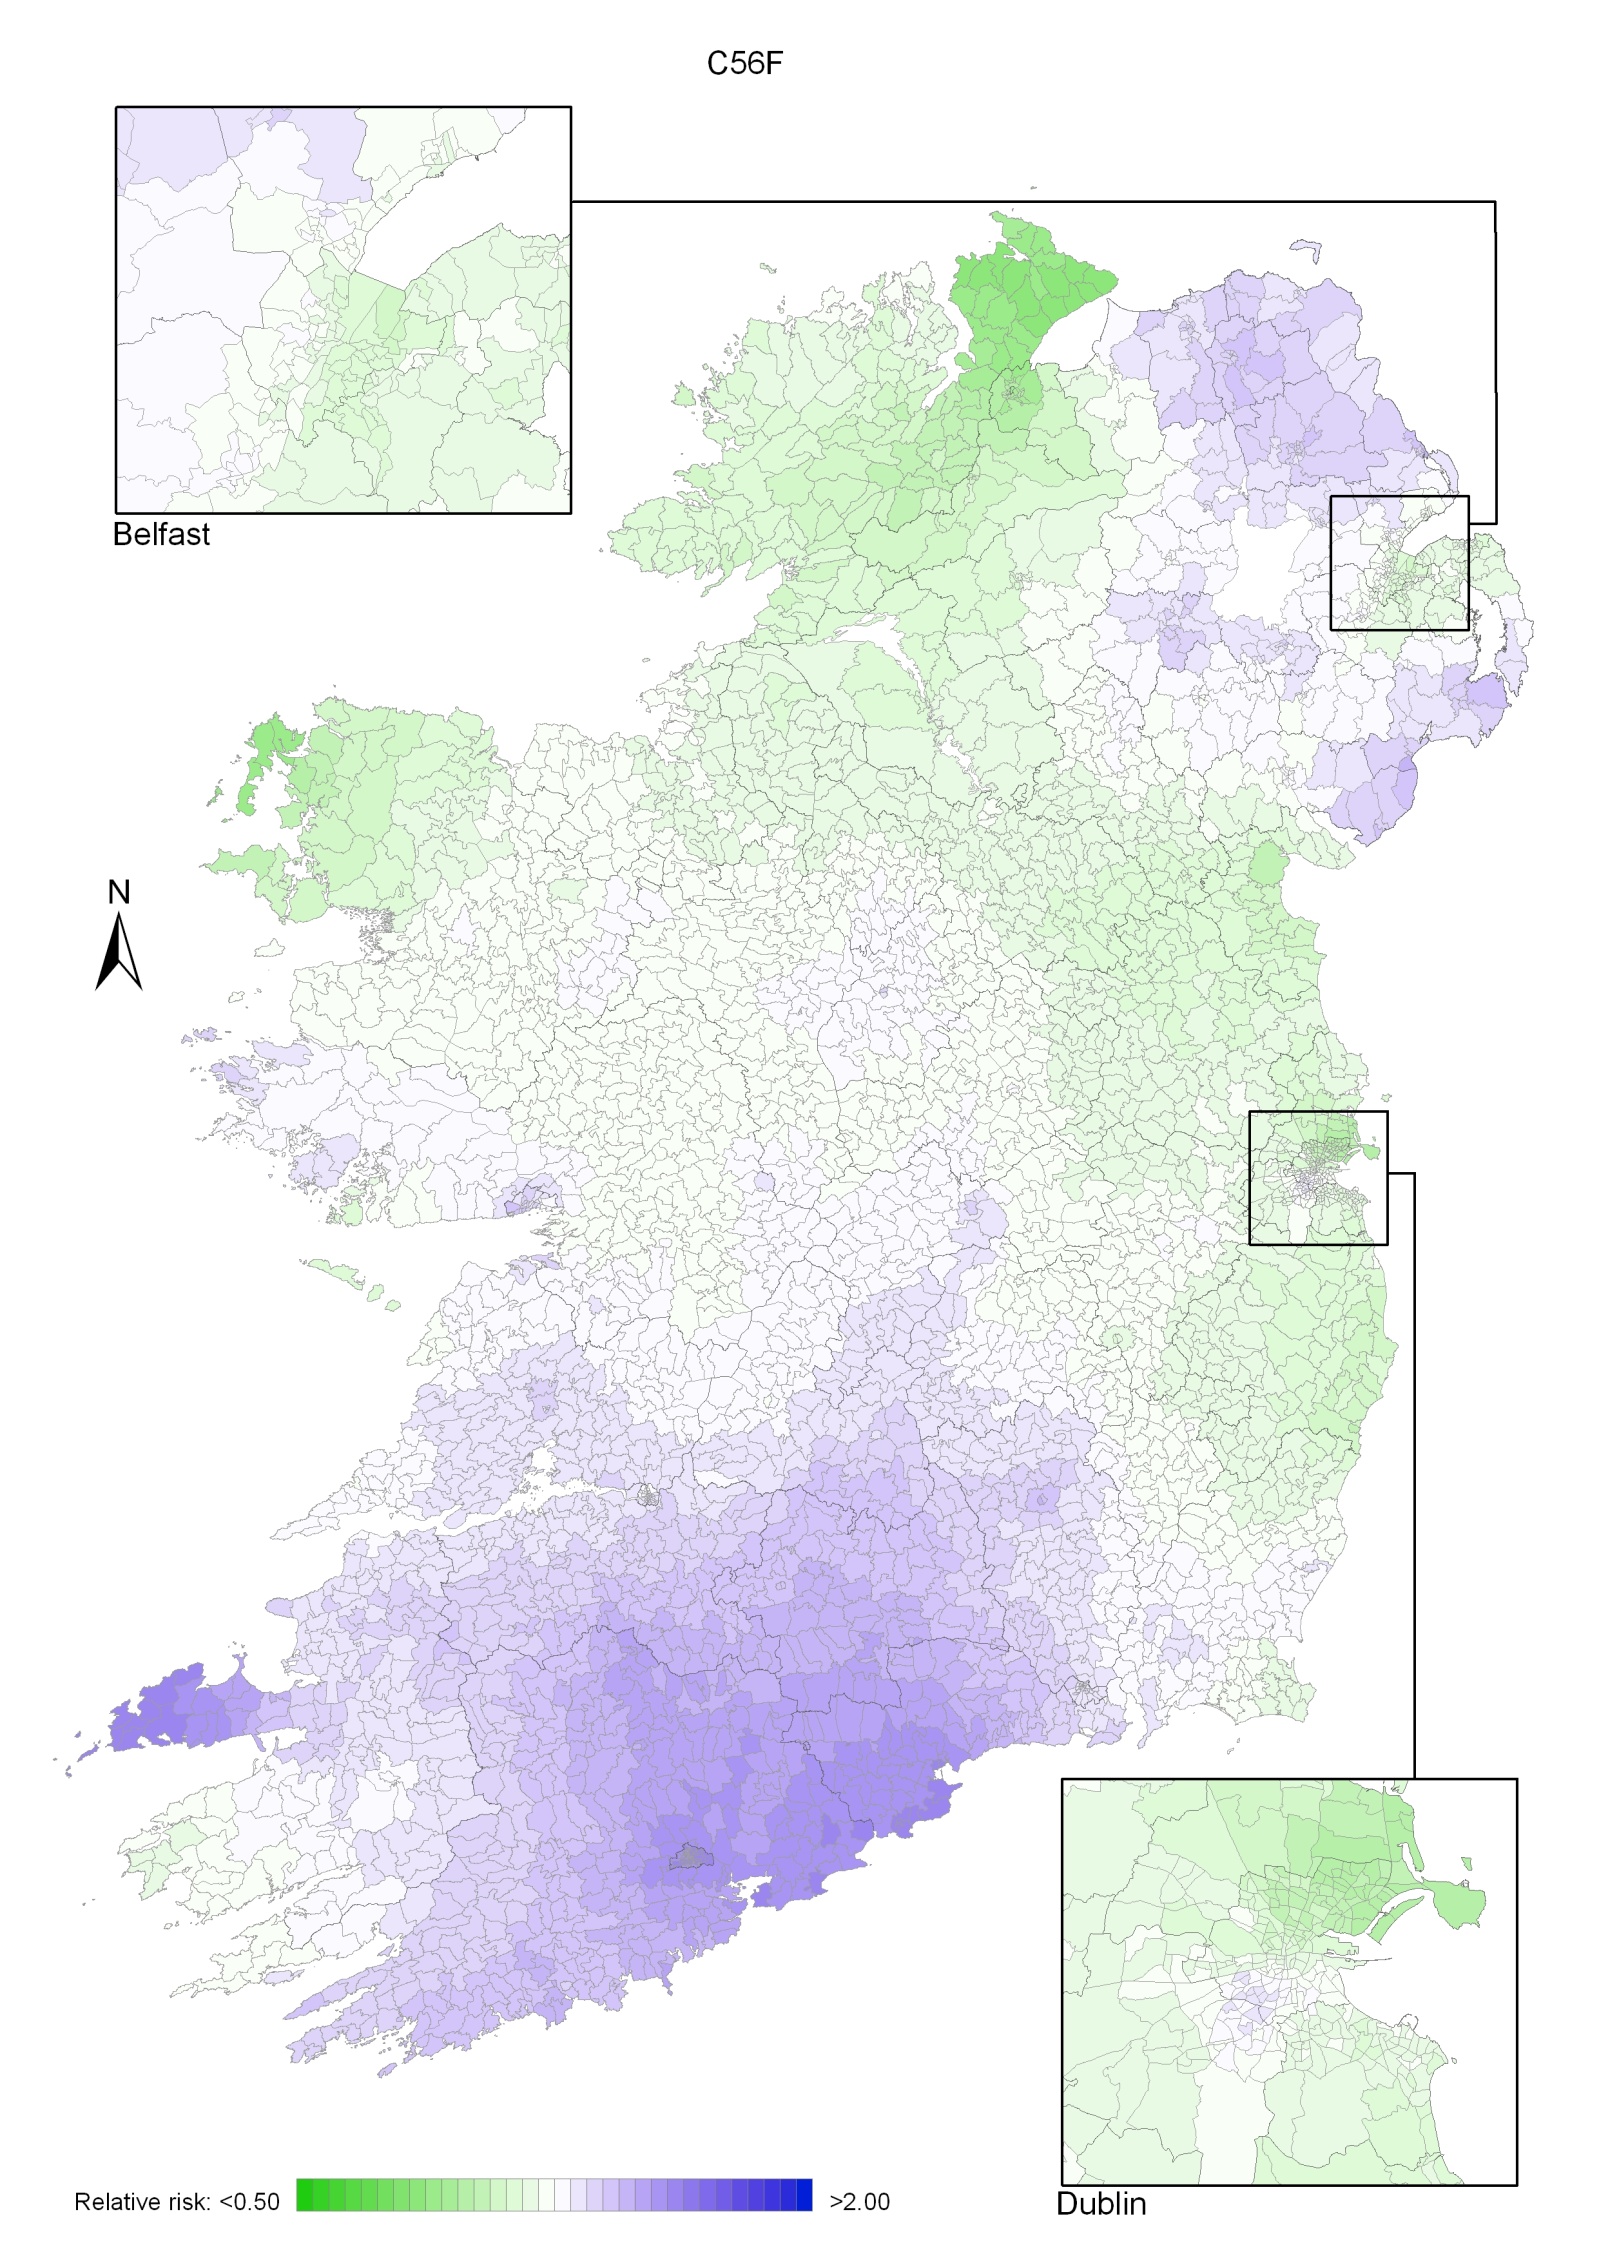
The group of cancers of the brain and other central nervous system includes those which occur in the brain (more than 90% of the cancers), meninges (~3%) and cranial nerves or spinal cord (~3%); (National Cancer Registry, 2010b). Brain and other central nervous system cancer (CNS) was the fifteenth most common cancer in Ireland, accounting for 1.7% of all malignant neoplasms, excluding non-melanoma skin cancer, in women and 2.1% in men (Table 18.1). The average number of new cases diagnosed each year was 174 in women and 234 in men. During 1995-2007, the number of new cases diagnosed showed an overall increase of approximately 3% per annum.
The risk of developing brain and CNS cancer before the age of 75 was 1 in 204 for women and 1 in 134 for men and was slightly higher in RoI than in NI. At the end of 2008, 563 women and 706 men aged under 65, and 123 women and 111 men aged 65 and over, were alive up to 15 years after their cancer diagnosis.
Table 18.1 Summary information for brain and other central nervous system cancer in Ireland, 1995-2007
Ireland | RoI | NI | ||||
females | males | females | males | females | males | |
% of all new cancer cases | 1.2% | 1.5% | 1.3% | 1.6% | 1.1% | 1.5% |
% of all new cancer cases excluding non-melanoma skin cancer | 1.7% | 2.1% | 1.8% | 2.2% | 1.4% | 2.0% |
average number of new cases per year | 174 | 234 | 125 | 166 | 49 | 68 |
cumulative risk to age 74 | 0.5% | 0.7% | 0.5% | 0.8% | 0.4% | 0.7% |
15-year prevalence (1994-2008) | 686 | 817 | 467 | 571 | 219 | 246 |
Cancer of the brain and CNS was predominantly a disease of younger persons (Figure 18.1). Approximately half of all new cases presented under 60 years of age (55% of men and 47% of women). The average age at diagnosis was younger in NI than in RoI.
Figure 18.1 Age distribution of brain and other central nervous system cancer cases in Ireland, 1995-2007, by sex
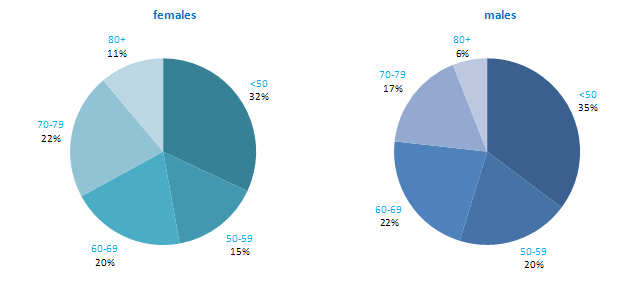
Denmark, Norway and Sweden had the highest rates of brain and CNS cancer in 2008 for both men and women, in a comparison of developed countries (Figure 18.2). Japan, Russia and Austria had the lowest rates of the disease. Both RoI and NI had slightly higher than median rates for men, as did RoI for women.
Figure 18.2 Estimated incidence rate per 100,000 in 2008 for selected developed countries compared to 2005-2007 incidence rate for RoI and NI: brain and other central nervous system cancers | |
| females | males |
 | 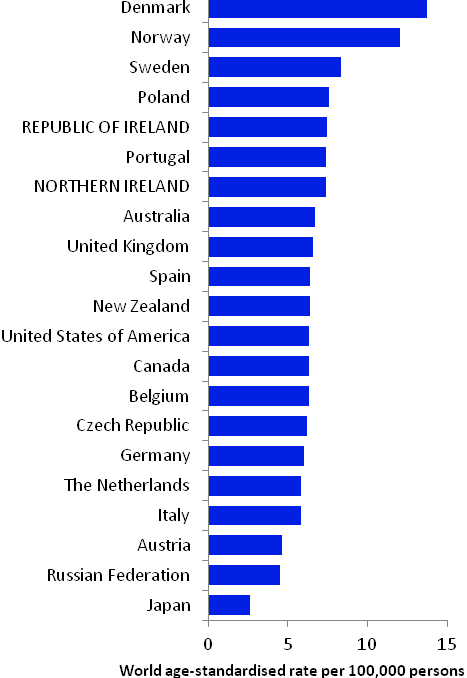 |
Source: GLOBOCAN 2008 (Ferlay et al., 2008) (excluding RoI and NI data, which is derived from Cancer Registry data for 2005-2007) | |
Table 18.2 Risk factors for brain and other central nervous system cancer, by direction of association and strength of evidence
Increases risk | Decreases risk | |
Convincing or probable | Ionizing radiation1,2 | Allergic conditions7 and asthma8,9,10 |
| Radio-frequency electromagnetic fields3,4 | |
Possible | Occupational exposure to formaldehyde5 | |
| Farming6 | |
| ||
1 El Ghissassi et al., 2009; 2 National Toxicology Program, 2011; 3 fields with a frequency range of 30kHz- 300GHz; typically emitted by mobile phones, cordless phones, amateur radios, high-frequency dielectric or induction heaters, mobile phone stations, broadcast antennas and medical applications; 4 Baan et al., 2011; 5 National Toxicology Program, 2010; 6 Khuder et al., 1998; 7 including eczema, hay fever and rhinitis; 8 Chen et al., 2011; 9 McCarthy et al., 2011; 10 Schoemaker et al., 2006 | ||
Most brain tumours in adults start in glial cells and are known as gliomas. Among the gliomas, astrocytomas are most common. Although cancers of the brain and other CNS may occur in children, most cases present in adults and the following description of risk factors relates only to cancers in adults.
Little is known about the aetiology of brain and other CNS cancers, in part because it can be difficult to obtain reliable exposure data from affected individuals, and the cancers are relatively rare, thus limiting prospective (cohort) studies. The most firmly established risk factor is exposure to high doses of ionizing radiation, usually from x-rays or radiation therapy. Whether exposure to radio-frequency electromagnetic fields (RF-EMF), such as those emitted by mobile phones, mobile phone base stations and broadcast antennas, causes cancers of the brain is a matter of considerable controversy. The International Agency for Research on Cancer recently concluded that there was limited evidence on carcinogenicity of RF-EMF, based on associations between wireless phones and glioma (and acoustic neuroma, which is a benign tumour of the nerve which connects the ear to the brain), but some members of the Expert Group considered the evidence-base to be inadequate (Baan et al., 2011).
Risk of gliomas and oligodendroglial tumours is reduced in individuals with asthma or allergic conditions, such as eczema and hay fever. This may also hold for meningiomas, but few studies have been done.
Farming is related to a modest increased risk of cancer of the brain, but the specific exposures which may increase risk have not been identified. Individuals occupationally exposed to formaldehyde—which is used in the production of industrial resins that are then used in the manufacture of products such as adhesives and binders for wood products, plastic and synthetic fibres—may have moderately increased risk of brain and other CNS cancers, but the evidence is not consistent.
Figure 18.3 Adjusted relative risks (with 95% confidence intervals) of brain and other central nervous system cancer by socio-economic characteristics of geographic area of residence: males | MalesThe risk of brain and CNS cancer among men in NI was 10% lower than in RoI, with adjustments for differences in socio-economic characteristics and population density having minimal effect on this difference (Figure 18.3). Male brain and CNS cancer was not associated with either population density or the socio-economic characteristics of the area of residence. |
Figure 18.4 Adjusted relative risks (with 95% confidence intervals) of brain and other central nervous system cancer by socio-economic characteristics of geographic area of residence: females
| FemalesThe difference in brain and CNS cancer risk between NI and RoI was greater for women than men (RR=0.80, 95%CI=0.73-0.88; Figure 18.4). As with men, adjustment for socio-economic characteristics and population density had minimal effect on this difference. The risk of female brain and CNS cancer was weakly associated with population density, with women living in the most densely populated areas having a 13% greater risk than those in the least densely populated areas. Female brain and CNS cancer was not associated with the socio-economic characteristics of the area of residence. |
Cancer of the brain and other CNS had a strong geographical pattern which was similar for both sexes, though slightly less pronounced for men (Maps 18.1-18.3).
The maps of relative risk showed a gradient across the whole island, with the highest relative risk in the south-west, decreasing uniformly to the area of lowest risk in the north-east. The risk in urban areas was similar to that in the surrounding countryside.
Map 18.1 Brain and other central nervous system cancer, smoothed relative risks: both sexes
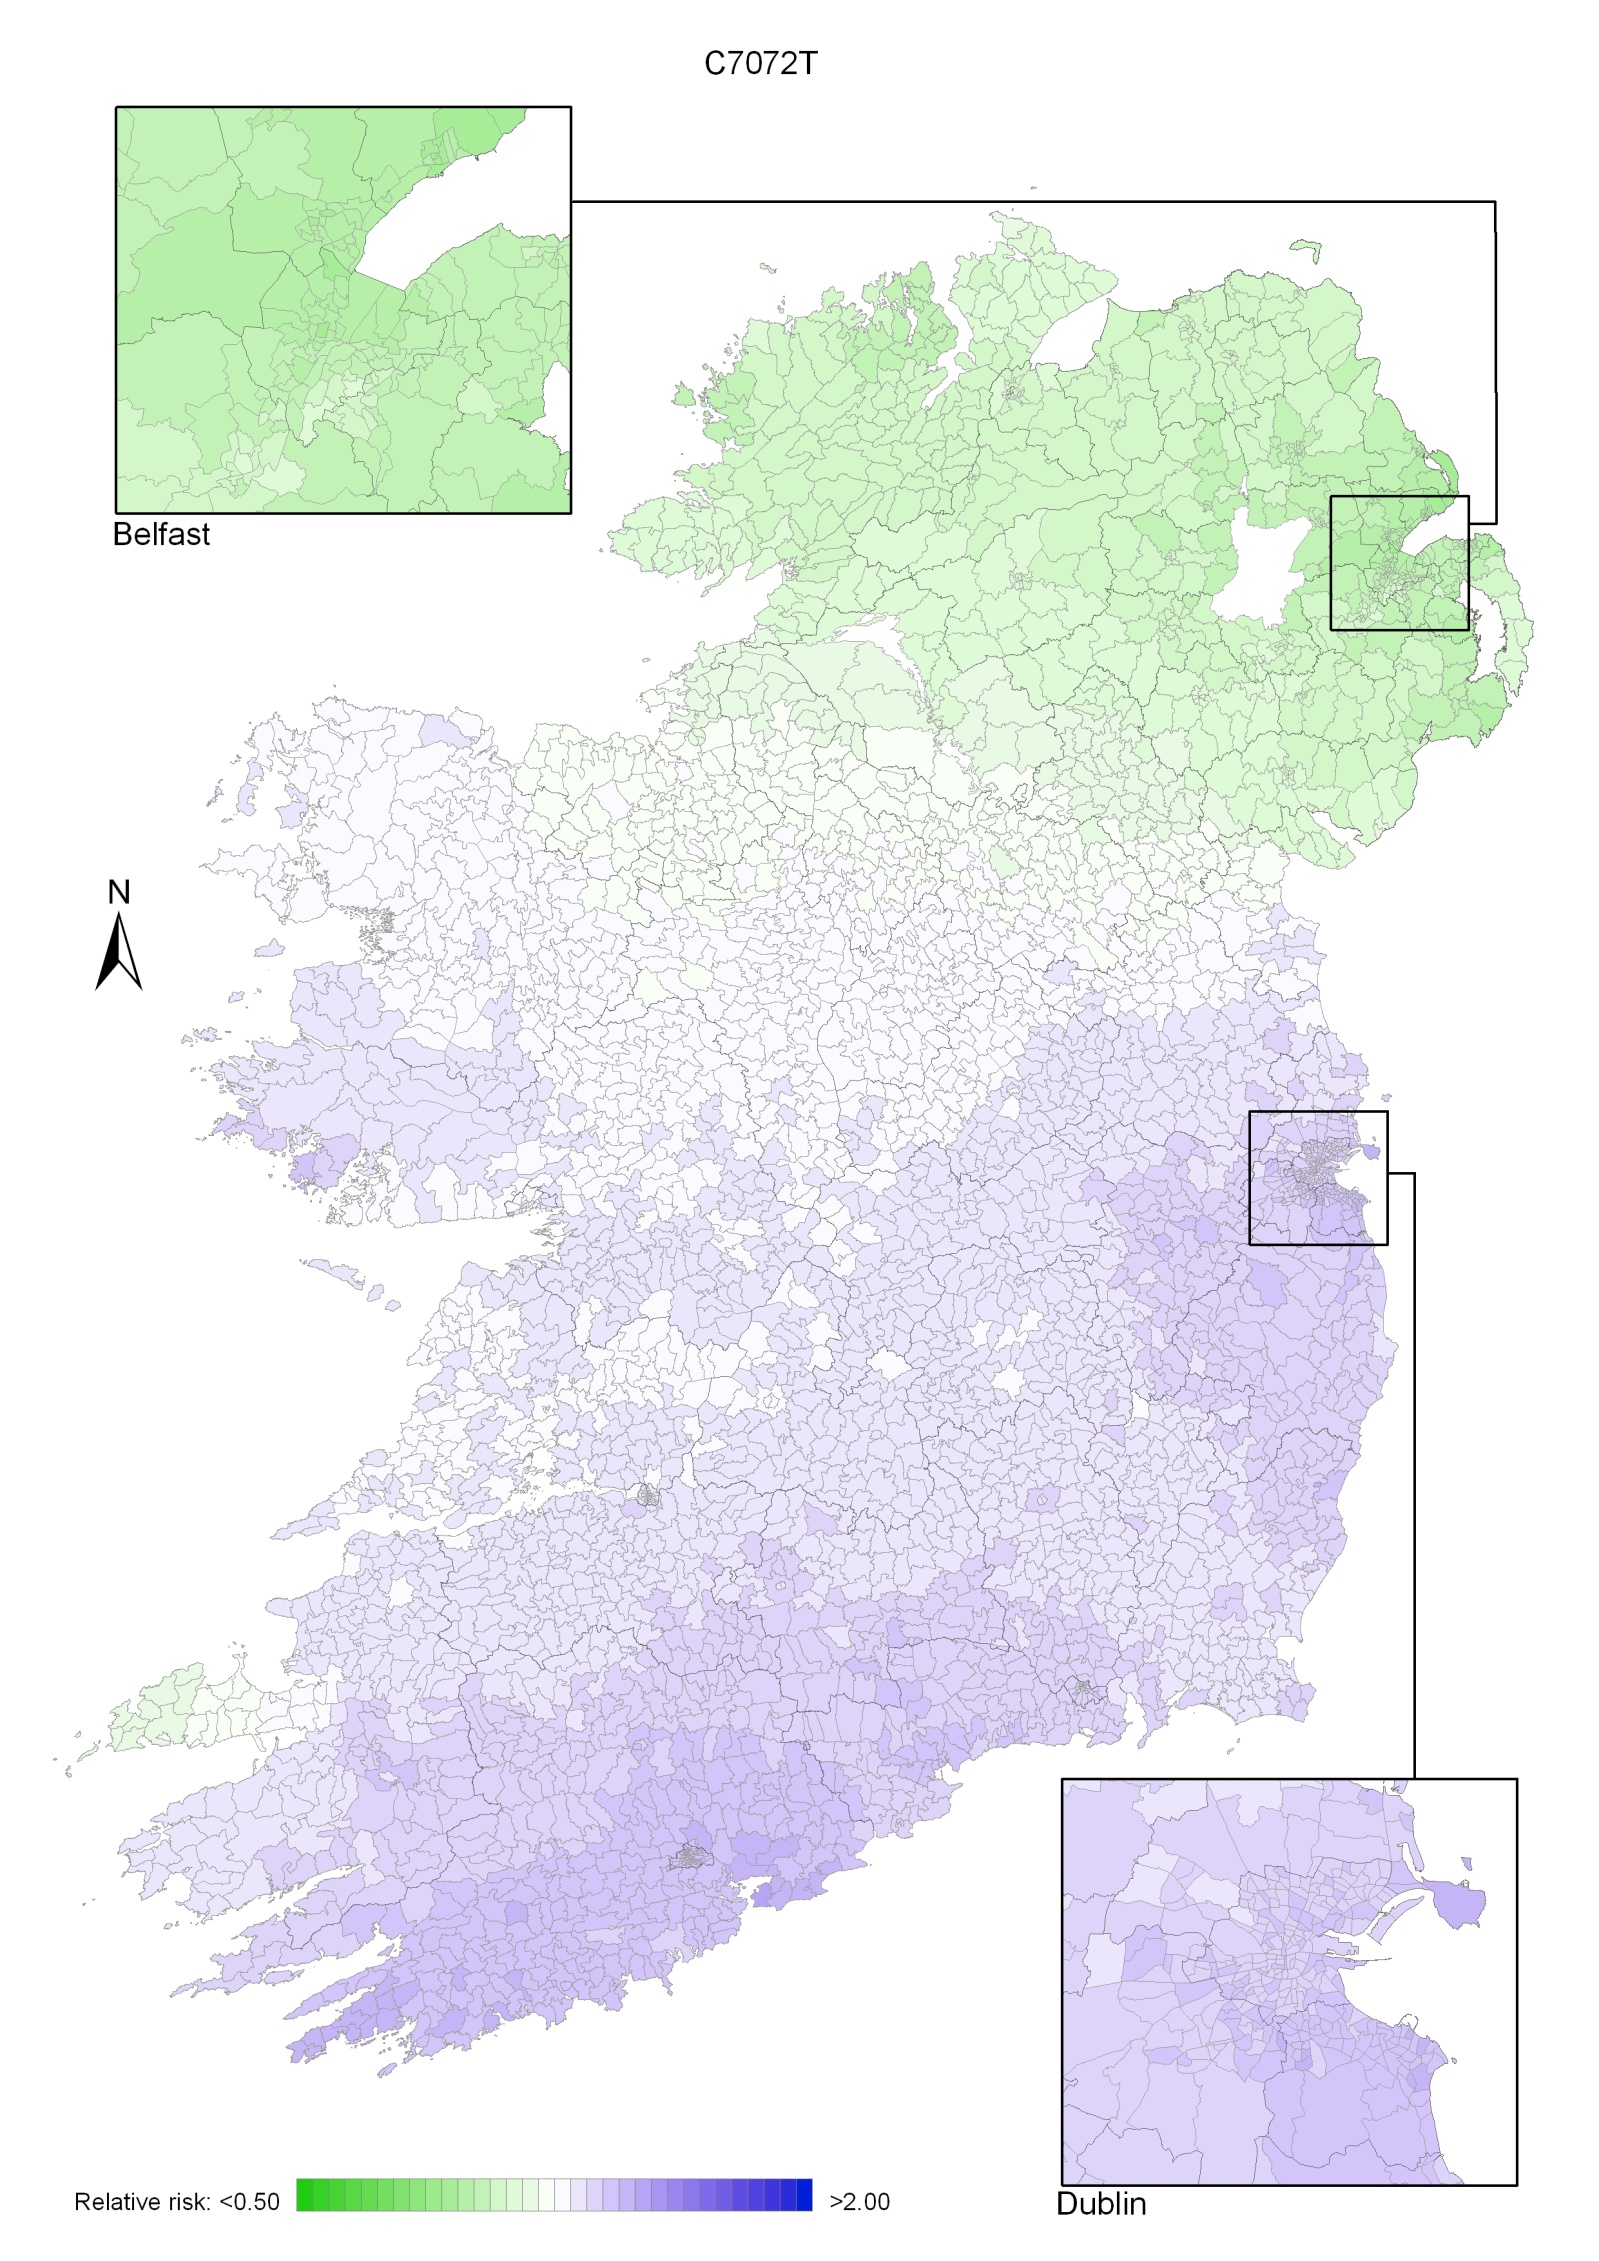
Map 18.2 Brain and other central nervous system cancer, smoothed relative risks: males
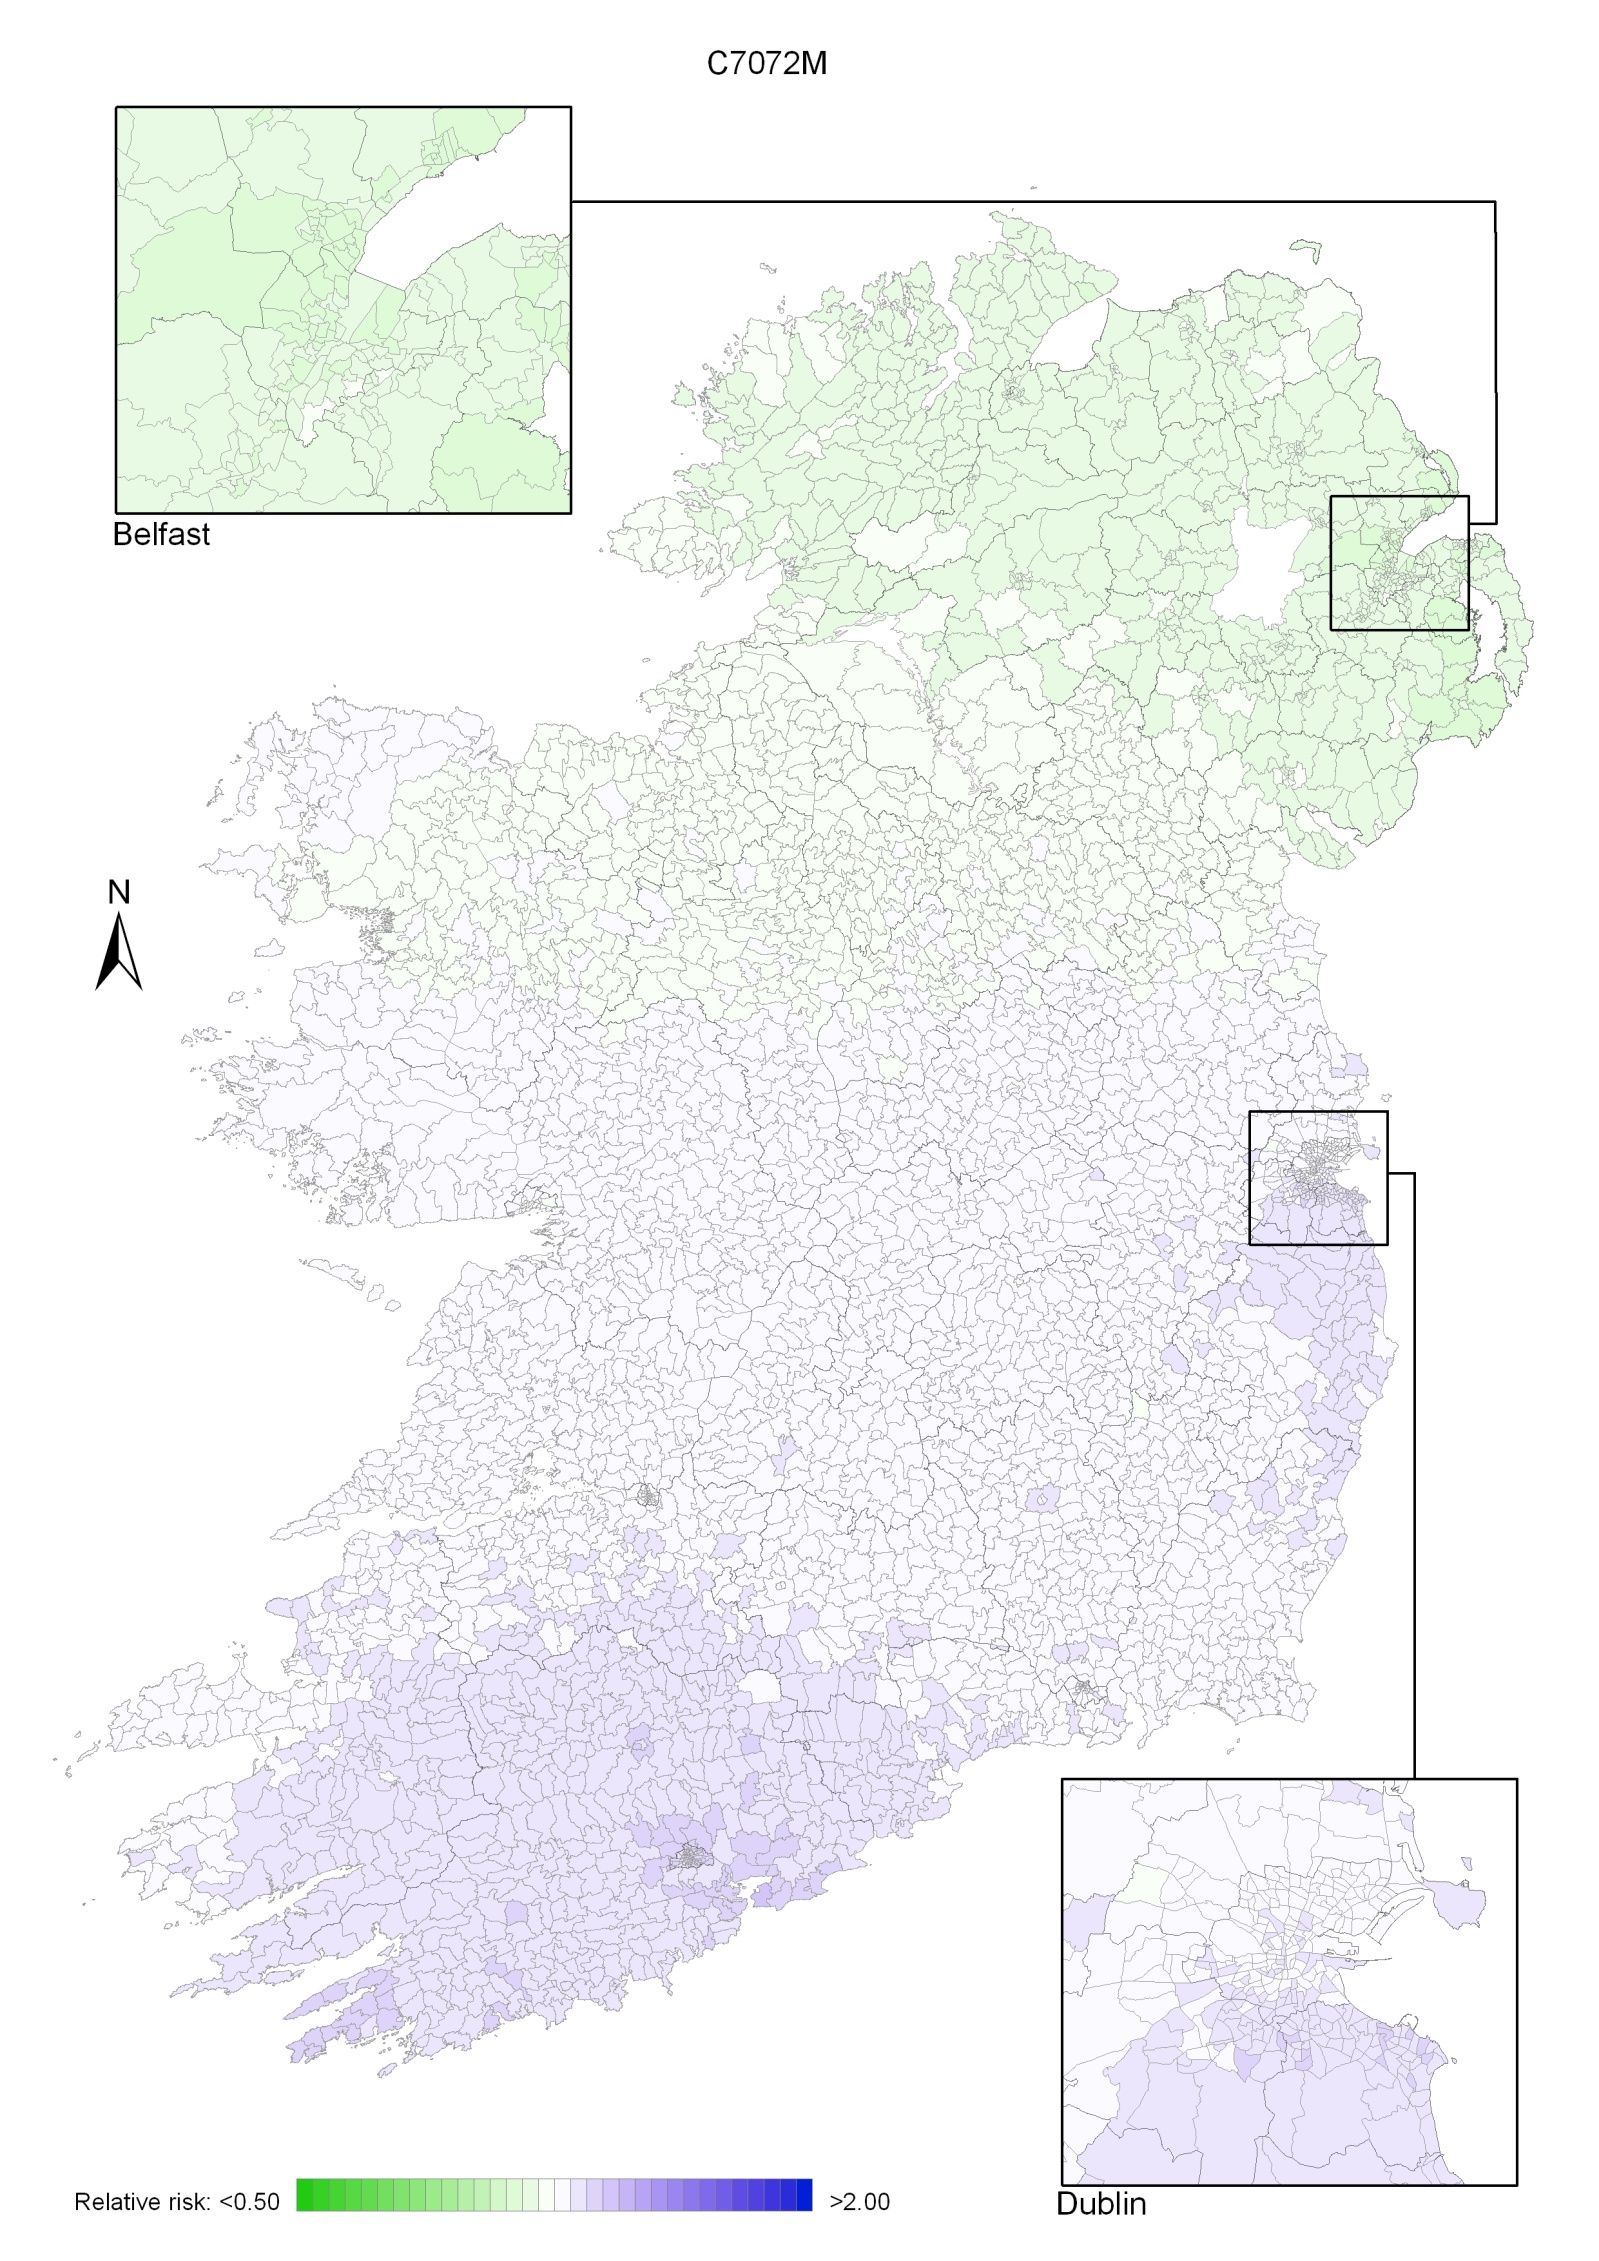
Map 18.3 Brain and other central nervous system cancer, smoothed relative risks: females
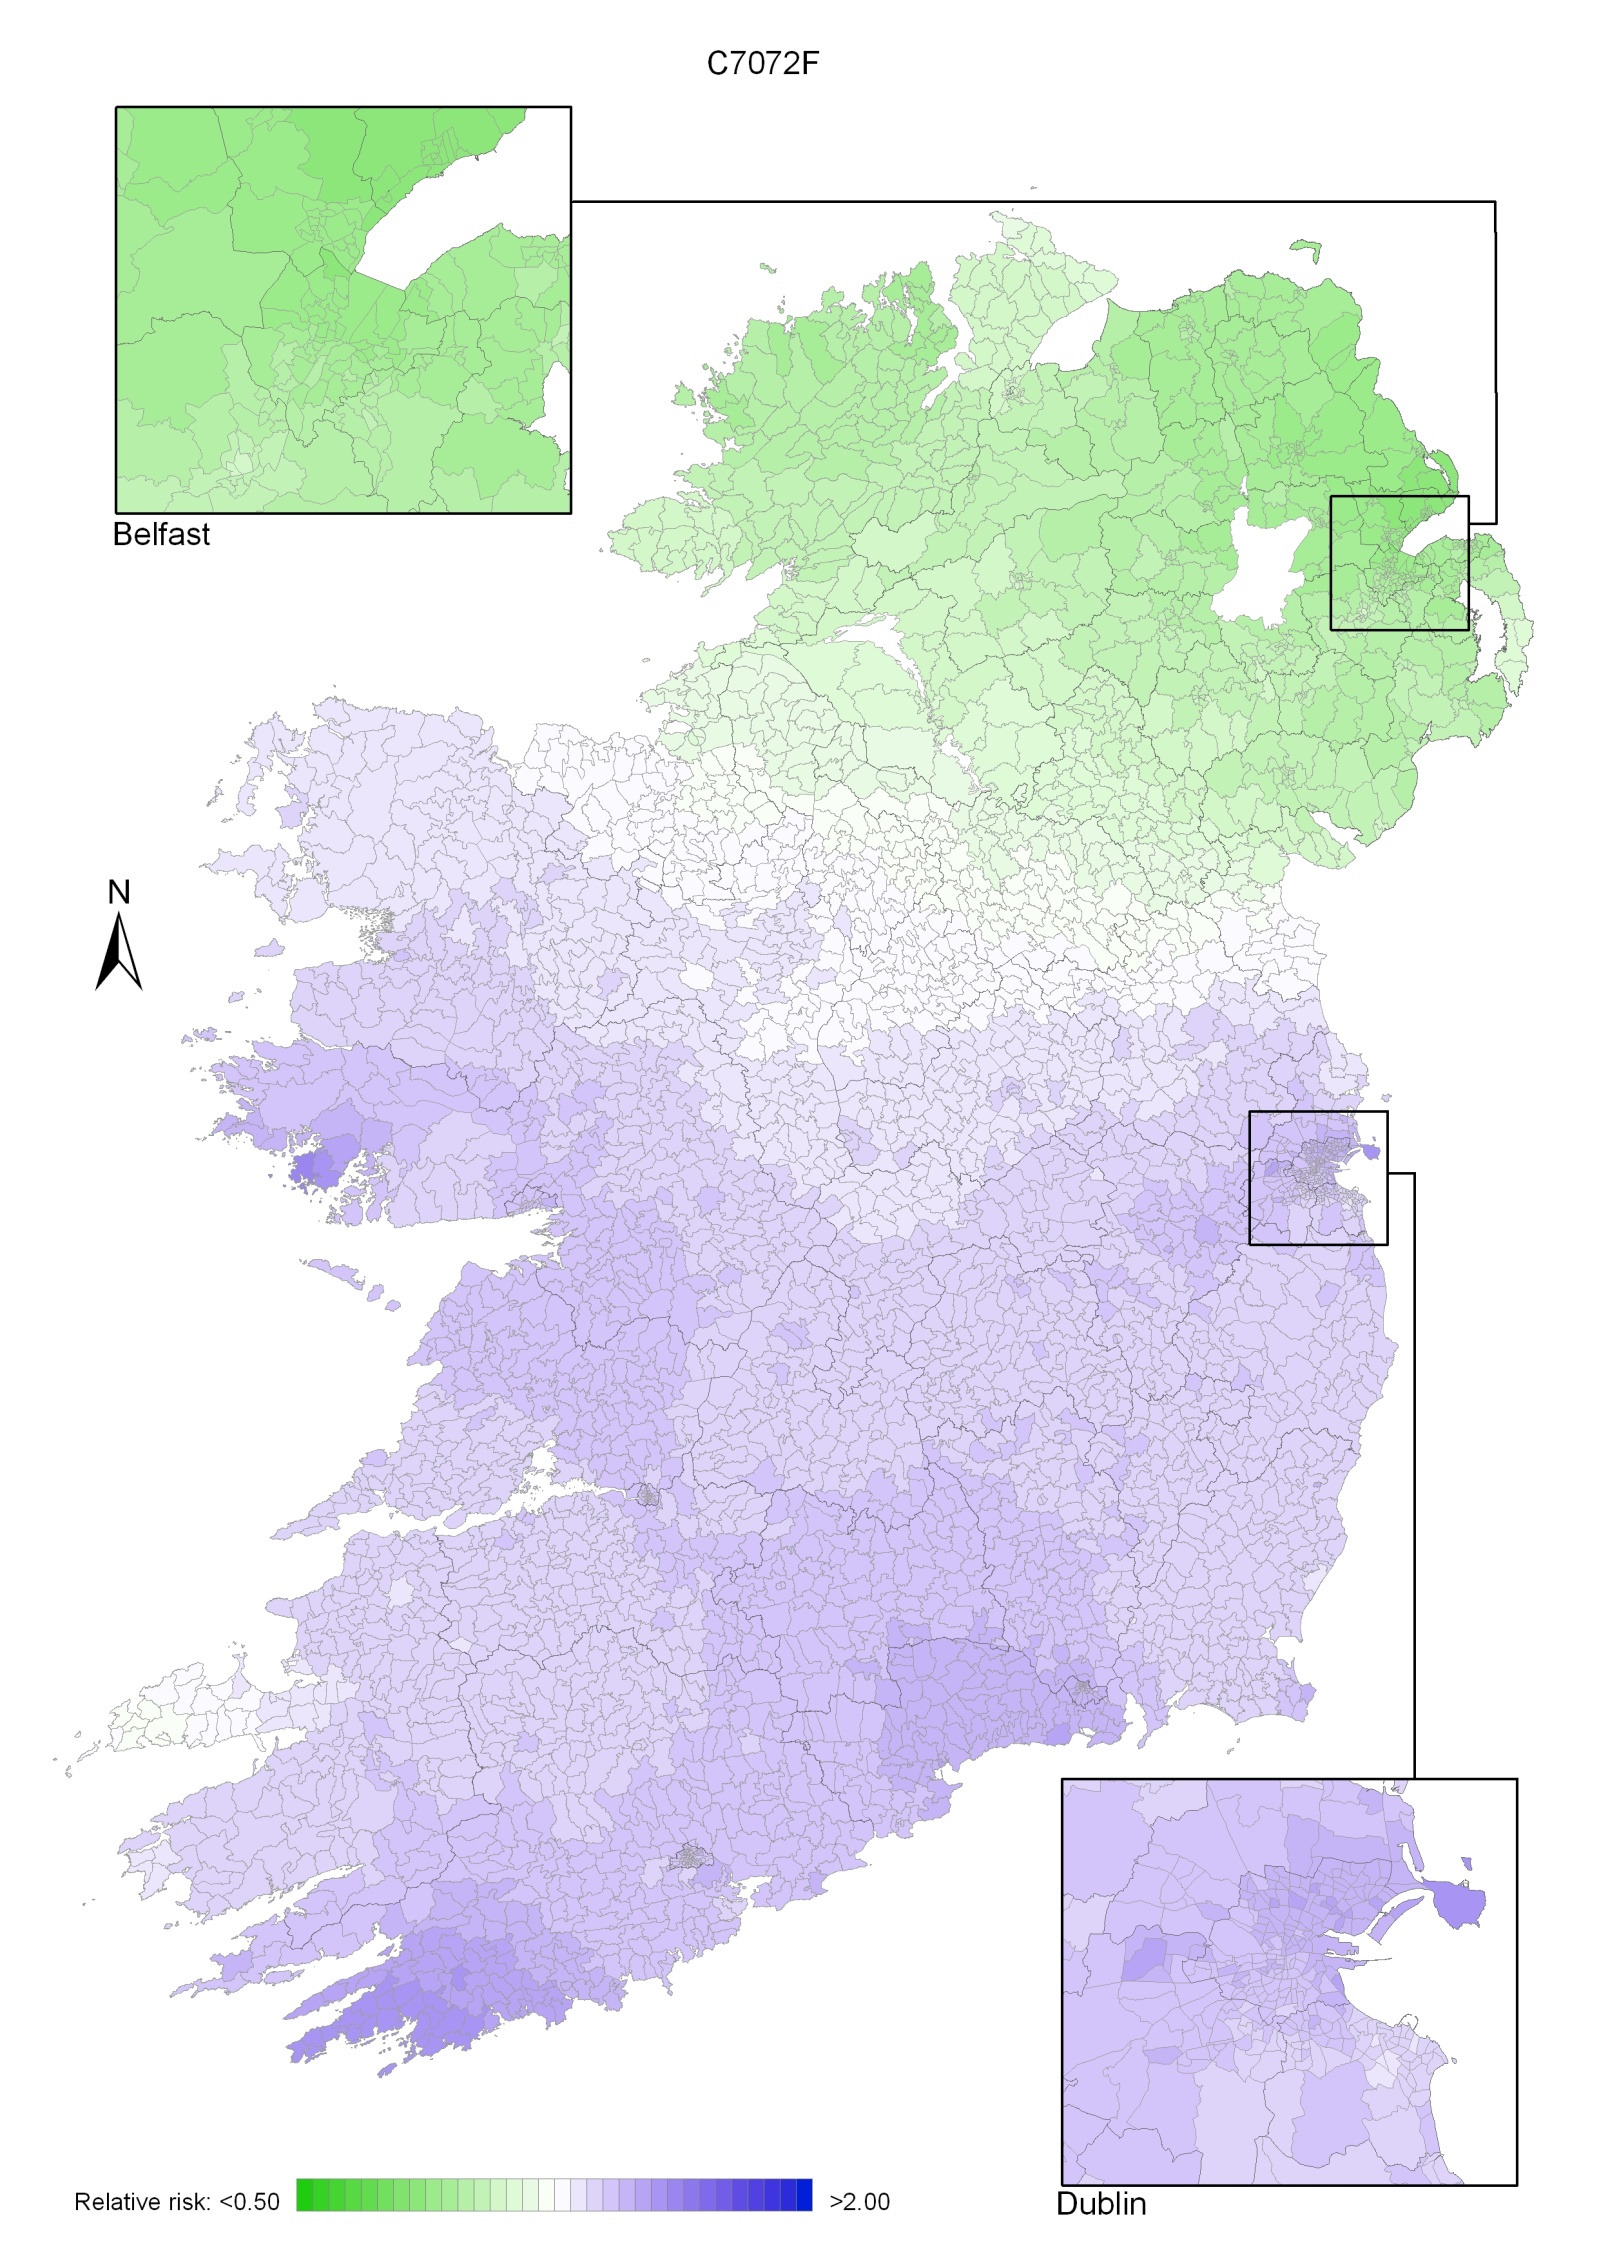
Cancer of the uterus is classified by ICD-10 into three sites—cancer of the cervix uteri (cervical cancer; see Chapter 20), cancer of the corpus uteri (uterine cancer; discussed in this chapter), and cancer of the uterus, part unspecified. “Part unspecified” cases make up less than 5% of all cancers of the uterus and are not considered here.
Cancer of the corpus uteri (uterine cancer) was the sixth most common cancer in women in Ireland, accounting for 3.9% of all malignant neoplasms, excluding non-melanoma skin cancer, in women (Table 19.1). The average number of new cases diagnosed each year was 403. During 1995-2007, the number of new cases diagnosed per year increased by 7% in NI and 3% in RoI.
The risk of developing uterine cancer up to the age of 74 was 1 in 77 and was slightly higher in NI than in RoI. At the end of 2008, 1,756 women aged under 65, and 2,419 aged 65 and over, were alive up to 15 years after diagnosis.
Table 19.1 Summary information for uterine cancer in Ireland, 1995-2007
Ireland | RoI | NI | |
% of all new cancer cases | 2.9% | 2.7% | 3.2% |
% of all new cancer cases excluding non-melanoma skin cancer | 3.9% | 3.7% | 4.2% |
average number of new cases per year | 403 | 258 | 145 |
cumulative risk to age 74 | 1.3% | 1.2% | 1.4% |
15-year prevalence (1994-2008) | 4175 | 2623 | 1552 |
Almost 80% of cases of uterine cancer were diagnosed between 50 and 79 years of age, with 27% presenting between 50 and 59 years, 30% between 60 and 69 years and 22% between 70 and 79 years (Figure 19.1). Only 11% of cases were diagnosed in women aged less than 50, with a further 10% diagnosed in those aged 80 and older.
Figure 19.1 Age distribution of cases of uterine cancer in Ireland, 1995-2007
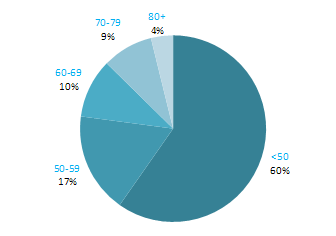
Rates of uterine cancer varied considerably among developed countries, with rates highest in the Czech Republic and Norway and lowest in Japan and Portugal (Figure 19.2). In RoI the incidence rate of the disease was low compared to other countries, while in NI the rate was slightly higher than the median. Variation between countries in the percentage of cases assigned to “uterus, part unspecified” (which are not included in the data below) may account for some of the international variation.
Figure 19.2 Estimated incidence rate per 100,000 in 2008 for selected developed countries compared to 2005-2007 incidence rate for RoI and NI: uterine cancer |
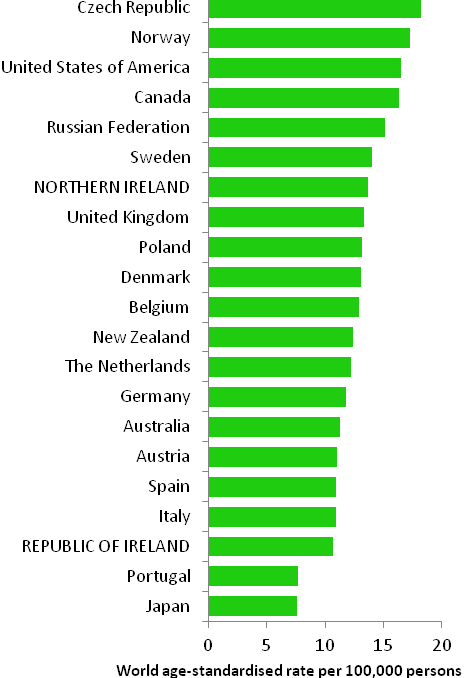 |
Source: GLOBOCAN 2008 (Ferlay et al., 2008) (excluding RoI and NI data, which is derived from Cancer Registry data for 2005-2007) |
Table 19.2 Risk factors for uterine cancer, by direction of association and strength of evidence
Increases risk | Decreases risk | |
Convincing or probable | Hormone replacement therapy1,2 | Oral contraceptives2,18 |
| Tamoxifen2 | Physical activity4 |
| Nulliparity3 | |
| Greater body fatness/abdominal fatness4,5 | |
| Diabetes6,7 | |
| Lynch syndrome (hereditary nonpolyposis colorectal cancer (HNPCC))8,9 | |
| Family history of cancer of the corpus uteri10,11,12 | |
Possible | Early menarche13 | Breast feeding19,20 |
Late natural menopause13 | Non-starchy vegetables4,21 | |
Polycystic ovary syndrome14 | Soya or soya food products22,23 | |
Red meat4,15 | Foods containing fibre24 | |
Diet with a high glycaemia load16,17 | ||
| ||
1 oestrogen-only formulations, and oestrogen-progestogen formulations where the progestogen is taken less than 15 days in the month; 2 International Agency for Research on Cancer, 2011a; 3 Dossus et al., 2010; 4 World Cancer Research Fund / American Institute of Cancer Research, 2007; 5 Crosbie et al., 2010 ; 6 Friberg et al., 2007; 7 Noto et al., 2010; 8 Bonadona et al., 2011; 9 Baglietto et al., 2010; 10 one or more first degree relative(s) with cancer of the corpus uteri; 11 Hemminki et al., 2005; 12 Lucenteforte et al., 2009; 13 Purdie and Green, 2001; 14 Jakimiuk and Issat, 2009; 15 includes beef, pork and lamb ; 16 glycaemic load is a ranking system for carbohydrate quantity and quality of food portions; 17 Mulholland et al., 2008; 18 combined oestrogen-progestogen pills; 19 Salazar-Martinez et al., 1999; 20 Newcomb & Trentham-Dietz, 2000; 21 includes broccoli, cabbage, carrots, cauliflower, celery, leeks, lettuce, onions, peas, peppers and spinach; 22 includes soya beans, edamame, tofu, soya milk; 23 Myung et al., 2009; 24 Bandera et al., 2007 | ||
Hormones play a major role in the aetiology of uterine cancer. A surge in incidence of these cancers in the USA in the late-1960s and mid-1970s led to the discovery of the role of hormone replacement therapy (Jick et al., 1980). Oestrogen-only formulations of hormone replacement therapy are now considered to be a causal agent and risk is also increased in women who use regimes which contain both oestrogen and progestogen, but in which the progestogen is taken for less than 15 days per month. Tamoxifen, a selective oestrogen receptor modulator used in the prevention and treatment of breast cancer, also causes uterine cancer. In contrast, use of combined oestrogen-progestogen oral contraceptives is protective. Risk is reduced by about half in women who have taken oral contraceptives, and the protective effect lasts for around two decades after cessation of use. However, it should be noted that these findings have generally been based on older high-dose oral contraceptives. In addition, reproductive factors associated with increased exposure to endogenous oestrogens may also influence risk. Women who have not had children (nulliparous) are at increased risk, while risk reduces with increasing number of full-term pregnancies. Risk may be raised in women with early menarche and late menopause, while breastfeeding may be protective. The strong and consistent association between body fatness and uterine cancer (60% increase in risk per 5 kg/m2 increase in body mass index) may also operate through effects on oestrogens and other hormones, such as insulin (World Cancer Research Fund / American Institute of Cancer Research, 2007). These effects are also a possible explanation for the observed relationship between higher levels of physical activity and reduced disease risk. As regards insulin levels more directly, there is a two to three-fold increased risk in diabetic individuals (both type 1 and type 2 diabetes).
Women who have one or more first-degree relatives affected by uterine cancer have a two-fold increased risk of developing the disease. Part of this is due to women in families affected by hereditary nonpolyposis colorectal cancer (HNPCC) syndrome, also known as Lynch syndrome. Depending on which genetic mutations they carry, these women have a 20-55% chance of developing uterine cancer in their lifetime.
Figure 19.3 Adjusted relative risks (with 95% confidence intervals) of uterine cancer by socio-economic characteristics of geographic area of residence | |
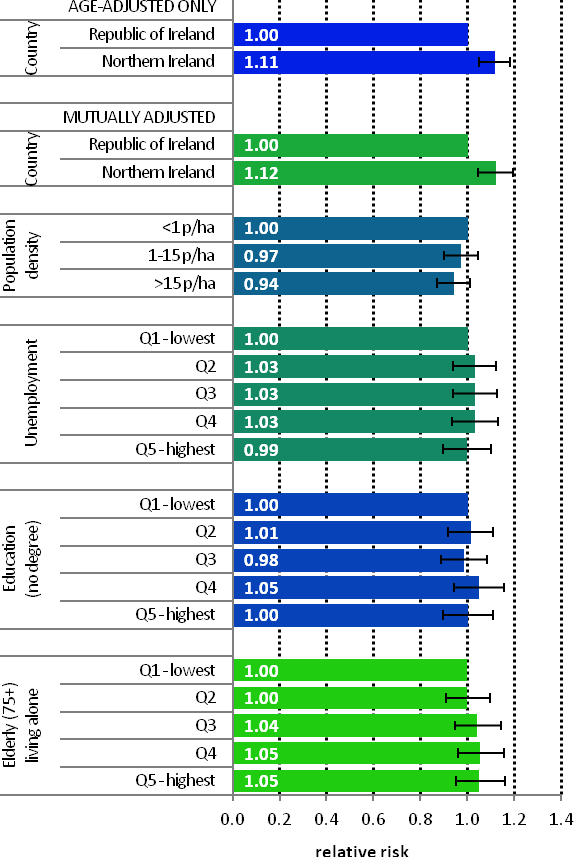 | Uterine cancer was more common in NI than RoI in 1995-2007 (RR=1.11, 95%CI=1.05-1.18), a difference not explained by variations in population density or small-area socio-economic characteristics (Figure 19.3) Other than this difference, there was minimal variation in uterine cancer risk across Ireland, with no significant relationship to population density or small-area socio-economic characteristics. |
Uterine cancer had an unusual geographical pattern, with higher relative risk in NI, Connacht and parts of Munster (Map 19.1). Donegal and most of the east coast, south of the border with NI and including Dublin, had a lower relative risk.
Map 19.1 Cancer of the corpus uteri, smoothed relative risks
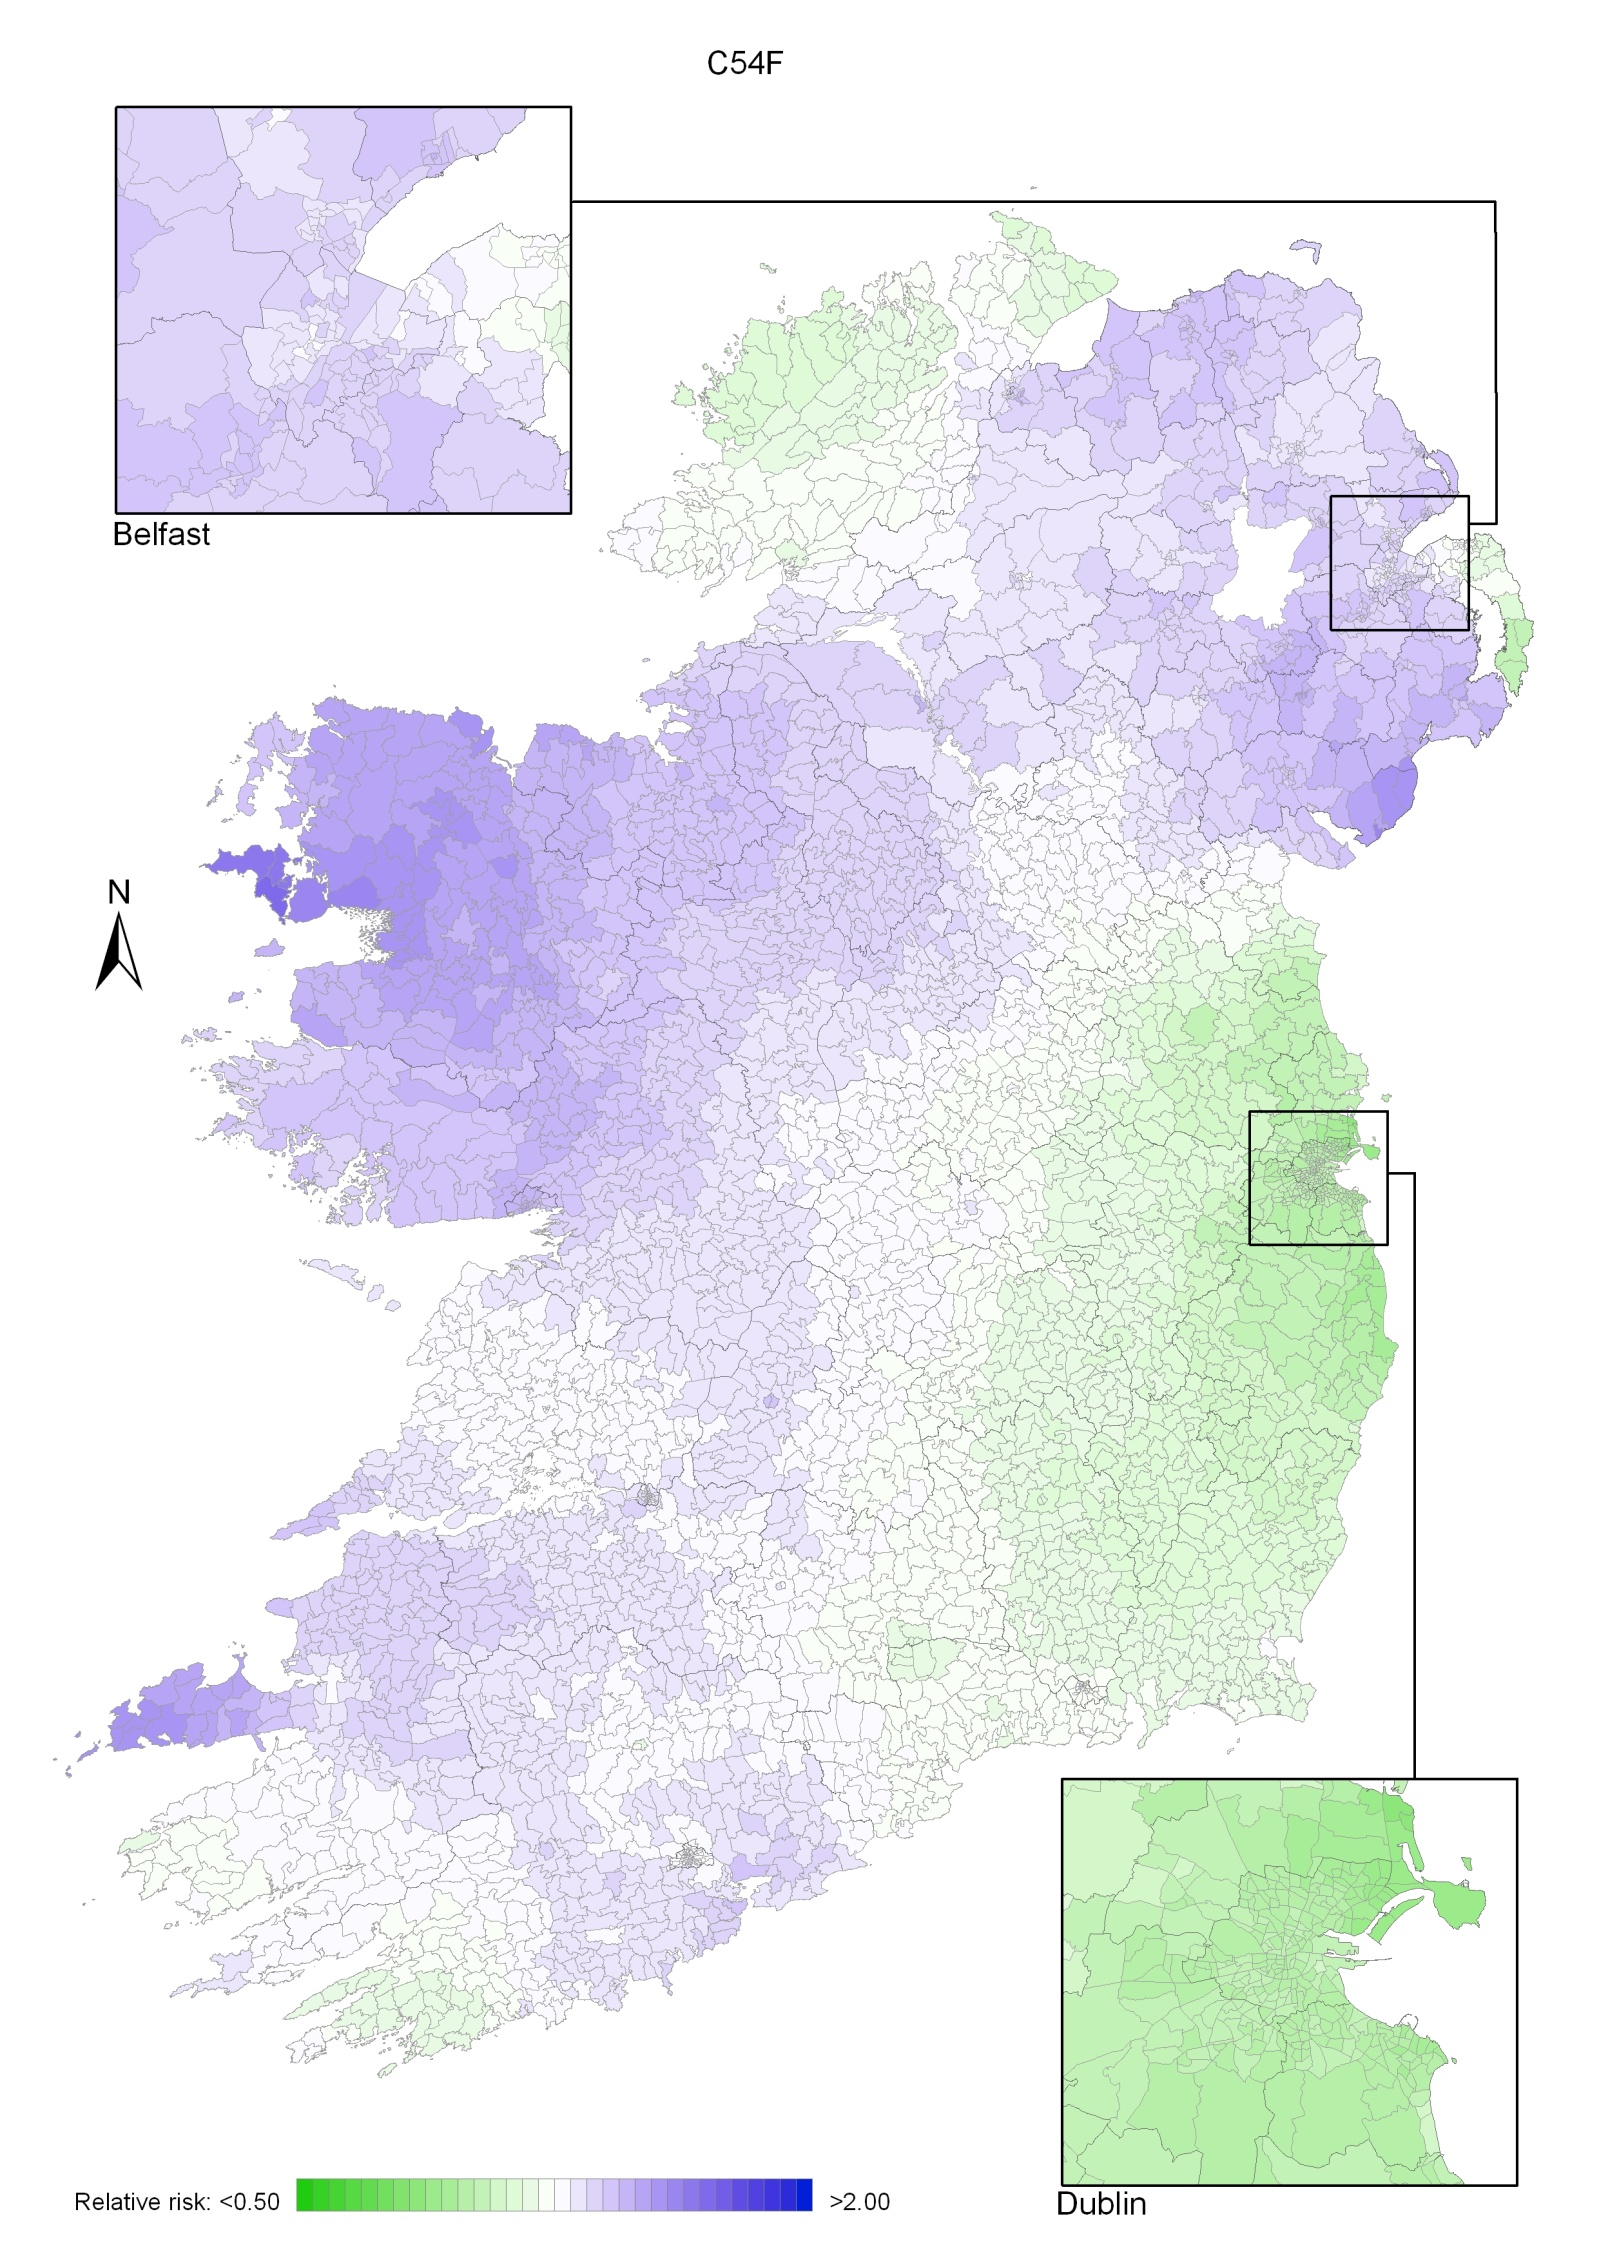
Cancer of the uterus is classified by ICD-10 into three sites—cancer of the cervix uteri (cervical cancer; discussed in this chapter), cancer of the corpus uteri (uterine cancer; see Chapter 19) and cancer of the uterus, part unspecified. “Part unspecified” cases make up less than 5% of all cancers of the uterus and are not considered in this atlas.
Cancer of the cervix uteri was the eighth most common cancer for women in Ireland, accounting for 2.8% of all malignant neoplasms, excluding non-melanoma skin cancer, in women (Table 20.1). The average number of new cases diagnosed each year was 289. During 1995-2007, there was an increase of 5% in the number of new cases diagnosed per year in RoI, while the numbers remained fairly constant in NI.
The risk of developing cervical cancer up to the age of 74 was 1 in 124 and was slightly higher in RoI than in NI. At the end of 2008, 2,484 women aged under 65 and 418 aged 65 and over were alive up to 15 years after their diagnosis.
Table 20.1 Summary information for cervical cancer in Ireland, 1995-2007
Ireland | RoI | NI | |
% of all new cancer cases | 2.0% | 2.1% | 1.8% |
% of all new cancer cases excluding non-melanoma skin cancer | 2.8% | 3.0% | 2.4% |
average number of new cases per year | 289 | 205 | 84 |
cumulative % risk to age 74 | 0.8% | 0.8% | 0.7% |
15-year prevalence (1994-2008) | 2902 | 1975 | 927 |
Cervical cancer was predominantly a disease of younger women (Figure 20.1). Almost 60% of new cases presented in those aged less than 50, and over three-quarters under 60. The pattern was similar in RoI and NI.
Figure 20.1 Age distribution of cases of cervical cancer in Ireland, 1995-2007
Cervical cancer incidence rates in 2008 were highest in the Czech Republic and Russia and lowest in Australia and New Zealand (Figure 20.2). Rates of the disease in RoI were slightly higher than the median, while in NI the rates was close to the median. Variation between countries in the percentage of cases assigned to “uterus, part unspecified” (which are not included in the data below) may account for some of the international variation.
Figure 20.2: Estimated incidence rate per 100,000 in 2008 for selected developed countries compared to 2005-2007 incidence rate for RoI and NI: cervical cancer |
 |
Source: GLOBOCAN 2008 (Ferlay et al., 2008) (excluding RoI and NI data, which is derived from Cancer Registry data for 2005-2007) |
Table 20.2 Risk factors for cervical cancer, by direction of association and strength of evidence
| Increases risk | Decreases risk |
Convincing or probable | Infection with "high-risk" types of genital human papilloma viruses (HPV)1,2 | |
Infection with human immunodeficiency virus, type 1 (HIV-1)2 | ||
Tobacco smoking3 | ||
Oral contraceptives2,4 | ||
High parity5 | ||
Low socio-economic status6 | ||
| ||
1 "high-risk" HPV types include 16, 18, 31, 33, 35, 39, 45, 51, 56, 58, 59, 66; 2 International Agency for Research on Cancer, 2011b; 3 Secretan et al., 2009; 4 combined oestrogen-progestogen formulations; 5 Castellsagué and Muñoz, 2003; 6 Faggiano et al., 1997 | ||
Many strains of human papilloma viruses (HPV) infect the genital squamous epithelia. Some strains (known as "low-risk") cause genital warts while other strains (known as "high-risk") cause cervical cancer. The association between cervical cancer and these high-risk types of HPV infection is so strong that HPV is considered to be a necessary cause of the disease (Bosch et al., 2002). Infection with high-risk HPV is very common, and most women who have been sexually active will be infected at some time during their lifetime (Bosch et al., 2008). In most women infection causes no symptoms and clears naturally within a few months. However, some women become re-infected and the virus persists; susceptibility to persistent infections is thought to increase risk of developing cervical lesions. The factor most consistently associated with risk of genital HPV infection is number of sexual partners (Winer and Koutsky, 2004).
Infection with human immunodeficiency virus, type 1 (HIV-1) is also recognised to cause cervical cancer.
As regards other risk factors, there is a causal relationship between smoking and squamous cell cancer of the cervix, which persists after adjustment for HPV infection. In the relatively few studies of adenocarcinoma and adeno-squamous cell carcinoma, no relationship with smoking has been found (International Agency for Research on Cancer, 2004b). Cervical cancer risk is raised in women who have used combined oestrogen-progestogen oral contraceptives for at least five years. Risk falls with increasing time since last use, and after 10 years returns to background levels. Risk also increases with the number of children that a woman has had (parity).
Women of lower socio-economic status have raised cervical cancer risk. While partly a function of variations in exposure to risk factors (de Sanjosé et al., 1997), this also reflects social class differences in access to cervical smear tests or participation in organised screening programmes (Segnan, 1997).
Figure 20.3 Adjusted relative risks (with 95% confidence intervals) of cancer of the cervix uteri by socio-economic characteristics of geographic area of residence | |
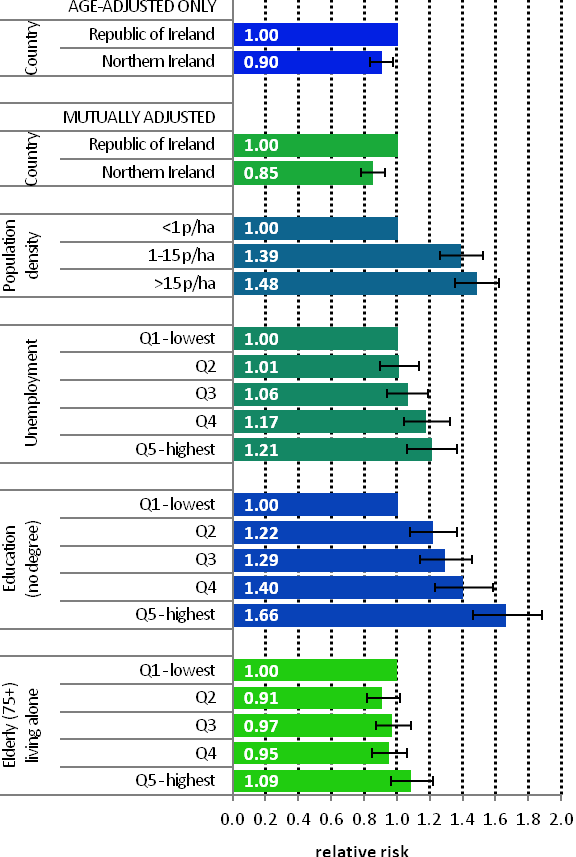 | The risk of cervical cancer was 10% lower in NI than in RoI (Figure 20.3). This difference increased to 15% when population density and area-based socio-economic factors were taken into account. Risk of cervical cancer increased with increasing population density. Those resident in areas with 1-15 p/ha had a 39% greater risk of cervical cancer than those resident in the least densely populated areas, while those resident in the areas of highest density had a 48% greater risk. Electoral wards and districts with the highest levels of unemployment had higher rates of cervical cancer than those with the lowest levels. The relative risk between the lowest and highest quintiles was 1.21 (95%CI=1.06-1.37). An even stronger association existed between lower educational attainment and cervical cancer. Women in areas with the lowest education levels had a 66% greater risk of cervical cancer than those in areas with the highest levels of educational attainment. There was no association between cervical cancer and the proportion of elderly people living alone in an area. |
The areas of highest relative risk of cervical cancer were concentrated around Dublin, southwards along the east coast to Wexford, and westwards into the midlands (Map 20.1).
Areas around Cork, Waterford, Tipperary South, Belfast, Sligo and west Galway also had higher relative risk. Lower relative risk was observed in the south-west, Mayo and most of Northern Ireland and Donegal.
Map 20.1 Cancer of the cervix uteri, smoothed relative risks
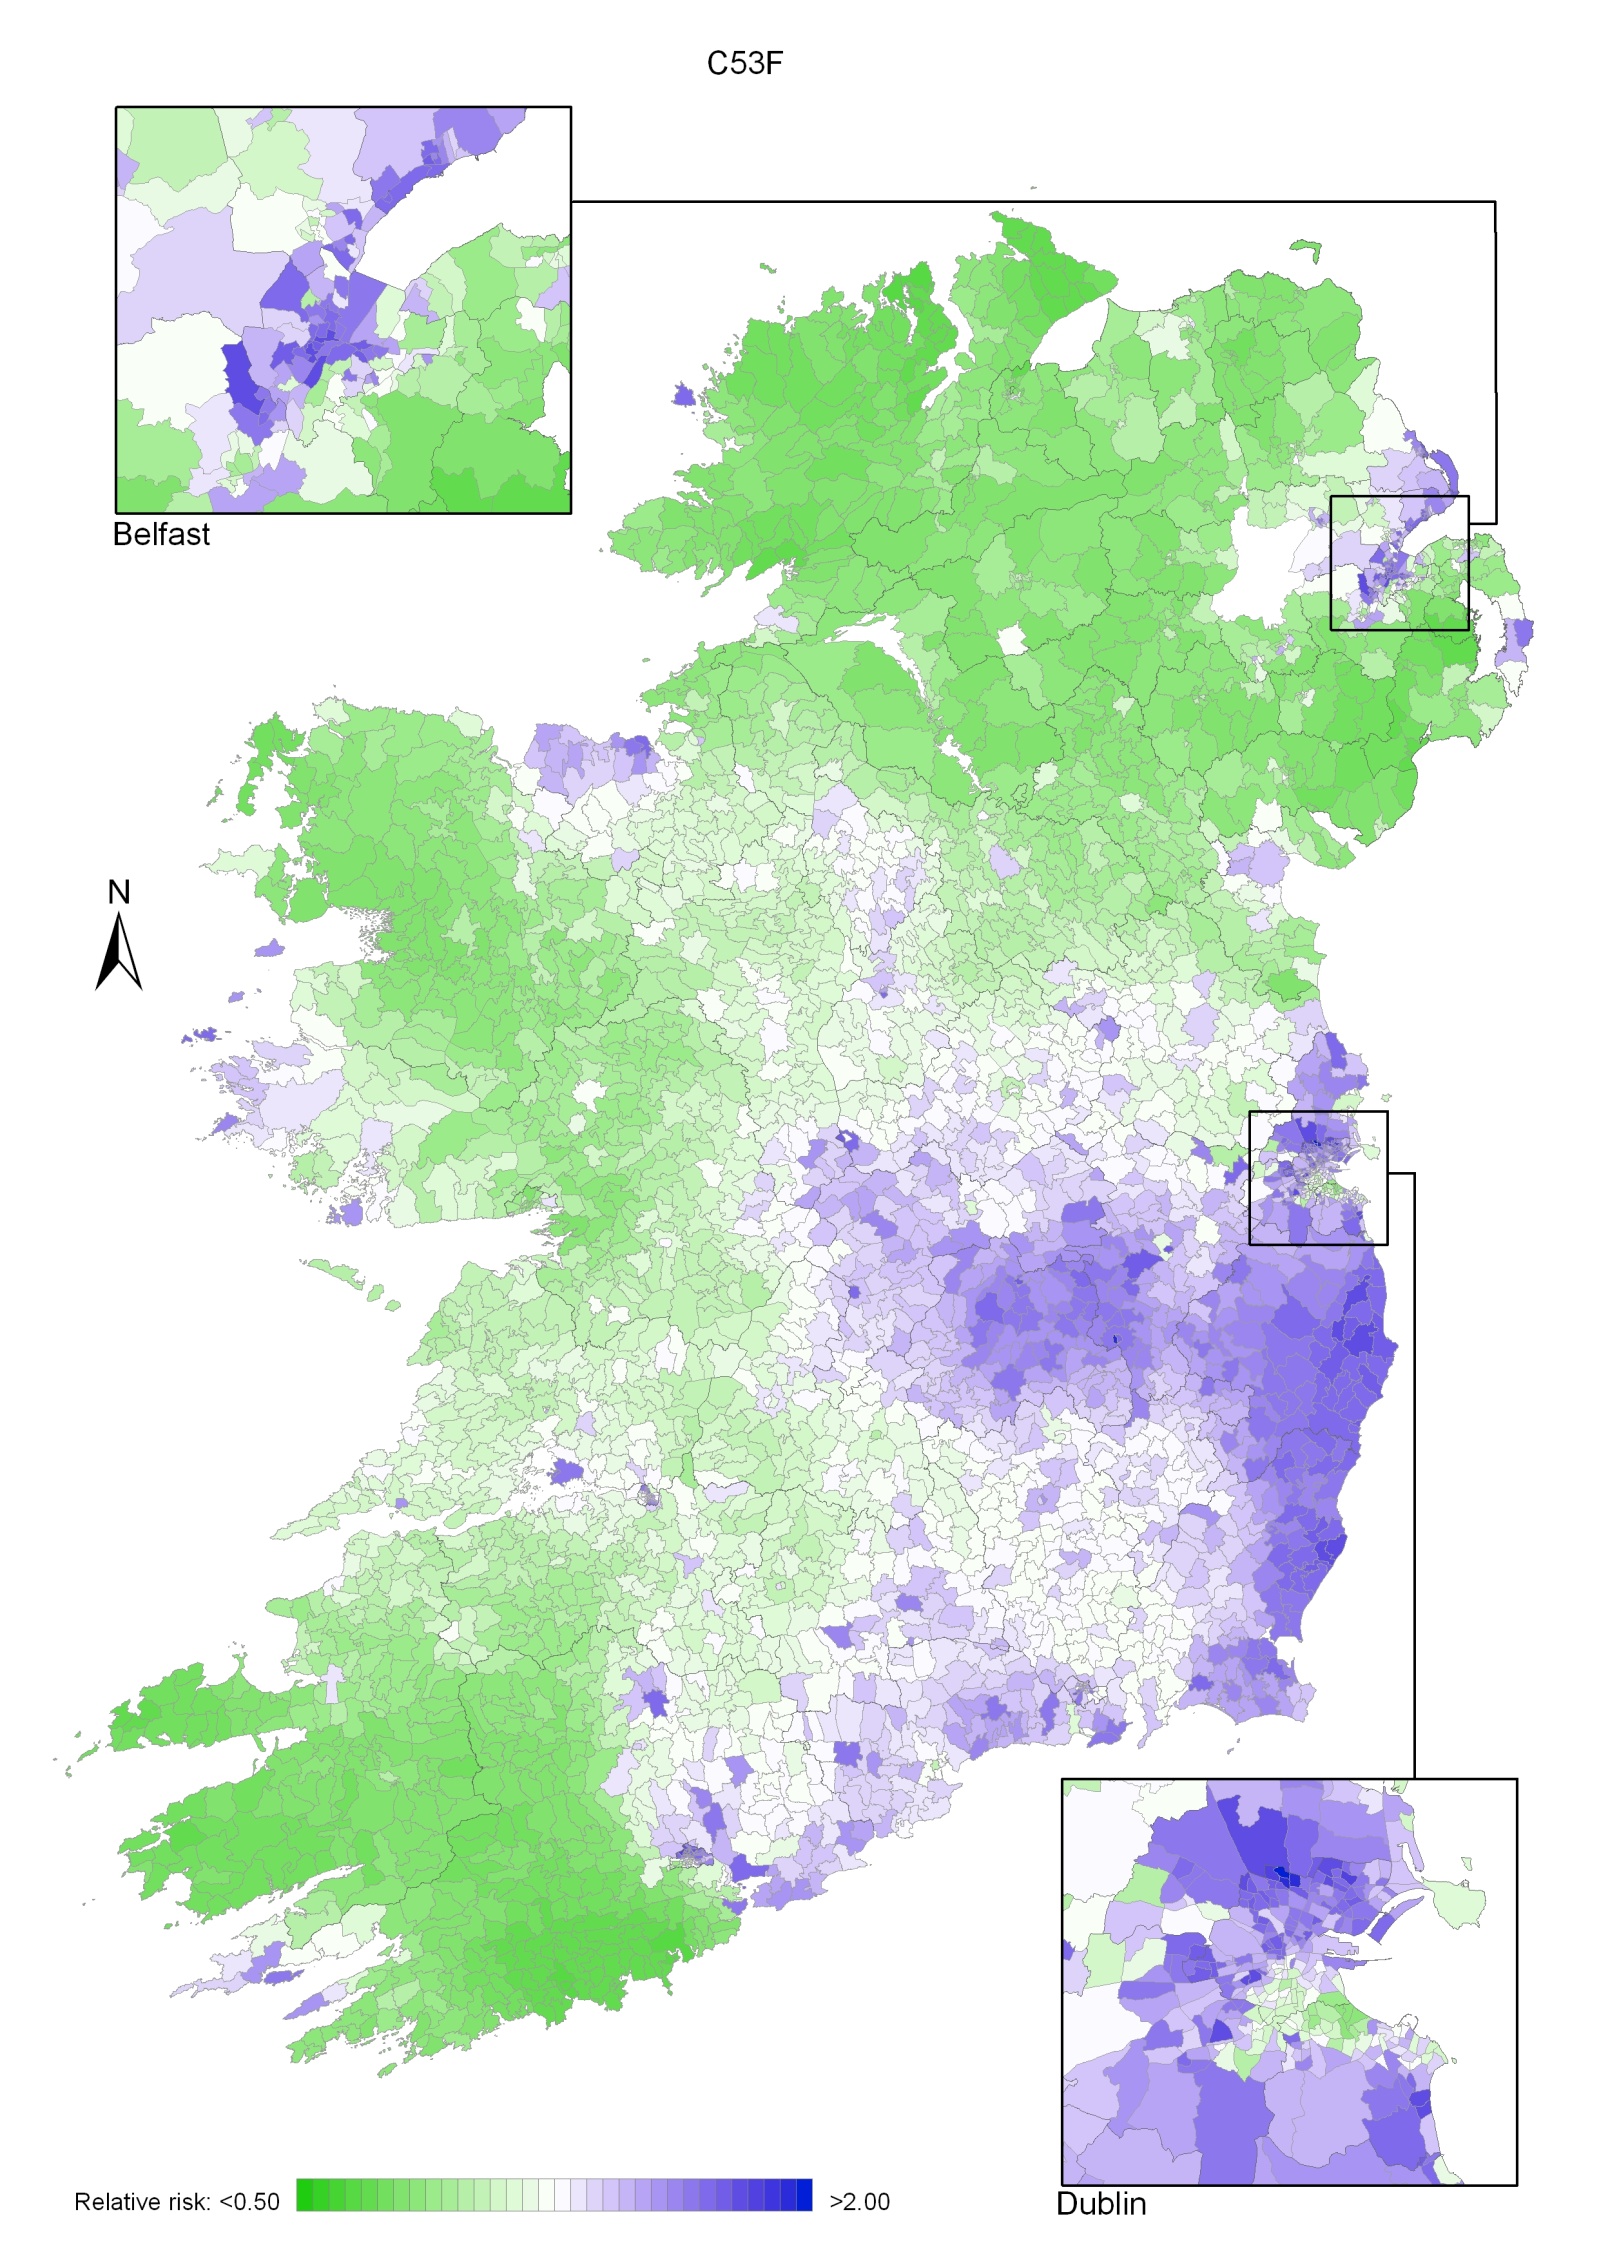
This atlas demonstrates, for the island of Ireland, many of the patterns already seen in the cancer atlas of the Republic of Ireland (Carsin et al. 2009), but the inclusion of Northern Ireland allows some geographical trends to be seen more clearly. The juxtaposition of two similar populations with different health services is also of interest. Recorded variation in cancer rates across geographical areas may be attributed to three factors—true geographical variation in the underlying risk of cancer, differences in case ascertainment and definition, and random variation. The hypothesis suggested in this atlas is that the geographical variation is largely due to variation in cancer risk.
The mapping presented in this atlas shows a wide diversity of geographical patterns of risk, many of which are difficult to interpret. Mapping demonstrated broadly similar geographical patterns for men and women for most cancers. Three cancers (pancreas, brain and other central nervous system, and leukaemia) had an increasing gradient of risk from north-east to south-west, but apart from this there was no consistent gradient of risk across the island. There was a marked geographical variation in the risk of some common cancers—melanoma and non-melanoma skin, lung, prostate, oesophagus, stomach and gynaecological cancers—but very little for others—breast, colorectal and non-Hodgkin’s lymphoma.
Overall, the relationships between socio-economic variables and cancer risk were similar for men and women. The strength of the relationship, and consequently the statistical significance, varied, but we did not observe any situation in which the effects of socio-economic factors were in opposite directions for men and women. Patterns consistent with known socio-economic gradients in cancer risk (Faggiano et al., 1997) were observed. Cancers of lung, stomach and head and neck in both sexes, colorectal, bladder and pancreas cancer in men and cervical cancer in women were all more common in areas of higher unemployment. Areas where a smaller proportion of the population had third-level qualifications had a higher risk of lung cancer (particularly in women) and stomach cancer in both sexes, and of cervical cancer and pancreatic cancer in women. Conversely, where unemployment was lower and/or educational levels higher, prostate and female breast cancer, as well as melanoma and non-melanoma skin cancer, were more common.
Most cancers were more frequent in urban areas (as measured by population density), after adjusting for the effect of age. This relationship was statistically significant for non-melanoma skin, colorectal, lung, stomach, bladder, head and neck and oesophageal cancer in both sexes and for breast, cervical, kidney and brain and other CNS cancer in women; a reciprocal relationship was seen only for prostate cancer.
We have previously noted a consistent, if weak, relationship between cancer and the percentage of people aged 65 and older living alone in RoI (Carsin et al., 2009). For this report, the cut-off point was set at 75 years and older, for compatibility between census measures in the two countries, and the relationship was not as consistently observed. However, a positive relationship was observed between increased cancer risk and an increased percentage of persons aged 75 and older living alone for non-melanoma skin, lung, breast, colorectal, stomach, pancreas, bladder, head and neck and oesophageal cancer and for leukaemia, for one or both sexes. This relationship was independent of the measures of deprivation used here, but may be a marker of area-based types of “deprivation”, such as poor diet and chronic ill-health, not identified by the conventional indices (Harrington et al., 2011; Layte et al., 2011). However, it may also be a marker of individual risk. In RoI in 2006, 46% of the population aged 75 and older was widowed and 19% unmarried, so most of those aged 75 and older and living alone are also likely to have been widowed (Central Statistics Office, 2007). Premature bereavement may be an indicator of a shared higher risk lifestyle.
The relative risk of developing many of the cancers presented here was higher in RoI than in NI. The risk of non-melanoma skin cancer, melanoma, leukaemia, bladder, pancreas and brain/central nervous system cancer was significantly higher for both sexes in RoI. For men, the risk of prostate cancer was higher in RoI and, for women, cancer of the oesophagus and cervix. In NI, the risk of lung cancer was higher for both sexes as was that of non-Hodgkin’s lymphoma, head and neck cancers and cancer of the corpus uteri for women.
The possibility therefore exists that some of these differences are due to the methods by which cases are registered. The completeness of registration is very high in both registries and differences in case ascertainment are unlikely to contribute substantially to the differences in cancer risk found. The two registries identify and code cancer cases in very similar ways and adhere to the agreed international guidelines on quality assurance in registration. However, the demarcation between frankly malignant, borderline malignant and benign cancers is not always clear. Slight variations in how these cancers are reported by histopathologists, and how these reports are interpreted by registries, may lead to systematic differences in reported incidence rates. In the course of a number of collaborative projects by the two Irish registries (Donnelly et al., 2009, Campo et al., 2004, Walsh et al., 2001) we have identified the situations in which such discrepancies might occur (e.g. for bladder and ovarian cancer) and we are satisfied that there are no significant differences between the registries in registration practices.
The element of random variation is important in interpreting geographical variation in cancer risk. By using as long a time period as possible to maximise the number of cases in each small area, and well-developed smoothing methods, we have considerably reduced the contribution of random variation. However, for areas which have very small populations, or are geographically isolated, and for some of the less common cancers, smoothing is less effective and it is likely that some of the small variations in risk shown on the maps are due to random variation in incidence, unrelated to underlying risk.
The aetiology of most cancers is a complex interplay between environmental (in the broadest sense) and genetic factors. Genetic factors might be responsible for a little of the geographical variation seen, but genetic variation is an improbable overall explanation for the patterns reported here. There is little evidence for significant heterogeneity (O’Dushlaine et al., 2008) or geographical variation (Hill et al., 2000, Dolan et al., 2005) in the genetic makeup of the Irish population, although Dolan et al (2005) report a small north-east/south-west gradient in polymorphisms of some pathogen-response-associated genes.
Differing levels of cancer detection, case-finding or screening may result in higher disease rates in one area compared with another. For example, asymptomatic prostate cancer cases will be picked up sooner and probably at a higher rate if an area has a higher level of prostate-specific antigen testing. This will result in an apparently higher risk of prostate cancer in the target population. Chronic lymphocytic leukaemia (CLL), a disease of older persons which is usually only identified by a blood test and is frequently asymptomatic, will often be detected only if the person happens to have a blood count. Increased use of CT scans of the abdomen for other illnesses will increase the detection of occult intra-abdominal cancer e.g. kidney cancer. Organised screening, for instance for breast and cervical cancer, will result in an increase in incidence at the beginning of the screening programme, and possibly for longer.
The contribution of lifestyle factors to variation in cancer risk is well known. Tobacco use is the best-established of these; it has a clear geographical pattern of prevalence in Ireland and causes the largest increase in relative risk. In addition, diet, exercise, obesity, sun exposure and alcohol use are known risk factors, the prevalence of which is also known to vary with area of residence. Since we lack detailed information on the spatial distribution of these risk factors in Ireland, in this report we have used area-based measures such as population density, unemployment and level of educational attainment as partial proxies for lifestyle. Where data (however limited) on geographical variation in known risk factors was available we present it below.
Smoking is clearly established as a cause of many cancers (Secretan et al., 2009). The highest smoking prevalence in NI in 2010 (26% for men and 28% for women) was in the Western Health and Social Services Board¶ (HSSB) (Northern Ireland Statistics and Research Agency, 2010b) (Figure 21.1). The lowest smoking prevalence for men (22%) was in the Northern HSSB and for women (19%) in the Southern HSSB.
In RoI in 1998 smoking prevalence was 32% for men and 31% for women. By 2003 these had fallen to 30% and 27% respectively (Office of Tobacco Control, 2010). In RoI, there was a clear geographical pattern in 2003, with overall prevalence in Dublin at 32%, in the rest of Leinster¶ 29%, in Munster 27% and in Connacht 25%. However by 2010, smoking prevalence was highest in the RoI Health Service Executive (HSE) South region¶ (which covers much of Munster) (Figure 21.1) (Office of Tobacco Control, 2010).
| Figure 21.1 Smoking prevalence in Health and Social Services Boards and HSE regions, 2009-2010 |
 |
Figures refer to the population aged 15 years and over in RoI and 16 years and over in NI. |
While smoking prevalence in 2003 can have no direct bearing on cancer risk in 1995-2007, due to the lag time for development of cancer, these geographical patterns are likely to reflect long-term differentials. Looking at the tobacco-related cancers, the geographical distribution of lung cancer clearly reflects the higher cigarette consumption in the east of RoI, as does that for cervical cancer. Cancers of oesophagus and bladder also have an east-west gradient, but this is less marked, consistent with their more complex aetiology.
Alcohol has been established as a causative factor in breast, colorectal, head and neck, pancreatic and oesophageal cancers (Secretan et al., 2009). In NI, the percentage of drinkers exceeding the “sensible” weekly limits in 2008 was highest in the Eastern HSSB (28%), and lowest in the Southern HSSB (20%) (Department of Health, Social Services and Public Safety, 2008). There was some geographical variation in the prevalence of alcohol consumption in 2007 in RoI (Morgan et al., 2009). The highest prevalence was in Dublin, with 84-85% regular drinkers, followed by Cork and Kerry (76%), with a fairly even prevalence in the rest of the country of 73-74%.
Alcohol-related cancers had a variety of geographical patterns. Colorectal cancer was commonest in the south, and in the east around Dublin and in much of NI for women, breast cancer was most common in the east, pancreatic cancer in the south-west and oesophageal cancer in the east and south. There was no overall geographical pattern for head and neck cancers. The pattern of oesophageal cancer risk was closest to that of higher alcohol consumption, but, as with tobacco, it cannot be assumed that current consumption patterns reflect of those two decades ago.
Obesity has been shown to be a risk factor for breast, colorectal, pancreas, kidney, oesophagus, and corpus uteri cancers, and may be a risk factor for NHL, melanoma, leukaemia and cancers of prostate and ovary (World Cancer Research Fund/American Institute for Cancer Research, 2007).
In 2005-2006 levels of obesity (measured, not self-reported) were higher overall in RoI than in NI (Figure 21.2) and, within RoI, in the west and south-west (Morgan et al., 2009). In NI the prevalence of obesity was highest in the Southern HSSB (Northern Ireland Statistics and Research Agency, 2010b). The lowest levels of obesity were in urban areas—Dublin in RoI and the Eastern HSSB (which includes Belfast) in NI, and in the Mid-West region in RoI.
| Figure 21.2 Percentage of Irish population who were overweight or obese, by area of residence, 2005-2006 |
 |
Note: The regions shown for NI are Health and Social Services boards and for RoI the NUTS level 3 regions (see Appendix table A4.1). |
The two main infective causes of cancer in the Irish population are Helicobacter pylori, which causes stomach cancer and human papilloma virus (HPV), which causes cervical cancer, some head and neck cancers and non-melanoma skin cancers.
The reported prevalence of H pylori in a random sample of 1000 blood donors in RoI in 1998 was reported as 43%, and 62% in those aged 46-60 (Buckley et al., 1998). 504 individuals aged 35 to 74 sampled in Cork and Kerry in 1997/1998 had a prevalence of 61% (Sheehan et al., 2005a) and in a sample from a population study of cardiovascular risk in NI in 1986/1987 the prevalence was 50% overall and 67% in those aged 45-59 (Murray et al., 1997). A survey of 104 Irish university students (Sheehan et al., 2004b) yielded a prevalence of 59%, a very high value for a young cohort. The NI samples showed a clear social class gradient, with a prevalence of 43% in social class I and 68% in social class V. Inadequate sanitation and crowded housing appear to be related to higher rates of H pylori infection (Brown, 2000).
HPV prevalence in a sample of women presenting for cervical screening in the Dublin area of RoI in 2004-2005 was reported as 19.8% (Keegan et al., 2007). No information has been published on geographical variation in infection rates in RoI. The crude prevalence of high risk HPV for women in the NI Screening programme was reported to be 18.1% in 2008 (personal communication)
For other important aetiological factors—including UV exposure, patterns of child-bearing and use of medications such as hormone replacement therapy, oral contraceptives and non-steroidal anti-inflammatory drugs—little information is available on geographical or socio-economic variation in prevalence, and most of what exists (Boyle et al., 2010; Corcoran et al., 1996) pertains to recent periods. Information on occupational and environmental exposures is equally scanty.
A number of surveys of diet, lifestyle and physical activity have been published in RoI (Friel et al., 1999; Kelleher et al., 2003; Harrington et al., 2008; Morgan et al., 2008; Morgan et al., 2009) but contain very little information on geographical variation in risk factor prevalence other than for the largest geographical units.
¶ Information on Health and Social Services boards, provinces, health service regions, and their constituent counties and district councils, is given in Appendix table A4.1.
The risk of non-melanoma skin cancer (NMSC) was highest in two types of area—in and around the major urban centres in RoI (but not around Belfast and Derry in NI) and in a number of coastal areas in both RoI and NI. The aetiology of this cancer is better understood than that of most other cancers. Apart from some uncommon exposures—immunosuppressants, arsenic—NMSC in light-skinned people is caused by UV exposure (International Agency for Research on Cancer, 1992; Armstrong and Kricker, 2001). A survey of urban dwellers in RoI in 1991 showed that the great majority were light-skinned and at high risk of skin cancer from UV exposure (Gibson et al., 1997). No information is available on the geographical distribution of skin types within Ireland.
UV exposure may be recreational, including sunbed use (Karagas et al., 2002; Boyle et al., 2010), or occupational—the main occupations involved in the past being farming, fishing and building work. Gibson et al. (1997) found that 16% of their sample had used sunbeds. Higher recreational exposures have been reported among the more affluent in Ireland (Corcoran et al., 1996; Boyle et al., 2010). In a random sample of 2,200 people in NI, subjects with higher education attainment were more likely to report that having a suntan made them feel “healthier” or “more attractive”, and to have used sunbeds in the past. 20% of the sample had used sunbeds in 2008, down from 28% in 2000. A survey in 1993 of people taking “sun holidays” from Dublin airport, 11% of whom lived in NI, showed a predominance of professional and non-manual workers, with only 11% describing themselves as “manual workers”, compared to 31% in the general population in the 1991 census (Corcoran et al., 1996).
The distribution of men involved in farming, fishing and other agricultural work is likely to vary considerably across the island, and is a possible explanatory factor for geographical variation in NMSC risk. As NMSC development requires long UV exposure, we looked at the occupational distribution by county as given in the 1981 censuses, 20 years before the midpoint of the period covered by this report (Central Statistics Office, 1986; Northern Ireland Statistics and Research Agency, 1982). Table 21.1 shows the percentage of men reported as being involved in outdoor occupations (with the exception of the building trades, for which there was no separate category) in 1981 (Central Statistics Office, 1986; Northern Ireland Statistics and Research Agency, 1982). It is noticeable that the highest percentages in these occupations were in mostly inland counties of RoI, and the lowest in NI and there seems to be no relationship at county/district council level to the distribution of NMSC risk.
Table 21.1 Percentage of male population in Ireland employed in agriculture, forestry and fishing, 1981 | |||
county/district council | % of population aged 15 and over employed in agriculture, forestry and fishing | county/district council | % of population aged 15 and over employed in agriculture, forestry and fishing |
|---|---|---|---|
Roscommon | 34% | Omagh | 13% |
Leitrim | 34% | Wicklow | 13% |
Cavan | 33% | Kildare | 13% |
Mayo | 31% | Dungannon | 13% |
Longford | 28% | Magherafelt | 12% |
Monaghan | 27% | Armagh | 12% |
Tipperary | 26% | Strabane | 12% |
Clare | 26% | Banbridge | 12% |
Galway | 26% | Limavady | 10% |
Kerry | 25% | Newry and Mourne | 9% |
Laois | 25% | Down | 9% |
Sligo | 24% | Louth | 9% |
Kilkenny | 23% | Ballymena | 8% |
Wexford | 23% | Ards | 7% |
Donegal | 21% | Coleraine | 7% |
Meath | 21% | Antrim | 6% |
Offaly | 20% | Larne | 6% |
Carlow | 20% | Lisburn | 4% |
Westmeath | 18% | Craigavon | 4% |
Fermanagh | 16% | Derry | 3% |
Moyle | 16% | Newtonabbey | 2% |
Cork | 16% | Carrickfergus | 2% |
Limerick | 15% | Castlereagh | 2% |
Waterford | 15% | Dublin | 1% |
Cookstown | 14% | North Down | 1% |
Ballymoney | 14% | Belfast | <1% |
Ascertainment bias may account for part of the apparently higher NMSC risk in urban areas. NMSC is relatively asymptomatic and rarely fatal, which makes it likely that a significant number of cases escape medical attention. Rural populations are further from their GP (Teljeur et al., 2010) and are known to make less use of medical services, in RoI at least (Morrissey et al., 2008) and this may account for some of the difference. In Ireland as a whole, there was a clear correlation between higher NMSC risk and area measures of affluence such as higher educational attainment (both sexes) and higher employment (men). This relationship may be due to a greater use of medical services (both primary and secondary care in more educated and/or more prosperous populations. People with lower incomes are significantly less likely to be referred to a specialist (van Doorslaer et al., 2006; McBride et al., 2010).
The coastal pattern has no obvious explanation. Some of the areas of higher risk coincide with the location of fishing ports (Map 21.1) (Department of Agriculture and Rural Development, 2011; Department of Agriculture, Fisheries and Food, 2011) but the low numbers employed in fishing and the similarity of patterns between men and women make fishing an unlikely explanation. Migration of retired people to seaside areas also seems unlikely to have occurred at a rate which would explain the large differences in risk observed. Relatively few areas of high NMSC risk exist in areas of low sunshine (Map 21.2); however the relationship between higher sunshine levels and NMSC risk is not consistent. Areas in the south-east with high sunshine levels (by Irish standards) have low NMSC risk (Map 21.2). The higher risk in north and west Kerry and in Newry and Mourne is difficult to explain solely in terms of annual sunshine. Other factors related to coastal location may play a part. Areas around the coast may be less shaded from the sun and may also have features such as coastal walks, mountains etc. that draw residents out of their homes more, and for longer periods.
| Map 21.1 Relative risk of non-melanoma skin cancer (both sexes) and location of larger fishing ports | |
| relative risk of non-melanoma skin cancer (both sexes) | location of larger fishing ports |
 |  |
| Map 21.2 Relative risk of non-melanoma skin cancer (both sexes ) and annual sunshine 1961-1990 | |
| relative risk of non-melanoma skin cancer (both sexes) | annual sunshine 1961-1990 |
| 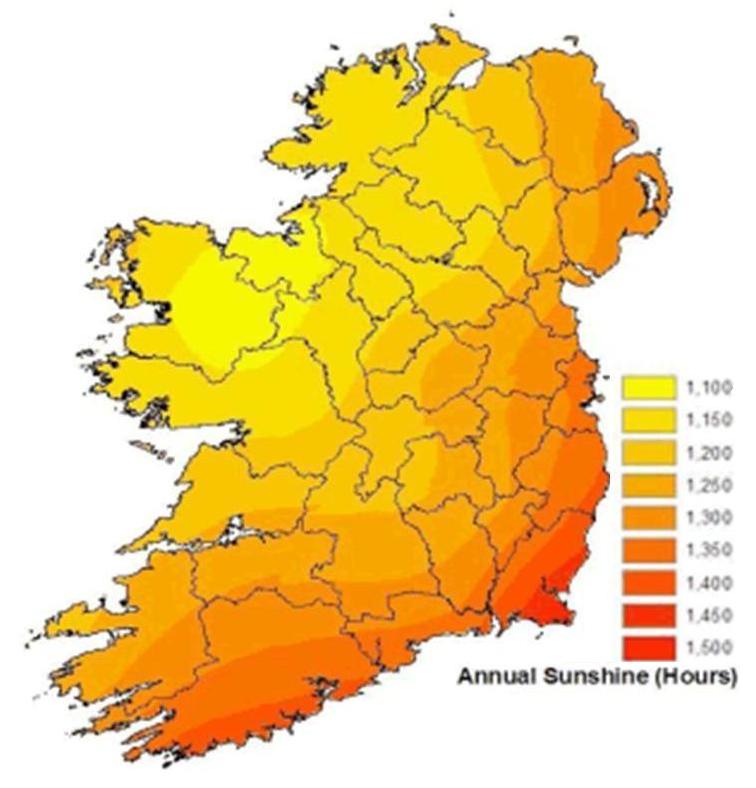 |
Note: Sunshine data from Met Eireann http://www.met.ie/climate-ireland/sunshine.asp [3] | |
The major aetiological factor for breast cancer is lifetime average oestrogen exposure, from both endogenous and exogenous sources (Veronesi et al., 2005 Key et al., 2001, International Agency for Research on Cancer, 2011a). Protection is afforded by breastfeeding and full-term pregnancies at an early age. Increased risk has been shown to be positively related to affluence. This relationship is likely to be due to a number of reasons, including patterns of childbearing, post-menopausal use of hormone replacement therapy and obesity. The average age at first birth in RoI fell from 27.5 in 1975 to 24.8 in 1995, but rose thereafter to its 2009 level of 29.1. In the 1990s, age at first birth tended to be higher in the west of RoI and relatively low in NI, with the exception of Castlereagh, North Down and Ards (Map 21.3).
Map 21.3 Average age of mother at first birth, RoI 1989-1998, NI 1997-1998
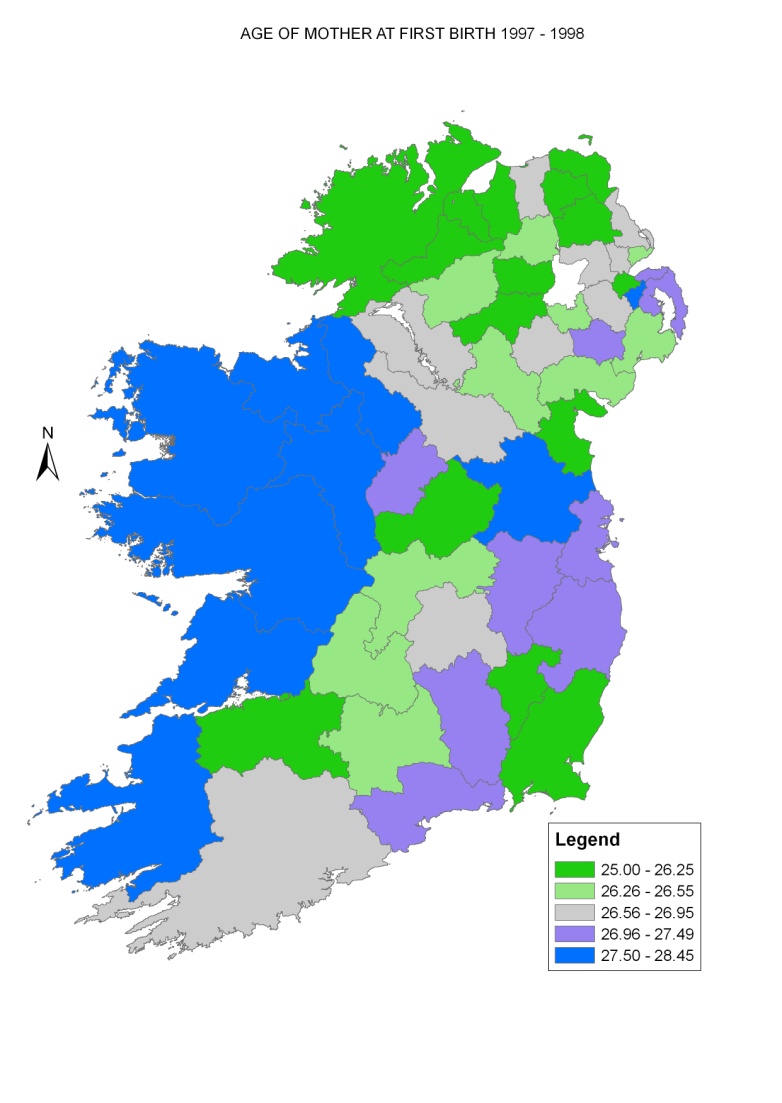
The relationship between employment levels and breast cancer risk found here was modest; that with educational levels was stronger. However, ascertainment bias due to screening may have had the effect of masking the relatively modest differentials in risk caused by socio-economic factors. The overall variation in risk across Ireland was relatively small.
Map 4.2 shows a clear gradient in 1995-2001 between higher risk in NI, where breast screening began in 1989 (HSC Public Health Agency, 2011), and lower risk in RoI, where screening began only in 2000 (National Cancer Screening Service, 2010) and then only in the eastern half of the country. Observed incidence rates were higher in NI up to 2000, but became higher in RoI from 2001 on (National Cancer Registry, 2011, Donnelly et al, 2010) (Figure 21.3). The introduction of population-based breast screening is the most likely explanation for the increase in incidence in RoI (Møller et al., 2005).
In both countries, socio-economic and geographical differences in incidence may also result from variations in screening coverage and compliance. Given the long history of breast screening in NI, the higher risk seen north and east of Derry, to the east of Belfast and in Newry and Mourne is likely to reflect a true difference in risk rather than an artefact due to screening. In RoI, in the period before organised screening began, the risk was higher in urban areas and, in Dublin, in the more affluent areas to the east and south of the city. Once population-based screening was established in RoI the areas of higher risk became more extensive. The area of higher risk in south Dublin seen during 1995-2001 was much less defined in 2002-2007, and extended to cover most of Dublin, Kildare, Louth and Meath. An area of above-average risk can also be seen in a triangle bounded by Cork, Waterford and Athlone. However, many areas in the east which would have been covered by screening in the east did not show as great an increase in relative risk.
Figure 21.3 Trends in female breast cancer incidence for RoI and NI 1994-2009 (European age-standardised incidence rates ± 95% confidence limits)
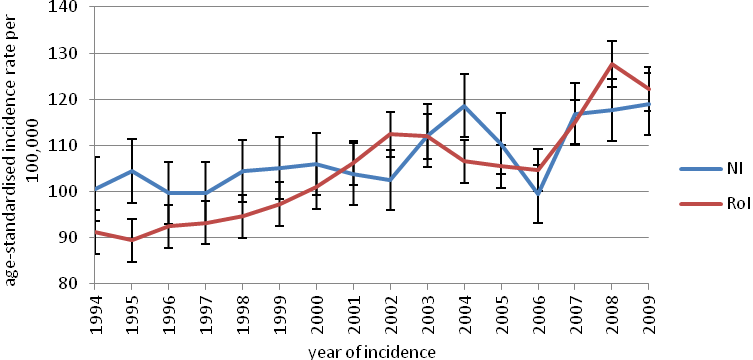
The aetiology of colorectal cancer is multifactorial, with lifestyle having a major role; smoking (colon cancer only) (Secretan et al., 2009), alcohol (Secretan et al., 2009), obesity (International Agency for Research on Cancer, 2002), some aspects of diet and physical inactivity (World Cancer Research Fund/American Institute for Cancer Research, 2007) have been shown to be risk factors, while use of hormone replacement therapy and oral contraceptives (International Agency for Research on Cancer, 2011a) and non-steroidal anti-inflammatory drugs (International Agency for Research on Cancer, 1997) have been shown to be protective. RoI had a slightly higher risk for men than NI, when adjusted for factors such as population density and unemployment. The risk was correlated with population density and unemployment for men, but there was only a modest variation in risk across the island. The area of higher risk in Cork and along the south coast was common to men and women. An area of higher risk across most of NI (apart from the area around Belfast) and in Donegal, and of low risk in Connacht, was seen for women only while the areas of higher risk in Dublin, Meath and Louth were seen for men only . As the incidence of colorectal cancer is considerably higher in men than in women, the prevalence of important aetiological factors seems to be different for the two sexes, or at least to affect risk in different ways. One difference suggested has been the protective effect of hormone replacement therapy and oral contraceptives (dos Santos Silva and Swerdlow, 1996). We do not have enough information on the geographical variation of these factors between the sexes to be able to interpret the geographical patterns shown; however the higher overall female risk in rural NI and around Cork is worthy of further investigation.
Smoking is the single most important risk factor for lung cancer (International Agency for Research on Cancer, 2004b), and the distribution of the cancer is likely to closely mimic that of smoking prevalence 15-20 years before the period reported here; that is, between 1975 and 1987. However, there is little available information on smoking prevalence for that period. Lung cancer risk was slightly higher in NI and showed the expected correlation with higher population density, higher unemployment and lower educational attainment. In NI the geographical pattern of lung cancer was similar for both sexes, and the higher risk was largely confined to Belfast, Derry and Newry. In RoI there were four areas of higher risk outside the main urban areas—in south Kildare and south Wicklow, around Mullingar in Westmeath and in south-east Limerick. The areas of higher risk for women were more concentrated along the east coast than those for men.
Radon levels may explain some of the geographical variation in risk, but as noted in a previous report (Carsin et al., 2009), there was no apparent correlation between areas of high lung cancer risk in RoI and average household radon levels. A lack of relationship between lung cancer risk and area measures of radon exposure has been a consistent finding of ecological studies (Puskin, 2003), partly because of the strong confounding effect of smoking (which is responsible for over 90% of lung cancers) and partly because individual exposures to radon are poorly correlated to area averages.
Relatively little is known of the role of lifestyle and other potentially modifiable factors in prostate cancer aetiology, despite intensive investigation. The use of prostate-specific antigen (PSA) testing on a widespread scale in asymptomatic men has uncovered large numbers of occult carcinomas and has led to increases in incidence rates all over the developed world (Quinn and Babb, 2002). In Ireland, the prostate cancer incidence rate increased markedly over the study period. The consequence has been to mask any differences in underlying risk. The risk of prostate cancer was considerably higher in RoI than in NI and, unlike almost every other cancer, the risk had an inverse relationship with population density. The risk of prostate cancer was also higher in areas with higher education levels.
Mapping of prostate cancer risk in 1995-2001 showed a relatively lower rate of risk in NI compared to RoI and, in RoI, a patchy distribution with no overall pattern. While the rate was high in and around some urban areas, in others (e.g. Limerick) there was no evidence of increased risk. In Dublin, there was a markedly higher risk in the south, and especially the south-west, of the city. This distribution had a closer resemblance to patterns of educational attainment than to unemployment (see Maps 2.4 and 2.5). In 2002-2007 the spatial pattern in RoI showed, to a large extent, an extension of the areas of higher risk to the more rural parts of the country and a lessening of the north-south differential in Dublin city. In NI, some areas of higher risk in the west had disappeared in the later period, but this may be an artefact due to the fact that risk in other areas had increased in 2002-2007.
Although the GP referral guidelines from the National Cancer Control Programme (RoI) (Health Service Executive, 2011) state that “PSA testing of asymptomatic men or PSA screening is not national policy” this seems to have had only a limited impact on practice in RoI, where PSA testing was at a very high level during the period covered by the atlas (Drummond et al., 2010). The differences in overall prostate cancer risk between RoI and NI seem to be determined by higher rates of PSA testing and a lower threshold for prostate biopsy in RoI (Carsin et al., 2010). The changes in geographical patterns of risk within RoI are likely to reflect changes in testing and biopsy rates, due to a combination of awareness and implementation of policy by GPs, demands by patients and investigation rates by specialists. Of interest is the noticeable fall in relative risk between 1995-2001 and 2002-2007 in the former RoI South Eastern Health Board area (counties Waterford, Kilkenny, Wexford, Carlow and Tipperary South). It would be interesting to investigate which, if any of the factors listed above were responsible for this change.
Non-Hodgkin’s lymphoma consists of a number of malignancies of the lymphatic system with differing patterns of incidence by age and sex, differing clinical courses and probably differing aetiologies. Both men and women in NI had a higher risk, but this was statistically significant only for women. There was little variation in risk by any of the socio-demographic variables studied. Geographical variation in risk was modest. The overall geographical pattern was the same for men and women, although more obvious for women, with an area of highest risk in eastern NI, extending through Louth and Meath to north Co. Dublin.
Stomach cancer risk, which is linked to diet (World Cancer Research Fund/American Institute for Cancer Research, 2007), smoking (Secretan et al., 2009) and H pylori infection (International Agency for Research on Cancer, 1994) was strongly correlated with higher population density, higher levels of unemployment and lower levels of educational attainment, for both men and women. Crowded housing appears to be related to higher rates of H pylori infection (Brown, 2000), consistent with the observed association with population density. There was no significant difference in risk between NI and RoI. Overall geographical variation was marked, and similar for men and women. For women a band of higher risk was seen from north Dublin, through Louth, Cavan, Monaghan and west Fermanagh to Donegal. This increased risk was almost entirely on the RoI side of the border. For men, there was no area of increased risk in Fermanagh, and the high relative risk was almost entirely confined to RoI. For both men and women there was an area of higher risk in Belfast city (which presumably explains the similar risk in RoI and NI despite the pattern described above) and for women a few isolated areas of higher risk in west Kerry, west Galway and Wicklow.
As H pylori is easily diagnosed and treated, the relationship between H pylori prevalence rates and geographical variation in stomach cancer should be investigated at a community level.
As with non-melanoma skin cancer (NMSC), UV exposure causes melanoma of the skin (International Agency for Research on Cancer, 2001; Armstrong and Kricker, 2001). However, screening or case-finding may increase the number of early lesions detected and may confound the effects of sun exposure to some extent. As it is generally accepted that NMSC risk depends largely on lifetime exposure to UV radiation, while melanoma is related to recreational and intermittent exposure (International Agency for Research on Cancer, 2001; Armstrong and Kricker, 2001), it would be expected that their distribution patterns would differ somewhat.
| Map 21.4 Relative risk of melanoma 1994-2007 and annual sunshine hours 1961-1990 | |
| Relative risk of melanoma (both sexes ) | Average hours of sunshine 1961-1990 |
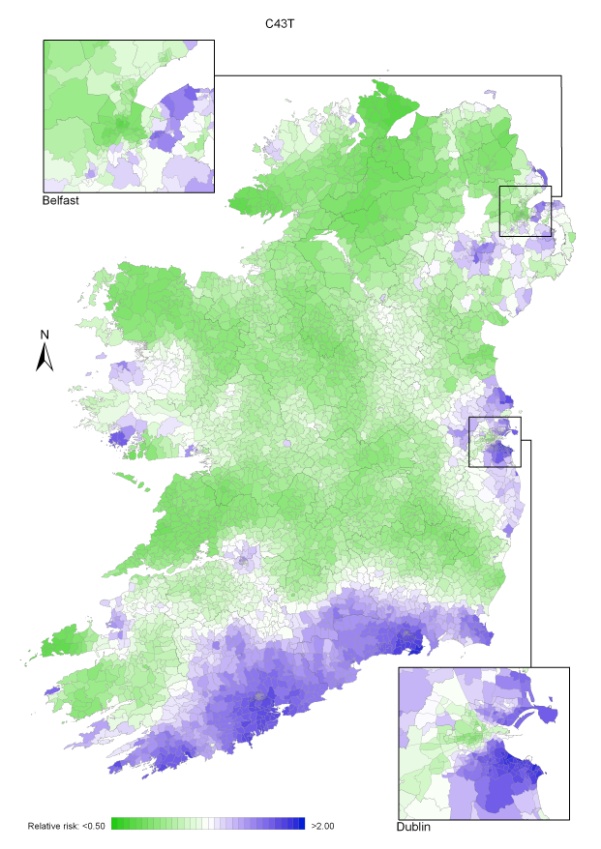 | |
| Source: Sunshine data from Met Eireann http://www.met.ie/climate-ireland/sunshine.asp [3] | |
As with NMSC, there was a higher risk in RoI than in NI; melanoma had a weaker relationship to population density and a stronger relationship to measures of affluence, than did NMSC. Because the number of cases was much lower for melanoma, small geographical variations in risk have been smoothed to a greater extent than for NMSC. Nevertheless, both similarities and differences can be seen. There was an area of high melanoma risk to the east of Belfast for both men and women which was not seen for NMSC, with a second area of higher risk around Craigavon. In NI, these areas are close to hospitals and may reflect case finding.
In RoI there was a clear band of higher risk running from south Wexford through Waterford to west Cork for both men and women, but the areas of higher risk observed for NMSC along the western seaboard were much less in evidence, especially for men. The pattern of risk in Dublin was similar to that for NMSC, with higher risk to the north and south of the city centre.
Despite the possible role of detection, ascertainment bias is unlikely to have played a major role in the geographical variations seen here and, as with NMSC, it is difficult to interpret the patterns either in terms of susceptibility, or of natural UV exposure at the place of residence. The socio-economic variation, and geographical variation in Belfast and Dublin, is almost certainly due to difference in holidaying practice two decades ago (Corcoran et al., 1996), but the higher risk along the south coast is more difficult to explain. However, there appears to be a stronger relationship with average sunshine levels than was seen for non-melanoma skin cancer (Map 21.4). A similar north-south gradient in melanoma risk has been reported in England (Quinn et al., 2005).
The risk of bladder cancer in RoI was higher than in NI. The risk of bladder cancer increased with population density but had only a weak relationship to unemployment or education levels for either men or women. For women, there were areas of higher risk in and around the major urban areas of Belfast, Dublin, Cork and Limerick, but not Derry or Galway. The area of higher risk around Limerick was unusual, as Limerick was not consistently among the urban areas with higher risk for other cancers. There was no clear geographical distribution in Dublin, but in Belfast the highest risk was in the east and central part of the city. An almost identical urban pattern was seen for men.
Outside the cities, both men and women had a higher risk on the east coast from Dublin to Wicklow, particularly for men, and in north and west Kerry, particularly for women. There was a high male risk in Donegal and the Ards peninsula, much less so for women.
Bladder cancer risk has been strongly linked to tobacco smoking (Secretan et al., 2009) and there was a limited degree of similarity between the distribution of lung cancer and bladder cancer. Occupational exposure is also an important risk factor (Baan et al., 2009). While most exposures are now controlled, historical exposure to occupational carcinogens (for instance in the chemical, rubber, dyeing and tanning industries) may be responsible for some of the variation seen; there is little information on historical exposures in Ireland.
Head and neck cancer is a heterogeneous group of cancers, but with a largely shared aetiology in tobacco and alcohol use (Secretan et al., 2009). In recent years, human papilloma virus infection is likely to have been responsible for an increasing number of cases, particularly cancers of the tonsil (International Agency for Research on Cancer, 2011b).
The risk of head and neck cancer was higher in NI for women but not men. For both sexes there was a strong relationship to unemployment levels, but not to education. For women there was a band of higher risk extending from north Dublin through Louth into Fermanagh. The areas of highest risk, however, were around Belfast, Derry and on the Inishowen and Dingle peninsulas.
For men, the geographic pattern was very different to that observed for women. There was a patchy distribution of higher risk areas, including most major cities and adjoining areas and a number of sparsely populated areas along the west coast. The pattern of risk more closely resembled that of bladder cancer than lung cancer.
The patterns seen most likely reflect a complex interaction between smoking and alcohol use. The consumption of home-distilled alcohol (poitín) in the past may also have been a factor in rural areas. Dentists have a role in detection of pre-malignant lesions and early oral cancers; residents of more deprived areas (Lang et al., 2008) and those with primary education only (Woods et al., 2009) use dentists less and this may be a factor in areas of higher risk.
There was a markedly higher risk of leukaemia in RoI than in NI, a surprising finding given the low level of international variation in Europe and the paucity of modifiable risk factors, other than smoking (Secretan et al., 2009). Some ascertainment bias may exist with respect to chronic lymphocytic leukaemia (CLL), which comprises over 40% of all leukaemias, affects older patients and may be asymptomatic for much of its course. It is often detected only through routine blood counts and only picked up if the individual presents to clinical services. However, it is not clear how these factors would differ between NI and RoI. We could find no information on either GP consultation rates or routine blood count rates for older persons in NI and RoI. Socio-demographic variables were poorly correlated with leukaemia risk; the risk was higher especially for men and women in areas with a higher proportion of older persons living alone. The significance of this finding is obscure.
For both men and women the geographical pattern was of a smooth gradient in risk; lowest in the north-east and highest in the south-west. For men in particular the area of highest risk seemed to centre on Limerick and Clare rather than the extreme south-west and for both sexes there was a secondary area of higher risk extending from south Dublin to Wexford, with the highest risk around Wicklow town.
The north-east to south-west gradient could possibly be due to differences in health service utilization between NI and RoI which impacted on detection of asymptomatic CLL. However, when such a difference between countries was simulated in the smoothing process it gave rise to a much sharper gradient in risk at the border than was seen in the leukaemia maps.
The risk for pancreatic cancer, which is associated with tobacco and heavy alcohol use (Secretan et al. 2009), was significantly higher in RoI than in NI for men and women. Pancreatic cancer is rapidly fatal and the diagnosis is not always confirmed before death, so there is more uncertainty with regard to the reliability of diagnosis than for most other cancers. However, mortality rates in 1995-2007 were also higher for both men and women in RoI than in NI (International Agency for Research on Cancer, 2011c).
For men, the risk fell (but not significantly) with increasing population density but increased with increasing unemployment. For women, on the other hand, the risk was unrelated to population density or unemployment but was higher in areas with a lower level of educational attainment.
The overall geographical pattern was, however, similar for men and women—a smooth gradient from the lowest levels in the north-east to the highest in the south-west, centred, for women, in north Kerry and, for men, on Cork city. For women, there appeared to be a higher risk in central and north Dublin city, but a uniformly low risk in Belfast. For men, the risk in Dublin city was low relative to the rest of the country; although the risk was also low in Belfast, the city centre had a slightly higher rate than the outskirts.
The important aetiological factors for kidney cancer are smoking (Secretan et al., 2009) and obesity (World Cancer Research Fund/American Institute for Cancer Research, 2007). The risk of kidney cancer was slightly (but not significantly) lower in NI than in RoI for men, but not women. There was a weak upward trend in risk with population density for women but no other relationship to socio-demographic variables.
While for both sexes there was an area of higher risk along the east coast—in Wicklow, Dublin, Meath and Louth—the overall pattern of risk was different for men and women. For women, there was an extensive area of higher risk in northern NI, while for men the risk in NI was lower, apart from Fermanagh. For men there was an extensive area of higher risk in the east midlands, extending into Galway, with the highest risk in Offaly. There was no clear intra-urban pattern for either sex.
Increasing numbers of kidney cancers are being detected incidentally in the course of abdominal scans for other disease (Hock et al., 2002; Falebita et al., 2009) and this may affect geographical patterns.
Cancer of the oesophagus consists of two main histological types—squamous carcinoma and adenocarcinoma—which differ somewhat in their underlying causes. While both are related to tobacco and alcohol consumption (Secretan et al., 2009), only adenocarcinoma is related to obesity (World Cancer Research Fund/American Institute for Cancer Research, 2007). As the analyses in this atlas combine these cancer types, this might have obscured some patterns specific to one or other histological type.
For both men and women there was an increase in risk with increasing population density and for men, a weak relationship to unemployment.
The pattern of distribution of oesophageal cancer was similar for men and women. The highest risk in the urban areas was in Dublin and Belfast city centres, although the female risk was lower in Belfast than Dublin. There was no area of high risk associated with other urban centres, other than the region around Cork.
Outside Dublin and Belfast, there seemed to be three main foci of higher risk—the largest around Cork city, extending, for women, to the east and west and, for men, to the north, into Tipperary. The second focus was in south Dublin and Kildare and was more defined for men than for women. The third area was smaller, involving Larne, Belfast, Ards and (for men) north Down. There were also two small areas of higher risk for men around Drogheda and Dun Laoghaire.
Family history is the most important risk factor for ovarian cancer (Stratton et al., 1998); potentially modifiable risk factors include nulliparity, age at first pregnancy and number of pregnancies (Ness et al., 2002; Nagle et al., 2008; Jordan et al., 2007). Obesity may also be a risk factor (Schouten et al., 2008). The risk was similar in RoI and NI, and none of the socio-demographic variables studied appeared to correlate with risk.
The incidence of ovarian cancer is particularly high in Ireland and the UK compared with many other developed countries. However, differentiation between frankly malignant and “borderline” ovarian cancer (which is not registered by some cancer registries) is sometimes difficult to make; the resulting variations in registration may contribute to differences in recorded rates internationally.
Two areas of higher risk were found; one to the east of Cork city extending through most of Cork and Waterford, and the other a more diffuse area in NI encompassing Moyle, Ballymoney and Ballymena, Dungannon/Craigavon, Down and part of Newry and Mourne. The relative risk was low in the Belfast area.
The pattern of risk bears some resemblance to that of colorectal cancer, which also was poorly correlated with socio-economic variables, as well as to oesophageal cancer; the latter, however, was also related to population density and unemployment.
The aetiology of brain and other central nervous system cancers is largely unknown. There is very little international variation apart from the high incidence in the Nordic countries, and, within Ireland, there was only a minor degree of geographical variation. For both men and women there was a gradient of risk, lowest in the north-east and highest in the extreme south-west, reflected in an overall higher risk in RoI. The extent of variation was greater for women than men but otherwise the patterns were almost identical.
Modifiable risk factors for cancer of corpus uteri include obesity (World Cancer Research Fund/American Institute for Cancer Research, 2007), nulliparity (Dossus et al., 2010) and use of hormone replacement therapy and tamoxifen (International Agency for Research on Cancer, 2011a). The risk of uterine cancer was higher in NI than RoI but showed no significant relationship to any of the socio-demographic variables studied. The geographical pattern was unusual, with two areas of higher risk—one in the eastern part of NI, with the highest rate in Newry and Mourne; the other in the west, with the highest rate in west Mayo, extending into Galway and Sligo. An area of higher risk was also noted in Kerry.
International variations in uterine cancer incidence reflect, to some extent, variations in the prevalence of hysterectomy (Bray et al., 2005). However, we are not aware of any data on the frequency of hysterectomy in NI compared to RoI, or within either country.
The risk of cervical cancer was higher in RoI than in NI, and the incidence rate was relatively high by international standards. The risk was strongly correlated at an area level with increasing population density, unemployment and low educational achievement. A population-based screening programme has been in existence in NI for many years, with all eligible women invited regularly since 1993. In RoI, by contrast, national population-based screening did not begin until 2008, although considerable opportunistic screening has been done for some time.
The highest risk in Belfast was in the north and west of the city, as well as in the city centre, while in Dublin the city centre had the lowest risk. Outside the two major cities there was a large area of higher risk in Kildare, Wicklow and Wexford, an area of higher risk to the north and east of Belfast, and a more diffuse area between Cork and Waterford cities. This distribution was broadly similar to that of lung cancer in women, reflecting their common association with both deprivation and smoking. Prior to the introduction of population-based screening in RoI, the uptake of screening was higher in areas with higher socio-economic status (Walsh et al., 2011); this dependence on socio-economic status appears to be a characteristic of opportunistic screening, as compared to population-based programmes (Walsh et al., 2010).
This atlas shows major variations, sometimes more than two-fold, in the risk of many cancers across the island. For many cancers, we found a strong relationship between socio-economic status and cancer risk, sometimes positive, sometimes negative. These socio-economic relationships were more consistent than the broad geographical patterns identified by mapping. Few of the geographical patterns could be satisfactorily explained by the available data on risk factors, although we did see some correlations between smoking prevalence and smoking-related cancers.
The socio-demographic measures of risk used here were based on recent data, but the relevant period of exposure to risk factors would have been 15, 20 or more years in the past. The relevance of recent census data to the factors important in the initiation of the cancers described here could be debated. However, preparatory work for this atlas indicated to us that patterns of unemployment were quite stable over time and that it was reasonable to use recent census data as an indicator of past patterns.
In the absence of individual-level risk factor data, we have used area-based measures drawn from recent censuses. However, differences between the two countries in the definition of many of the census variables usually used to indicate socio-economic status made the development of common measures of deprivation difficult. The degree of correlation between individual risk status and area measures is also debatable and has been explored by us in a previous publication (Carsin et al., 2009). Is it reasonable to take area-based measures as proxies for individual health, or should they be considered only in the context of area-based factors such as housing, transport, shops (Layte et al., 2011) and access to medical services? To answer these questions, more data at individual level is needed, in Ireland and internationally. Despite this, the analyses suggest that area-based measures of deprivation, which are likely to coincide with both individual deprivation and the quality and availability of local services, are important markers of cancer risk in Ireland.
In most cases, increasing population density and a high proportion of elderly living alone were associated with increased cancer risk, irrespective of deprivation. In the absence of direct evidence of causation, we can only speculate as to the origins of these gradients. Action is needed urgently to determine the causes of excess risk, much of which is likely to be modifiable, but the relationship of these area measures to individual risk is not straightforward. Differences in cancer risk between populations may be related to the prevalence of risk factors and their interactions; to awareness of cancer symptoms and help-seeking behaviour; and to access to, and uptake of, screening and diagnostic services. The interaction of these factors in determining the incidence of different cancers is complex and variable, as shown by the widely varying geographical patterns we report here.
With regard to the geographical variation in cancer risk shown by mapping, much of this was not explicable solely in terms of the socio-economic and demographic variables examined in the regression analysis. We were struck by the relative paucity of comparable published information on cancer risk factors, at national, individual, or small area level in both countries. A restrictive approach to data sharing (not always justified by either legislation or data protection guidelines) has made linkage of cancer registry data with occupational and census data almost impossible in both jurisdictions. Other risk factor data, irrespective of our ability to link it at either individual or small area level, is sparse and, in our experience, also restricted due to fears about data protection. Sources of existing data are fragmented and often neither available nor published.
The smoothing model used to generate the maps is a powerful tool for estimating the relative risks of cancer in small areas and, following extensive testing, we are satisfied that it gives a good representation of the true underlying risks, based on the data and the underlying assumptions. Geographical patterns are revealed which are not visible from the raw incidence data. The model could be further refined by the inclusion of risk factors (e.g. deprivation, smoking status, obesity levels), if this data were to become available at ED/ward level. However, the model makes the assumption that the risk of cancer does not vary much between neighbouring small areas. Also, the amount of smoothing is determined by the number of cases diagnosed—the rarer the cancer type, the smoother the map. Further development of the mapping methodology, including exploration of the effects of including additional factors in the models and of using time periods of different lengths, would be valuable.
One value of an all-Ireland atlas is the ability to compare two populations living in close proximity with a presumed similarity in lifestyle and genes, but with different health services. This may serve as a “natural experiment” to separate the effects of health service organisation and its contribution to cancer risk, from individual factors such as genetics and lifestyle. However, it was not our primary aim to look at NI/RoI differences. These have been explored in a series of joint publications (Walsh et al., 2001; Campo et al., 2004; Donnelly et al., 2009). The limited data available did not indicate any major differences in cancer risk factors between NI and RoI and there were few systematic differences in cancer risk. For a number of cancers we observed north-east/south-west gradients which might have been related to NI/RoI differences; however there was no evidence of a sharp gradient in the border areas, which would have been expected if this were the case. Some clear differences in relative risk existed between NI and RoI. Some of these were clearly attributable to health service utilisation—longer established breast screening in NI; more prostate-specific antigen testing in RoI (Drummond et al., 2009). However, many cancers had a higher risk in RoI, which persisted when adjusted for socio-demographic factors. Differences in registration practices, although unlikely, cannot be completely ruled out, but it is possible that the more demand-led health services in RoI (Galway et al., 2007) have led to more case-finding (e.g. for skin cancer, kidney cancer, chronic lymphocytic leukaemia) and an apparently higher overall cancer risk.
Descriptive analyses cannot tell us about causation, but can generate hypotheses. To explore these hypotheses we need much better information on risk and the determinants of risk. We need analytical studies, cohort and case-control studies, beginning with cancers which are both common and show the widest geographical variation in risk—for instance melanoma and stomach cancer. These would be most effective as part of multi-national collaborations. Although the reasons for socio-economic variation in cancer risk have been well characterised (Faggiano et al., 1997) we need to understand the specifically Irish aspects; for instance, what characterises areas with a higher proportion of elderly living alone? With cancer numbers predicted to increase greatly in Ireland in the coming decades, mainly as a result of population ageing, we need to focus more on the causes of cancer, and its prevention. We hope that this atlas will serve as a stimulus and raw material for detailed studies which will explore and answer some of the questions it poses.
| Bold: Statistically significant result (p<0.05) | NMSC–males | NMSC–females | breast–females | colorectal–males | colorectal–females | lung–males | lung–females | prostate–males | |
| AGE-ADJUSTED ONLY | |||||||||
|---|---|---|---|---|---|---|---|---|---|
| Country | RoI | 1.00 | 1.00 | 1.00 | 1.00 | 1.00 | 1.00 | 1.00 | 1.00 |
| NI | 0.87 (0.84, 0.89) | 0.85 (0.82, 0.87) | 1.01 (0.98, 1.03) | 0.97 (0.94, 1.00) | 1.03 (1.00, 1.07) | 1.11 (1.06, 1.16) | 1.07 (1.01, 1.13) | 0.71 (0.69, 0.74) | |
| MUTUALLY ADJUSTED | |||||||||
| Country | RoI | 1.00 | 1.00 | 1.00 | 1.00 | 1.00 | 1.00 | 1.00 | 1.00 |
| NI | 0.81 (0.78, 0.83) | 0.77 (0.75, 0.80) | 0.97 (0.95, 1.00) | 0.92 (0.89, 0.96) | 0.98 (0.95, 1.02) | 0.96 (0.92, 1.00) | 0.92 (0.88, 0.97) | 0.70 (0.68, 0.73) | |
| Population Density | <1 p/ha | 1.00 | 1.00 | 1.00 | 1.00 | 1.00 | 1.00 | 1.00 | 1.00 |
| 1-15 p/ha | 1.10 (1.06, 1.14) | 1.11 (1.07, 1.15) | 1.05 (1.02, 1.08) | 1.07 (1.03, 1.12) | 1.01 (0.97, 1.06) | 1.25 (1.19, 1.31) | 1.35 (1.27, 1.44) | 0.97 (0.93, 1.01) | |
| >15 p/ha | 1.13 (1.10, 1.17) | 1.23 (1.19, 1.27) | 1.09 (1.05, 1.12) | 1.14 (1.09, 1.18) | 1.04 (1.00, 1.09) | 1.54 (1.47, 1.61) | 1.74 (1.65, 1.84) | 0.94 (0.90, 0.97) | |
| Unemployment | Q1 - lowest | 1.00 | 1.00 | 1.00 | 1.00 | 1.00 | 1.00 | 1.00 | 1.00 |
| Q2 | 1.00 (0.96, 1.03) | 1.00 (0.96, 1.04) | 1.00 (0.96, 1.03) | 1.05 (1.01, 1.10) | 1.02 (0.97, 1.07) | 1.07 (1.01, 1.13) | 1.06 (0.98, 1.14) | 1.03 (0.99, 1.07) | |
| Q3 | 0.95 (0.92, 0.99) | 1.02 (0.98, 1.06) | 0.97 (0.94, 1.01) | 1.08 (1.03, 1.13) | 1.00 (0.95, 1.06) | 1.07 (1.01, 1.14) | 1.12 (1.04, 1.21) | 0.99 (0.95, 1.03) | |
| Q4 | 0.97 (0.93, 1.00) | 1.01 (0.97, 1.05) | 0.99 (0.96, 1.03) | 1.09 (1.04, 1.14) | 1.00 (0.95, 1.05) | 1.24 (1.17, 1.32) | 1.31 (1.21, 1.41) | 1.00 (0.96, 1.04) | |
| Q5 - highest | 0.94 (0.90, 0.98) | 0.99 (0.94, 1.03) | 0.96 (0.92, 0.99) | 1.11 (1.05, 1.17) | 1.02 (0.96, 1.08) | 1.40 (1.32, 1.49) | 1.45 (1.34, 1.57) | 0.98 (0.93, 1.03) | |
| Education(no degree) | Q1 - lowest | 1.00 | 1.00 | 1.00 | 1.00 | 1.00 | 1.00 | 1.00 | 1.00 |
| Q2 | 0.90 (0.87, 0.94) | 0.92 (0.88, 0.96) | 0.93 (0.90, 0.97) | 1.02 (0.97, 1.07) | 0.99 (0.94, 1.04) | 1.20 (1.13, 1.28) | 1.09 (1.01, 1.17) | 0.94 (0.89, 0.98) | |
| Q3 | 0.89 (0.85, 0.92) | 0.86 (0.82, 0.90) | 0.91 (0.88, 0.95) | 0.98 (0.94, 1.03) | 0.98 (0.93, 1.04) | 1.17 (1.10, 1.24) | 1.12 (1.04, 1.21) | 0.89 (0.85, 0.94) | |
| Q4 | 0.86 (0.82, 0.90) | 0.85 (0.81, 0.89) | 0.91 (0.88, 0.95) | 0.97 (0.92, 1.02) | 0.97 (0.91, 1.03) | 1.26 (1.18, 1.34) | 1.17 (1.08, 1.26) | 0.88 (0.84, 0.92) | |
| Q5 - highest | 0.79 (0.76, 0.83) | 0.80 (0.77, 0.84) | 0.88 (0.85, 0.92) | 0.99 (0.94, 1.04) | 0.96 (0.90, 1.02) | 1.32 (1.24, 1.41) | 1.23 (1.14, 1.33) | 0.83 (0.79, 0.88) | |
| Elderly (75+) living alone | Q1 - lowest | 1.00 | 1.00 | 1.00 | 1.00 | 1.00 | 1.00 | 1.00 | 1.00 |
| Q2 | 1.02 (0.99, 1.06) | 1.05 (1.01, 1.10) | 1.02 (0.99, 1.06) | 1.08 (1.03, 1.13) | 1.12 (1.06, 1.19) | 1.01 (0.96, 1.07) | 1.07 (0.99, 1.15) | 1.04 (1.00, 1.08) | |
| Q3 | 1.05 (1.01, 1.09) | 1.11 (1.06, 1.15) | 1.03 (0.99, 1.06) | 1.12 (1.07, 1.18) | 1.17 (1.11, 1.24) | 1.09 (1.03, 1.15) | 1.07 (0.99, 1.15) | 1.08 (1.04, 1.13) | |
| Q4 | 1.05 (1.01, 1.09) | 1.10 (1.06, 1.15) | 1.04 (1.00, 1.08) | 1.08 (1.03, 1.13) | 1.21 (1.15, 1.28) | 1.03 (0.97, 1.09) | 1.03 (0.96, 1.11) | 1.07 (1.03, 1.12) | |
| Q5 - highest | 1.00 (0.97, 1.05) | 1.06 (1.02, 1.11) | 1.04 (1.00, 1.08) | 1.10 (1.05, 1.16) | 1.19 (1.12, 1.26) | 1.17 (1.10, 1.24) | 1.09 (1.01, 1.17) | 1.01 (0.96, 1.05) | |
p/ha= persons per hectare
| NHL–males | NHL–females | stomach–males | stomach–females | melanoma–males | melanoma–females | bladder–males | bladder–females | ||
| AGE-ADJUSTED ONLY | |||||||||
|---|---|---|---|---|---|---|---|---|---|
| Country | RoI | 1.00 | 1.00 | 1.00 | 1.00 | 1.00 | 1.00 | 1.00 | 1.00 |
| NI | 1.04 (0.98, 1.10) | 1.14 (1.08, 1.22) | 1.06 (0.99, 1.12) | 1.01 (0.94, 1.09) | 0.92 (0.85, 0.99) | 0.86 (0.81, 0.92) | 0.92 (0.87, 0.97) | 0.86 (0.79, 0.93) | |
| MUTUALLY ADJUSTED | |||||||||
| Country | RoI | 1.00 | 1.00 | 1.00 | 1.00 | 1.00 | 1.00 | 1.00 | 1.00 |
| NI | 1.03 (0.96, 1.10) | 1.15 (1.07, 1.23) | 1.01 (0.94, 1.08) | 0.95 (0.87, 1.03) | 0.85 (0.79, 0.92) | 0.82 (0.77, 0.88) | 0.83 (0.78, 0.88) | 0.79 (0.72, 0.87) | |
| Population Density | <1 p/ha | 1.00 | 1.00 | 1.00 | 1.00 | 1.00 | 1.00 | 1.00 | 1.00 |
| 1-15 p/ha | 0.99 (0.92, 1.07) | 0.95 (0.88, 1.03) | 1.15 (1.07, 1.25) | 1.06 (0.96, 1.16) | 1.20 (1.10, 1.31) | 0.99 (0.92, 1.07) | 1.18 (1.10, 1.27) | 1.15 (1.03, 1.29) | |
| >15 p/ha | 1.05 (0.98, 1.13) | 1.04 (0.97, 1.13) | 1.36 (1.27, 1.46) | 1.19 (1.08, 1.30) | 1.08 (0.99, 1.18) | 1.06 (0.98, 1.14) | 1.30 (1.21, 1.39) | 1.31 (1.17, 1.46) | |
| Unemployment | Q1 - lowest | 1.00 | 1.00 | 1.00 | 1.00 | 1.00 | 1.00 | 1.00 | 1.00 |
| Q2 | 1.07 (0.98, 1.16) | 0.99 (0.91, 1.09) | 1.06 (0.97, 1.17) | 1.02 (0.91, 1.15) | 1.05 (0.95, 1.16) | 0.91 (0.84, 0.99) | 1.01 (0.93, 1.09) | 0.99 (0.87, 1.13) | |
| Q3 | 1.04 (0.95, 1.14) | 1.01 (0.92, 1.11) | 1.07 (0.98, 1.18) | 1.01 (0.90, 1.14) | 0.93 (0.83, 1.03) | 0.86 (0.79, 0.94) | 1.01 (0.93, 1.10) | 1.02 (0.89, 1.16) | |
| Q4 | 1.00 (0.91, 1.10) | 0.96 (0.87, 1.06) | 1.12 (1.02, 1.23) | 1.10 (0.97, 1.24) | 0.91 (0.82, 1.02) | 0.88 (0.81, 0.97) | 1.05 (0.97, 1.15) | 1.01 (0.88, 1.16) | |
| Q5 - highest | 0.99 (0.90, 1.10) | 0.95 (0.85, 1.06) | 1.24 (1.12, 1.37) | 1.24 (1.09, 1.41) | 0.84 (0.74, 0.95) | 0.77 (0.69, 0.85) | 1.10 (1.00, 1.21) | 1.13 (0.98, 1.31) | |
| Education(no degree) | Q1 - lowest | 1.00 | 1.00 | 1.00 | 1.00 | 1.00 | 1.00 | 1.00 | 1.00 |
| Q2 | 1.00 (0.91, 1.09) | 1.00 (0.91, 1.10) | 1.09 (0.99, 1.20) | 1.07 (0.94, 1.20) | 0.81 (0.73, 0.90) | 0.90 (0.82, 0.98) | 0.97 (0.89, 1.06) | 1.03 (0.90, 1.17) | |
| Q3 | 0.96 (0.87, 1.05) | 0.91 (0.83, 1.01) | 1.09 (0.99, 1.21) | 1.07 (0.94, 1.21) | 0.73 (0.65, 0.81) | 0.83 (0.75, 0.91) | 0.96 (0.88, 1.05) | 1.03 (0.89, 1.18) | |
| Q4 | 0.99 (0.89, 1.09) | 0.96 (0.86, 1.07) | 1.15 (1.04, 1.28) | 1.12 (0.98, 1.27) | 0.75 (0.67, 0.85) | 0.78 (0.71, 0.86) | 0.93 (0.85, 1.02) | 0.91 (0.78, 1.05) | |
| Q5 - highest | 0.97 (0.88, 1.08) | 0.94 (0.84, 1.05) | 1.27 (1.14, 1.40) | 1.29 (1.14, 1.47) | 0.66 (0.58, 0.75) | 0.71 (0.64, 0.79) | 0.98 (0.89, 1.08) | 1.15 (0.99, 1.33) | |
| Elderly (75+) living alone | Q1 - lowest | 1.00 | 1.00 | 1.00 | 1.00 | 1.00 | 1.00 | 1.00 | 1.00 |
| Q2 | 0.98 (0.90, 1.07) | 1.05 (0.96, 1.16) | 1.05 (0.96, 1.15) | 1.13 (1.00, 1.27) | 1.07 (0.96, 1.19) | 1.09 (1.00, 1.19) | 1.06 (0.98, 1.16) | 1.14 (1.00, 1.31) | |
| Q3 | 1.02 (0.93, 1.11) | 1.05 (0.95, 1.16) | 1.10 (1.00, 1.21) | 1.26 (1.12, 1.43) | 1.10 (0.99, 1.23) | 1.08 (0.99, 1.18) | 1.10 (1.01, 1.20) | 1.13 (0.99, 1.30) | |
| Q4 | 1.02 (0.93, 1.11) | 1.09 (0.99, 1.20) | 1.05 (0.95, 1.15) | 1.24 (1.11, 1.40) | 1.18 (1.06, 1.31) | 1.13 (1.03, 1.24) | 1.15 (1.06, 1.25) | 1.16 (1.01, 1.32) | |
| Q5 - highest | 1.02 (0.93, 1.13) | 1.00 (0.90, 1.11) | 1.07 (0.97, 1.18) | 1.26 (1.11, 1.43) | 1.06 (0.94, 1.19) | 1.05 (0.95, 1.16) | 1.19 (1.08, 1.30) | 1.18 (1.02, 1.36) | |
p/ha= persons per hectare
| head & neck–males | head & neck–females | leukaemia–males | leukaemia–females | pancreas–males | pancreas–females | kidney–males | kidney–females | ||
| AGE-ADJUSTED ONLY | |||||||||
|---|---|---|---|---|---|---|---|---|---|
| Country | RoI | 1.00 | 1.00 | 1.00 | 1.00 | 1.00 | 1.00 | 1.00 | 1.00 |
| NI | 1.05 (0.99, 1.12) | 1.21 (1.10, 1.32) | 0.77 (0.72, 0.82) | 0.83 (0.76, 0.89) | 0.89 (0.82, 0.96) | 0.78 (0.72, 0.84) | 0.95 (0.89, 1.02) | 1.04 (0.96, 1.13) | |
| MUTUALLY ADJUSTED | |||||||||
| Country | RoI | 1.00 | 1.00 | 1.00 | 1.00 | 1.00 | 1.00 | 1.00 | 1.00 |
| NI | 0.90 (0.84, 0.97) | 1.13 (1.03, 1.26) | 0.75 (0.70, 0.81) | 0.79 (0.73, 0.87) | 0.85 (0.79, 0.93) | 0.75 (0.69, 0.82) | 0.92 (0.85, 0.99) | 1.03 (0.93, 1.13) | |
| Population Density | <1 p/ha | 1.00 | 1.00 | 1.00 | 1.00 | 1.00 | 1.00 | 1.00 | 1.00 |
| 1-15 p/ha | 1.20 (1.11, 1.30) | 1.08 (0.96, 1.22) | 0.96 (0.89, 1.04) | 0.98 (0.89, 1.08) | 0.96 (0.88, 1.06) | 1.07 (0.98, 1.18) | 1.06 (0.97, 1.15) | 1.10 (0.99, 1.23) | |
| >15 p/ha | 1.53 (1.42, 1.64) | 1.29 (1.15, 1.45) | 0.94 (0.86, 1.01) | 0.99 (0.90, 1.09) | 0.93 (0.85, 1.02) | 1.06 (0.97, 1.17) | 1.05 (0.96, 1.14) | 1.13 (1.01, 1.26) | |
| Unemployment | Q1 - lowest | 1.00 | 1.00 | 1.00 | 1.00 | 1.00 | 1.00 | 1.00 | 1.00 |
| Q2 | 0.97 (0.88, 1.07) | 1.09 (0.94, 1.26) | 0.94 (0.86, 1.03) | 0.94 (0.84, 1.05) | 1.02 (0.91, 1.14) | 0.99 (0.88, 1.10) | 1.03 (0.93, 1.14) | 1.17 (1.03, 1.33) | |
| Q3 | 1.08 (0.98, 1.19) | 1.10 (0.95, 1.28) | 0.94 (0.86, 1.03) | 0.96 (0.85, 1.07) | 1.05 (0.94, 1.18) | 1.01 (0.90, 1.13) | 1.00 (0.90, 1.11) | 1.08 (0.95, 1.24) | |
| Q4 | 1.21 (1.09, 1.33) | 1.25 (1.07, 1.45) | 0.94 (0.85, 1.03) | 0.96 (0.86, 1.09) | 1.14 (1.01, 1.27) | 1.01 (0.90, 1.13) | 1.15 (1.04, 1.28) | 1.10 (0.96, 1.27) | |
| Q5 - highest | 1.42 (1.29, 1.58) | 1.49 (1.27, 1.74) | 0.93 (0.83, 1.03) | 0.96 (0.85, 1.10) | 1.15 (1.02, 1.31) | 1.03 (0.91, 1.16) | 1.02 (0.91, 1.14) | 1.14 (0.99, 1.33) | |
| Education(no degree) | Q1 - lowest | 1.00 | 1.00 | 1.00 | 1.00 | 1.00 | 1.00 | 1.00 | 1.00 |
| Q2 | 1.08 (0.98, 1.20) | 1.01 (0.87, 1.16) | 0.95 (0.86, 1.06) | 1.02 (0.90, 1.15) | 0.94 (0.83, 1.06) | 1.08 (0.96, 1.21) | 1.06 (0.95, 1.18) | 1.11 (0.97, 1.27) | |
| Q3 | 1.10 (1.00, 1.22) | 0.99 (0.85, 1.15) | 0.99 (0.89, 1.10) | 1.04 (0.92, 1.18) | 0.94 (0.83, 1.06) | 1.09 (0.97, 1.23) | 0.96 (0.86, 1.07) | 1.09 (0.95, 1.25) | |
| Q4 | 1.06 (0.95, 1.18) | 0.95 (0.81, 1.11) | 0.99 (0.89, 1.10) | 0.96 (0.85, 1.10) | 0.93 (0.82, 1.06) | 1.09 (0.96, 1.23) | 0.99 (0.88, 1.11) | 0.96 (0.83, 1.12) | |
| Q5 - highest | 1.09 (0.98, 1.21) | 1.03 (0.88, 1.21) | 1.00 (0.89, 1.12) | 0.99 (0.87, 1.14) | 0.93 (0.81, 1.05) | 1.22 (1.07, 1.38) | 0.97 (0.86, 1.09) | 1.04 (0.90, 1.22) | |
| Elderly (75+) living alone | Q1 - lowest | 1.00 | 1.00 | 1.00 | 1.00 | 1.00 | 1.00 | 1.00 | 1.00 |
| Q2 | 0.98 (0.89, 1.08) | 0.98 (0.84, 1.13) | 1.09 (0.99, 1.20) | 1.06 (0.94, 1.19) | 1.04 (0.92, 1.16) | 1.07 (0.95, 1.20) | 1.10 (0.99, 1.22) | 1.12 (0.98, 1.27) | |
| Q3 | 1.05 (0.96, 1.16) | 1.02 (0.89, 1.18) | 1.09 (0.99, 1.20) | 1.06 (0.95, 1.20) | 1.10 (0.98, 1.23) | 1.13 (1.01, 1.26) | 1.06 (0.96, 1.18) | 1.15 (1.01, 1.32) | |
| Q4 | 1.06 (0.96, 1.16) | 0.99 (0.85, 1.14) | 1.14 (1.03, 1.25) | 1.05 (0.93, 1.18) | 1.08 (0.96, 1.21) | 1.08 (0.97, 1.21) | 1.09 (0.98, 1.21) | 1.03 (0.90, 1.18) | |
| Q5 - highest | 1.15 (1.04, 1.27) | 0.97 (0.83, 1.12) | 1.17 (1.05, 1.29) | 1.14 (1.00, 1.29) | 1.13 (1.00, 1.27) | 1.16 (1.03, 1.31) | 1.11 (0.99, 1.24) | 1.00 (0.87, 1.16) | |
p/ha= persons per hectare
| oesophagus–males | oesophagus–females | ovary–females | brain–males | brain–females | corpus uteri–females | cervix uteri –females | ||
| AGE-ADJUSTED ONLY | ||||||||
|---|---|---|---|---|---|---|---|---|
| Country | RoI | 1.00 | 1.00 | 1.00 | 1.00 | 1.00 | 1.00 | 1.00 |
| NI | 1.02 (0.96, 1.10) | 0.92 (0.84, 1.00) | 1.00 (0.95, 1.06) | 0.90 (0.83, 0.97) | 0.80 (0.73, 0.88) | 1.11 (1.05, 1.18) | 0.90 (0.84, 0.97) | |
| MUTUALLY ADJUSTED | ||||||||
| Country | RoI | 1.00 | 1.00 | 1.00 | 1.00 | 1.00 | 1.00 | 1.00 |
| NI | 0.97 (0.90, 1.05) | 0.86 (0.78, 0.95) | 1.01 (0.95, 1.07) | 0.91 (0.83, 1.00) | 0.82 (0.74, 0.91) | 1.12 (1.05, 1.19) | 0.85 (0.78, 0.93) | |
| Population Density | <1 p/ha | 1.00 | 1.00 | 1.00 | 1.00 | 1.00 | 1.00 | 1.00 |
| 1-15 p/ha | 1.07 (0.98, 1.17) | 1.10 (0.98, 1.24) | 1.02 (0.96, 1.10) | 1.01 (0.91, 1.11) | 1.03 (0.92, 1.16) | 0.97 (0.90, 1.05) | 1.39 (1.26, 1.52) | |
| >15 p/ha | 1.21 (1.11, 1.31) | 1.21 (1.08, 1.35) | 1.02 (0.96, 1.09) | 1.03 (0.94, 1.14) | 1.13 (1.01, 1.26) | 0.94 (0.87, 1.01) | 1.48 (1.35, 1.62) | |
| Unemployment | Q1 - lowest | 1.00 | 1.00 | 1.00 | 1.00 | 1.00 | 1.00 | 1.00 |
| Q2 | 1.10 (0.99, 1.22) | 0.95 (0.84, 1.09) | 1.03 (0.95, 1.12) | 1.08 (0.96, 1.21) | 1.03 (0.91, 1.18) | 1.03 (0.94, 1.12) | 1.01 (0.90, 1.13) | |
| Q3 | 1.10 (0.99, 1.22) | 0.95 (0.83, 1.08) | 1.09 (1.00, 1.18) | 1.10 (0.98, 1.23) | 1.03 (0.90, 1.18) | 1.03 (0.94, 1.13) | 1.06 (0.94, 1.19) | |
| Q4 | 1.15 (1.03, 1.28) | 0.94 (0.82, 1.08) | 1.05 (0.96, 1.14) | 0.98 (0.86, 1.10) | 0.90 (0.78, 1.04) | 1.03 (0.93, 1.13) | 1.17 (1.04, 1.32) | |
| Q5 - highest | 1.06 (0.94, 1.19) | 0.91 (0.79, 1.06) | 0.93 (0.84, 1.02) | 0.97 (0.85, 1.11) | 0.93 (0.80, 1.08) | 0.99 (0.90, 1.10) | 1.21 (1.06, 1.37) | |
| Education(no degree) | Q1 - lowest | 1.00 | 1.00 | 1.00 | 1.00 | 1.00 | 1.00 | 1.00 |
| Q2 | 1.09 (0.98, 1.22) | 1.14 (0.99, 1.31) | 1.03 (0.94, 1.11) | 0.98 (0.87, 1.10) | 0.97 (0.84, 1.12) | 1.01 (0.92, 1.11) | 1.22 (1.08, 1.37) | |
| Q3 | 1.01 (0.90, 1.14) | 1.08 (0.93, 1.24) | 1.03 (0.94, 1.13) | 0.94 (0.83, 1.07) | 1.07 (0.93, 1.24) | 0.98 (0.89, 1.08) | 1.29 (1.14, 1.46) | |
| Q4 | 1.10 (0.98, 1.24) | 1.07 (0.92, 1.24) | 1.02 (0.93, 1.12) | 0.94 (0.82, 1.07) | 1.08 (0.93, 1.26) | 1.05 (0.94, 1.16) | 1.40 (1.23, 1.59) | |
| Q5 - highest | 1.09 (0.97, 1.23) | 1.12 (0.96, 1.31) | 1.06 (0.97, 1.17) | 0.98 (0.85, 1.12) | 1.05 (0.90, 1.23) | 1.00 (0.90, 1.11) | 1.66 (1.47, 1.88) | |
| Elderly (75+) living alone | Q1 - lowest | 1.00 | 1.00 | 1.00 | 1.00 | 1.00 | 1.00 | 1.00 |
| Q2 | 1.07 (0.96, 1.19) | 1.12 (0.97, 1.29) | 0.96 (0.88, 1.04) | 0.99 (0.89, 1.11) | 0.98 (0.86, 1.12) | 1.00 (0.91, 1.10) | 0.91 (0.82, 1.02) | |
| Q3 | 1.15 (1.04, 1.29) | 1.14 (0.99, 1.32) | 0.97 (0.89, 1.05) | 0.98 (0.87, 1.10) | 1.02 (0.89, 1.16) | 1.04 (0.95, 1.14) | 0.97 (0.87, 1.09) | |
| Q4 | 1.16 (1.04, 1.29) | 1.23 (1.07, 1.42) | 1.00 (0.92, 1.08) | 1.03 (0.92, 1.16) | 1.03 (0.90, 1.18) | 1.05 (0.96, 1.16) | 0.95 (0.85, 1.06) | |
| Q5 - highest | 1.21 (1.08, 1.36) | 1.20 (1.04, 1.39) | 1.01 (0.93, 1.11) | 0.97 (0.86, 1.10) | 0.97 (0.83, 1.12) | 1.05 (0.95, 1.16) | 1.09 (0.97, 1.22) | |
p/ha= persons per hectare
| Table A2.1 “Confidential” electoral divisions which were merged for census purposes, RoI | |||||||
| county | confidential ED code | merged with | new code | component EDs | year of merge | ||
|---|---|---|---|---|---|---|---|
| Laois | 8046 | Capard | 8045 | Brisha | 8701 | Brisha(045) / Capard(046) | 1996 |
| Longford | 9035 | Newgrove | 9024 | Firry | 9701 | Firry(024) / Newgrove(035) | 1996 |
| Offaly | 12034 | Ballaghassaan | 12043 | Esker | 12701 | Esker(043) / Ballaghassaan(034) | 2002 |
| Westmeath | 13085 | Lackan | 13054 | Ballinalack | 13701 | Ballinalack(054) / Lackan(085) | 2006 |
| Clare | 16008 | Castletown | 16014 | Noughaval | 16703 | Noughaval(014) / Castletown(008) | 2006 |
| 16017 | Ballyeighter | 16020 | Glenroe | 16701 | Glenroe(020) / Ballyeighter(017) | 1996 | |
| 16128 | Cahermurphy | 16123 | Corlea | 16704 | Corlea(123) / Cahermurphy(128) | 2006 | |
| 16133 | Inishcaltra South | 16132 | Inishcaltra North | 16702 | Inishcaltra North(132) / Inishcaltra South(133) | 1996 | |
| Cork | 18046 | Whiddy | 18033 | Bantry Rural | 18701 | Bantry Rural(033) / Whiddy(046) | 1996 |
| Kerry | 19020 | Máistir Gaoithe | 19009 | Ceannúig | 19701 | Ceannúig(009) / Máistir Gaoithe(020) | 2006 |
| 19011 | Daoire Ianna | 19014 | Cloon | 19702 | Cloon(014) / Daoire Ianna(011) | 2006 | |
| Tipperary N | 22045 | Lackagh | 22037 | Greenhall | 22701 | Greenhall(037) / Lackagh(045) | 1996 |
| Tipperary S | 23136 | Killaloan | 23137 | Kilsheelan | 23701 | Kilsheelan(137) / Killaloan(136) | 2006 |
| Waterford | 24006 | Ballynaneashagh | 24002 | Ballybeg South | 24701 | Ballybeg South(002) / Ballynaneashagh(006) | 1996 |
| 25074 | Kilbarry (part) | 25070 | Ballynakill (part) | 25701 | Ballynakill (part)(070) / Kilbarry (part)(074) | ***2002 | |
| Galway | 27022 | Bencorr* | 27027 | Derrycunlagh* | 27703 | Bencorr(022) / Derrycunlagh(027) / Derrylea(028) | 2002 / 2006 |
| 27028 | Derrylea* | ||||||
| 27126 | Loughatorick | 27129 | Marblehill | 27702 | Marblehill(129) / Loughatorick(126) | 2002 | |
| Leitrim | 28011 | Stralongford | 28007 | Greaghlass | 28704 | Greaghlass(007) / Stralongford(011) | 2006 |
| 28017 | Drumreilly West | 28016 | Drumreilly East | 28705 | Drumreilly West(017) / Drumreilly East(016) | 2006 | |
| 28032 | Aghavoghill** | 28027 | Aghalateeve** | 28703 | Aghalateeve(027) / Aghanlish(028) / Melvin(029) / Aghavoghill(032) | 2002 / 2006 | |
| 28028 | Aghanlish** | ||||||
| 28029 | Melvin** | ||||||
| 28034 | Arigna | 28041 | Garvagh | 28701 | Garvagh(041) / Arigna(034) | 1996 | |
| Mayo | 29065 | Sheskin | 29058 | Glenco | 29701 | Glenco(058) / Sheskin(065) | 1996 |
| 29130 | Bundorragha | 29150 | Owennadornaun | 29702 | Owennadornaun(150) / Bundorragha(130) | 1996 | |
| Roscommon | 30048 | Mantua | 30046 | Lisgarve | 30701 | Lisgarve(046) / Mantua(048) | 2006 |
| 30025 | Altagowlan | 30047 | Lough Allen | 30702 | Lough Allen(047) / Altagowlan(025) | 2006 | |
| Sligo | 31027 | Mullagheruse | 31031 | Templeboy South | 31701 | Templeboy South(031) / Mullagheruse(027) | 2002 |
| 31069 | Carrownaskeagh | 31067 | Branchfield | 31702 | Branchfield(067) / Carrownaskeagh(069) | 2006 | |
| 31071 | Cloonacool | 31078 | Loughill | 31703 | Loughill(078) / Cloonacool(071) | 2006 | |
| Cavan | 32028 | Tircahan | 32025 | Pedara Vohers | 32703 | Pedara Vohers(025) / Tircahan(028) | 2002 |
| 32018 | Benbrack | 32027 | Templeport | 32704 | Templeport(027) / Benbrack(018) | 2006 | |
| 32082 | Derrynananta | 32084 | Dunmakeever | 32701 | Dunmakeever(084) / Derrynananta(082) | 1996 | |
| 32087 | Teebane | 32086 | Kinninagh | 32702 | Kinninagh(086) / Teebane(087) | 1996 | |
| * Derrycunlagh merged with Bencorr in 2002, Derrycunlagh merged with Derrylea in 2006 | |||||||
| ** Aghavoghill merged with Aghalateeve in 2002, Aghavoghill merged with Melvin in 2006 and Aghalateeve merged with Aghanlish in 2006 | |||||||
| ***Not confidential in 2006 | |||||||
| Table A2.2 Urban areas with population splits altered between 1996 and 2002 censuses | |||||||
| county | ED number | ED name | 1996 census | 2002 census | combined into | component eds | |
|---|---|---|---|---|---|---|---|
| Carlow | 1001 | Carlow Urban Area | 10220 | 4963 | Carlow Urban Area | 1001 | Carlow Urban Area (001), Carlow Rural (pt.) (019) |
| 1019 | Carlow Rural (Pt.) | 3146 | 11238 | ||||
| Meath | 11001 | Ceannanus Mor Urban | 2152 | 2362 | Ceannanus Mor Urban | 11001 | Ceannanus Mor Urban (001), Ceannanus Mor Rural (pt.) (026) |
| 11026 | Ceannanus Mor Rural (pt.) | 2019 | 2800 | ||||
| 11002 | Navan Urban | 3447 | 2802 | Navan Urban | 11002 | Navan Urban (002), Navan Rural (pt.) (055) | |
| 11055 | Navan Rural (pt.) | 11732 | 18624 | ||||
| 11003 | Trim Urban | 1740 | 1204 | Trim Urban | 11003 | Trim Urban (003), Trim Rural (pt.) (092) | |
| 11092 | Trim Rural (pt.) | 3775 | 5685 | ||||
| Kerry | 19003 | Tralee Urban Area | 19056 | 6311 | Tralee Urban Area | 19003 | Tralee Urban Area (003), Tralee Rural (pt.) (165) |
| 19165 | Tralee Rural (pt.) | 860 | 15433 | ||||
| Donegal | 33003 | L'kenny Urban | 7606 | 2478 | L'kenny Urban | 33003 | L'kenny Urban (003), L'kenny Rural (pt.) (105) |
| 33105 | L'kenny Rural (pt.) | 2341 | 9289 | ||||
| Monaghan | 34002 | C'blayney Urban Area | 1884 | 960 | C'blayney Urban Area | 34002 | C'blayney Urban Area (002), C'blaney Rural (pt.) (027) |
| 34027 | C'blayney Rural (pt.) | 1889 | 2980 | ||||
| 34004 | Monaghan Urban Area | 5628 | 2032 | Monaghan Urban Area | 34004 | Monaghan Urban Area (004), Monaghan Rural (pt.) (063) | |
| 34063 | Monaghan Rural (pt.) | 1207 | 4969 | ||||
(pt.) signifies that only part of the ED is included
| Table A2.3 Urban areas surrounded by a single ED (rural part) | |||||
| county | ED number | ED name | combined into | component EDs | |
|---|---|---|---|---|---|
| Fingal | 4003 | Balbriggan Urban | Balbriggan Urban | 4003 | Balbriggan Urban (003), Balbriggan Rural (002) |
| 4002 | Balbriggan Rural | ||||
| 4034 | Skerries | Skerries | 4034 | Skerries (034), Holmpatrick (023) | |
| 4023 | Holmpatrick | ||||
| Kildare | 6003 | Naas Urban | Naas Urban | 6003 | Naas Urban (003), Naas Rural (079) |
| 6079 | Naas Rural | ||||
| Kilkenny | 7005 | Callan Urban | Callan Urban | 7005 | Callan Urban (005), Callan Rural (004) |
| 7004 | Callan Rural | ||||
| Laois | 8072 | Portlaoighise Urban | Portlaoighise Urban | 8072 | Portlaoighise Urban (072), Portlaoighise Rural (071) |
| 8071 | Portlaoighise Rural | ||||
| Longford | 9027 | Granard Urban | Granard Urban | 9027 | Granard Urban (027), Granard Rural (026) |
| 9026 | Granard Rural | ||||
| Louth | 10009 | Ardee Urban | Ardee Urban | 10009 | Ardee Urban (009), Ardee Rural (008) |
| 10008 | Ardee Rural | ||||
| Wexford | 14001 | Enniscorthy Urban | Enniscorthy Urban | 14001 | Enniscorthy Urban (001), Enniscorthy Rural pt. (021) |
| 14021 | Enniscorthy Rural (pt.) | ||||
| Wicklow | 15007 | Wicklow Urban | Wicklow Urban | 15007 | Wicklow Urban (007), Wicklow Rural (066) |
| 15066 | Wicklow Rural | ||||
| Cork | 18002 | Cobh Urban | Cobh Urban | 18002 | Cobh Urban (002), Cobh Rural (085) |
| 18085 | Cobh Rural | ||||
| 18003 | Fermoy Urban | Fermoy Urban | 18003 | Fermoy Urban (003), Fermoy Rural (131) | |
| 18131 | Fermoy Rural | ||||
| 18004 | Kinsale Urban | Kinsale Urban | 18004 | Kinsale Urban (004), Kinsale Rural (189) | |
| 18189 | Kinsale Rural | ||||
| 18008 | Midleton Urban | Midleton Urban | 18008 | Midleton Urban (008), Midleton Rural (260) | |
| 18260 | Midleton Rural | ||||
| 18009 | Skibbereen Urban | Skibbereen Urban | 18009 | Skibbereen Urban (009), Skibbereen Rural (306) | |
| 18306 | Skibbereen Rural | ||||
| 18010 | Youghal Urban | Youghal Urban | 18010 | Youghal Urban (010), Youghal Rural pt.(325) | |
| 18325 | Youghal Rural (pt.) | ||||
| Kerry | 19002 | Listowel Urban | Listowel Urban | 19002 | Listowel Urban (002), Listowel Rural (118) |
| 19118 | Listowel Rural | ||||
| 19033 | Dingle | Dingle | 19033 | Dingle (033), Glin (036) | |
| 19036 | Glin | ||||
| Limerick | 21102 | Newcastle Urban | Newcastle Urban | 21102 | Newcastle Urban (102), Newcastle Rural (101) |
| 21101 | Newcastle Rural | ||||
| Tipperary North | 22004 | Thurles Urban | Thurles Urban | 22004 | Thurles Urban (004), Thurles Rural (079) |
| 22079 | Thurles Rural | ||||
| Tipperary South | 23084 | Cashel Urban | Cashel Urban | 23084 | Cashel Urban (084), Cashel Rural (096) |
| 23096 | Cashel Rural | ||||
| 23104 | Fethard | Fethard | 23104 | Fethard (104), Peppardstown (115) | |
| 23115 | Peppardstown | ||||
| Galway | 27216 | Tuam Urban | Tuam Urban | 27216 | Tuam Urban (216), Tuam Rural (215) |
| 27215 | Tuam Rural | ||||
| 29003 | Castlebar Urban | Castlebar Urban | 29003 | Castlebar Urban (003), Castlebar Rural (074) | |
| 29074 | Castlebar Rural | ||||
| Roscommon | 30031 | Boyle Urban | Boyle Urban | 30031 | Boyle Urban (031), Boyle Rural (030) |
| 30030 | Boyle Rural | ||||
| 30106 | Roscommon Urban | Roscommon Urban | 30106 | Roscommon Urban (106), Roscommon Rural (105) | |
| 30105 | Roscommon Rural | ||||
| Cavan | 32001 | Cavan Urban | Cavan Urban | 32001 | Cavan Urban (001), Cavan Rural (048) |
| 32048 | Cavan Rural | ||||
| 32051 | Cootehill Urban | Cootehill Urban | 32051 | Cootehill Urban (051), Cootehill Rural (050) | |
| 32050 | Cootehill Rural | ||||
| Donegal | 33001 | Buncrana Urban | Buncrana Urban | 33001 | Buncrana Urban (001), Buncrana Rural (069) |
| 33069 | Buncrana Rural | ||||
| Monaghan | 34003 | Clones Urban Area | Clones Urban | 34003 | Clones Urban Area (003), Clones Rural (pt.) (036) |
| 34036 | Clones Rural (pt.) | ||||
| 34022 | Ballybay Urban | Ballybay Urban | 34022 | Ballybay Urban(022), Ballybay Rural (021) | |
| 34021 | Ballybay Rural | ||||
(pt.) signifies that only part of the ED is included
| Table A2.4 Drogheda, Dundalk and Wexford—Population splits not available for 1996 census and altered in 2002 | |||||||
| population | Combined into | Component EDs | |||||
|---|---|---|---|---|---|---|---|
| county | ED number | ED name | 1996 census | 2002 census | |||
| Louth | 10001 | Fair Gate | 10852 | Drogheda Urban | 10001 | Fair Gate (001) St. Laurence Gate (002)West Gate (003) St. Peter's (pt.) (041) St. Mary's (pt.) (047) | |
| 10002 | St. Laurence Gate | 3566 | |||||
| 10003 | West Gate | 6412 | |||||
| 10001 / 2 / 3 | Drogheda Urban | 24460 | |||||
| 10041 | St. Peter's (pt.) | 1809 | 5406 | ||||
| 10047 | St. Mary's (pt) | 4738 | |||||
| 10004 | Dundalk Urban No. 1 | 2490 | Dundalk Urban | 10004 | Dundalk Urban No.1 (004)Dundalk Urban No.2 (005)Dundalk Urban No.3 (006)Dundalk Urban No.4 (007)Castletown(pt.) (023) Dundalk Rural (pt.) (027)Haggardstown(pt.) (030) | ||
| 10005 | Dundalk Urban No. 2 | 1064 | |||||
| 10006 | Dundalk Urban No. 3 | 1430 | |||||
| 10007 | Dundalk Urban No. 4 | 6527 | |||||
| 10004 / 5 / 6 / 7 | Dundalk Urban | 25762 | |||||
| 10023 | Castletown (pt.) | 1305 | 2961 | ||||
| 10027 | Dundalk Rural (pt.) | 524 | 14715 | ||||
| 10030 | Haggardstown (pt.) | 4222 | 4894 | ||||
| Wexford | 14004 | Wexford No. 1 Urban | 1846 | Wexford Urban | 14004 | Wexford No.1 Urban (004) Wexford No.2 Urban (005)Wexford No.3 Urban (006) Wexford Rural (pt.) (123) | |
| 14005 | Wexford No. 2 Urban | 4823 | |||||
| 14006 | Wexford No. 3 Urban | 1351 | |||||
| 14004 / 5 / 6 | Wexford Urban | 9533 | |||||
| 14123 | Wexford Rural (pt.) | 6747 | 9761 | ||||
(pt.) signifies that only part of the ED is included
| Table A2.5 Islands and headlands joined artificially to mainland EDs or wards | |||||||
| county | name of ED or ward | ED / ward no. | mapping code | true neighbours* | additional neighbours* | additional neighbours* | |
|---|---|---|---|---|---|---|---|
| Headlands | Cork | Sheepshead | 18045 | M18045 | Seefin (18044) | Glanlough (18038) | |
| Templebreedy | 18195 | M18195 | Carrigaline (18183) | Carrigaline (18082) | |||
| Myross | 18304 | M18304 | Castlehaven North (18292) | Shreelane (18305) | |||
| Crookhaven | 18312 | M18312 | Goleen (18315) | Toormore (18319) | |||
| Kerry | Kerryhead | 19149 | M19149 | Ballyheige (19132) | Ballynorig (19134) | ||
| Galway | Knockboy | 27033 | M27033 | Skannive (27039) | Owengowla (27035) | ||
| Ballynacourty | 27043 | M27043 | Clarinbridge (27049) | Drumacoo (27089) | |||
| Doorus | 27088 | M27088 | Kinvarra (27097) | Abbey (16006) | |||
| Lettermore | 27158 | M27158 | Crumpaum (27152) | Gorumna (27154) | |||
| Mayo | An Geata Mor Theas | 29052 | M29052 | An Geata Mor Thuaidh (29051) | Belmullet (29055) | ||
| Knockadaff | 29060 | M29060 | Muingnabo (29062) | Glenamoy (29056) | |||
| Achill | 29124 | M29124 | 29136 / 29152 | Ballycroy South (29129) | |||
| Corraun | 29133 | M29133 | Newport West (29149) | Ballycroy South (29129) | Dooega (29136) | ||
| Dooega | 29136 | M29136 | 29124 / 29152 | Corraun Achill (29133) | |||
| Ballycroy South | 29129 | M29129 | 29128 / 29149 / 29153 / 29701 | Achill (29124) | Corraun Achill (29133) | ||
| Sligo | Lissadill West | 31058 | M31058 | Lissadill East (31056) | Lissadill North (31057) | ||
| Donegal | Ardmalin | 33066 | M33066 | Malin (33087) | Carthage (33072) | ||
| Fanad West | 33115 | M33115 | Fanad North (33114) | Rosnakill (33127) | |||
| Rosguill | 33126 | M33126 | Carrickart (33111) | Cranford (33113) | |||
| Ards | Portaferry | 95BB20 | M19982 | Kircubbin (95BB15) | Portavogie(95BB21) | ||
| Larne | Island Magee | 95QQ13 | M19932 | Blackhead (95HH01) | Whitehead (95HH16) | ||
| Islands | Cork | Whiddy | 18046 | M18701 | Already merged—confidential ED | ||
| Bear | 18048 | M18048 | Killaconenagh (18052) | Curryglass (18050) | |||
| Kerry | Valencia | 19025 | M19025 | Portmagee (19022) | Teeranearagh (19024) | ||
| Galway | Inishbofin | 27032 | M27032 | Cleggan (27024) | Sillerna (27038) | ||
| Inishmore | 27053 | M27053 | Gorumna (27154) | Killilagh (16058) | |||
| Gorumna | 27154 | M27154 | Inishmore (27053) | Lettermore (27158) | |||
| Mayo | Clare Island | 29131 | M29131 | Emlagh (29138) | Aillemore (29127) | ||
| Donegal | Aran | 33040 | M33040 | Rutland (33064) | Maghery (33061) | ||
| *“True neighbours” are EDs which share a land border with the ED in column 3; “additional neighbours” are those which are geographically close or separated from it by water. True neighbours were given a weight of 1 in WinBugs; additional neighbours a weight of 0. | |||||||
| Table A3.1 Summary statistics for each cancer site mapped: numbers of cases per ED or ward, ranges of SIRs and smoothed RRs for 1995-2007 | |||||||||
| number of cases per ED/ward | SIR | smoothed RR (min-max) | |||||||
| mean | (min-max) | ||||||||
| cancer site | females | males | females | males | females | males | females | males | |
| non-melanoma cancer of the skin | 12.5 | 14.2 | (0—315) | (0—333) | (0—6) | (0—5) | (0.6—1.9) | (0.6—2.1) | |
| breast | 9.8 | — | (0—228) | — | (0—6) | — | (0.8—1.2) | — | |
| colorectal | 4.3 | 5.4 | (0—89) | (0—124) | (0—9) | (0—5) | (0.8—1.2) | (0.8—1.4) | |
| lung | 3.3 | 5.3 | (0—95) | (0—126) | (0—8) | (0—7) | (0.4—2.7) | (0.4—3.1) | |
| prostate | — | 8.4 | — | (0—181) | — | (0—5) | — | (0.6—1.6) | |
| non-Hodgkin's lymphoma | 1.2 | 1.3 | (0—26) | (0—30) | (0—22) | (0—13) | (0.9—1.2) | (0.8—1.1) | |
| stomach | 0.9 | 1.5 | (0—29) | (0—39) | (0—23) | (0—20) | (0.5—2.0) | (0.6—1.8) | |
| melanoma of the skin | 1.4 | 0.9 | (0—32) | (0—21) | (0—16) | (0—12) | (0.7—1.8) | (0.6—2.1) | |
| bladder | 0.6 | 1.6 | (0—15) | (0—33) | (0—23) | (0—11) | (0.6—1.6) | (0.7—1.6) | |
| head and neck | 0.6 | 1.4 | (0—18) | (0—35) | (0—28) | (0—11) | (0.6—1.9) | (0.6—2.8) | |
| leukaemia | 0.8 | 1.1 | (0—16) | (0—32) | (0—30) | (0—13) | (0.9—1.1) | (0.8—1.3) | |
| pancreas | 0.9 | 0.9 | (0—26) | (0—24) | (0—24) | (0—17) | (0.8—1.3) | (0.9—1.1) | |
| kidney | 0.6 | 1.0 | (0—20) | (0—24) | (0—26) | (0—15) | (0.9—1.1) | (0.9—1.2) | |
| oesophagus | 0.6 | 1.0 | (0—12) | (0—28) | (0—48) | (0—17) | (0.6—1.6) | (0.7—1.4) | |
| ovary | 1.6 | — | (0—29) | — | (0—10) | — | (0.8—1.2) | — | |
| brain and other central nervous system | 0.6 | 0.8 | (0—12) | (0—20) | (0—34) | (0—23) | (0.8—1.2) | (1.0—1.1) | |
| corpus uteri | 1.3 | — | (0—28) | — | (0—16) | — | (0.8—1.3) | — | |
| cervix uteri | 1.0 | — | (0—27) | — | (0—22) | — | (0.6—2.2) | — | |
| SIR: standardised incidence ratios | |||||||||
| RR: relative risk | |||||||||
Table A4.1 Regions referred to in the atlas | |||||||||||
Provinces (Ireland) and constituent counties/district councils | |||||||||||
|---|---|---|---|---|---|---|---|---|---|---|---|
Connacht | Leinster | Munster | Ulster | ||||||||
Galway | Carlow | Clare | Antrim | Craigavon | Newry and Mourne | ||||||
Mayo | Dublin | Cork | Ards | Derry | Newtownabbey | ||||||
Sligo | Kildare | Kerry | Armagh | Donegal | North Down | ||||||
Roscommon | Kilkenny | Limerick | Ballymena | Down | Omagh | ||||||
Leitrim | Laois | Tipperary | Ballymoney | Dungannon and South Tyrone | |||||||
Longford | Waterford | Banbridge | Fermanagh | Strabane | |||||||
Louth | Belfast | Larne | |||||||||
Meath | Carrickfergus | Limavady | |||||||||
Offaly | Castlereagh | Lisburn | |||||||||
Westmeath | Cavan | Magherafelt | |||||||||
Wexford | Coleraine | Monaghan | |||||||||
Wicklow | Cookstown | Moyle | |||||||||
Health and Social Services Boards (NI) and constituent district councils | |||||||||||
Eastern | Northern | Southern | Western | ||||||||
Ards | Antrim | Armagh | Derry | ||||||||
Belfast | Ballymena | Banbridge | Fermanagh | ||||||||
Castlereagh | Ballymoney | Craigavon | Limavady | ||||||||
Down | Carrickfergus | Dungannon and South Tyrone | Omagh | ||||||||
Lisburn | Coleraine | Newry and Mourne | Strabane | ||||||||
NorthDown | Cookstown | ||||||||||
Larne | |||||||||||
Magherafelt | |||||||||||
Moyle | |||||||||||
Newtownabbey | |||||||||||
HSE regions (RoI) and constituent counties | |||||||||||
Dublin/Mid-Leinster | Dublin/North-east | South | West | ||||||||
Dublin (part) | Dublin (part) | Carlow | Clare | ||||||||
Kildare | Cavan | Cork | Donegal | ||||||||
Laois | Louth | Kerry | Galway | ||||||||
Longford | Meath | Kilkenny | Leitrim | ||||||||
Offaly | Monaghan | S Tipperary | Limerick | ||||||||
Westmeath | Waterford | Mayo | |||||||||
Wicklow | Wexford | N Tipperary | |||||||||
Sligo | |||||||||||
Roscommon | |||||||||||
Planning (NUTS level 3) regions (RoI) and constituent counties | |||||||||||
Border | Midlands | West | Dublin | Mid-West | Mid-East | South-East | South-West | ||||
Louth | Laois | Galway | Dublin | Limerick | Kildare | Wexford | Cork | ||||
Leitrim | Longford | Mayo | Dublin | N Tipperary | Meath | Kilkenny | Kerry | ||||
Sligo | Offaly | Roscommon | Clare | Wicklow | Carlow | ||||||
Cavan | Westmeath | S Tipperary | |||||||||
Donegal | Waterford | ||||||||||
Monaghan | |||||||||||
Abnet, C.C., Fredman, N.D., Kamangar, F., Leitzmann, M.F., Hollenbeck, A.R. & Schatzkin, A. 2009, Non-steroidal anti-inflammatory drugs and risk of gastric and oesophageal adenocarcinomas: results from a cohort study and a meta-analysis, Br J Cancer, vol. 100, no. 3, pp. 551-557.
Amaral, A.F., Cantor, K.P., Silverman, D.T. & Malats, N. 2010, Selenium and bladder cancer risk: a meta-analysis, Cancer Epidemiol Biomarkers Prev, vol. 19, no. 9, pp. 2407-2415.
Antoniou, A., Pharoah, P.D., Narod, S., Risch, H.A., Eyfjord, J.E., Hopper, J.L., Loman, N., Olsson, H., Johannsson, O., Borg, A., Pasini, B., Radice, P., Manoukian, S., Eccles, D.M., Tang, N., Olah, E., Anton-Culver, H., Warner, E., Lubinski, J., Gronwald, J., Gorski, B., Tulinius, H., Thorlacius, S., Eerola, H., Nevanlinna, H., Syrjakoski, K., Kallioniemi, O.P., Thompson, D., Evans, C., Peto, J., Lalloo, F., Evans, D.G. & Easton, D.F. 2003, Average risks of breast and ovarian cancer associated with BRCA1 or BRCA2 mutations detected in case series unselected for family history: a combined analysis of 22 studies, Am J Hum Genet, vol. 72, no. 5, pp. 1117-1130.
Armstrong, B.K. & Kricker, A. 2001, The epidemiology of UV induced skin cancer, J Photochem Photobiol B Biol, vol. 63, pp. 8-18.
Arslan, A.A., Helzlsouer, K.J., Kooperberg, C., Shu, X.O., Steplowski, E., Bueno-de-Mesquita, H.B., Fuchs, C.S., Gross, M.D., Jacobs, E.J., Lacroix, A.Z., Petersen, G.M., Stolzenberg-Solomon, R.Z., Zheng, W., Albanes, D., Amundadottir, L., Bamlet, W.R., Barricarte, A., Bingham, S.A., Boeing, H., Boutron-Ruault, M.C., Buring, J.E., Chanock, S.J., Clipp, S., Gaziano, J.M., Giovannucci, E.L., Hankinson, S.E., Hartge, P., Hoover, R.N., Hunter, D.J., Hutchinson, A., Jacobs, K.B., Kraft, P., Lynch, S.M., Manjer, J., Manson, J.E., McTiernan, A., McWilliams, R.R., Mendelsohn, J.B., Michaud, D.S., Palli, D., Rohan, T.E., Slimani, N., Thomas, G., Tjonneland, A., Tobias, G.S., Trichopoulos, D., Virtamo, J., Wolpin, B.M., Yu, K., Zeleniuch-Jacquotte, A., Patel, A.V. & Pancreatic Cancer Cohort Consortium (PanScan) 2010, Anthropometric measures, body mass index, and pancreatic cancer: a pooled analysis from the Pancreatic Cancer Cohort Consortium (PanScan), Arch Intern Med, vol. 170, no. 9, pp. 791-802.
Baan, R., Grosse, Y., Lauby-Secretan, B., El Ghissassi, F., Bouvard, V., Benbrahim-Tallaa, L., Guha, N., Islami, F., Galichet, L., Straif, K. & WHO International Agency for Research on Cancer Monograph Working Group 2011, Carcinogenicity of radiofrequency electromagnetic fields, Lancet Oncol, vol. 12, no. 7, pp. 624-626.
Baan, R., Grosse, Y., Straif, K., Secretan, B., El Ghissassi, F., Bouvard, V., Benbrahim-Tallaa, L., Guha, N., Freeman, C., Galichet, L., Cogliano, V. & WHO International Agency for Research on Cancer Monograph Working Group 2009, A review of human carcinogens--Part F: chemical agents and related occupations, Lancet Oncol, vol. 10, no. 12, pp. 1143-1144.
Baglietto, L., Lindor, N.M., Dowty, J.G., White, D.M., Wagner, A., Gomez Garcia, E.B., Vriends, A.H., Dutch Lynch Syndrome Study Group, Cartwright, N.R., Barnetson, R.A., Farrington, S.M., Tenesa, A., Hampel, H., Buchanan, D., Arnold, S., Young, J., Walsh, M.D., Jass, J., Macrae, F., Antill, Y., Winship, I.M., Giles, G.G., Goldblatt, J., Parry, S., Suthers, G., Leggett, B., Butz, M., Aronson, M., Poynter, J.N., Baron, J.A., Le Marchand, L., Haile, R., Gallinger, S., Hopper, J.L., Potter, J., de la Chapelle, A., Vasen, H.F., Dunlop, M.G., Thibodeau, S.N. & Jenkins, M.A. 2010, Risks of Lynch syndrome cancers for MSH6 mutation carriers, J Natl Cancer Inst, vol. 102, no. 3, pp. 193-201.
Bandera, E.V., Kushi, L.H., Moore, D.F., Gifkins, D.M. & McCullough, M.L. 2007, Association between dietary fiber and endometrial cancer: a dose-response meta-analysis, Am J Clin Nutr, vol. 86, no. 6, pp. 1730-1737.
Ben, Q., Xu, M., Ning, X., Liu, J., Hong, S., Huang, W., Zhang, H. & Li, Z. 2011, Diabetes mellitus and risk of pancreatic cancer: A meta-analysis of cohort studies, Eur J Cancer, vol. 47, no. 13, pp. 1928-1937.
Best, N., Richardson, S. & Thomson, A. 2005, A comparison of Bayesian spatial models for disease mapping, Stat Methods Med Res, vol. 14, no. 1, pp. 35-59.
Boffetta, P., Hecht, S., Gray, N., Gupta, P. & Straif, K. 2008, Smokeless tobacco and cancer, Lancet Oncol, vol. 9, no. 7, pp. 667-675.
Bonadona, V., Bonaiti, B., Olschwang, S., Grandjouan, S., Huiart, L., Longy, M., Guimbaud, R., Buecher, B., Bignon, Y.J., Caron, O., Colas, C., Nogues, C., Lejeune-Dumoulin, S., Olivier-Faivre, L., Polycarpe-Osaer, F., Nguyen, T.D., Desseigne, F., Saurin, J.C., Berthet, P., Leroux, D., Duffour, J., Manouvrier, S., Frebourg, T., Sobol, H., Lasset, C., Bonaiti-Pellie, C. & French Cancer Genetics Network 2011, Cancer risks associated with germline mutations in MLH1, MSH2, and MSH6 genes in Lynch syndrome, JAMA, vol. 305, no. 22, pp. 2304-2310.
Bosch, F.X., Lorincz, A., Muñoz, N., Meijer, C.J. & Shah, K.V. 2002, The causal relation between human papillomavirus and cervical cancer, J Clin Pathol, vol. 55, no. 4, pp. 244-265.
Bosch FX, Burchell AN, Schiffman M, Giuliano AR, de Sanjose S, Bruni L, Tortolero-Luna G, Kjaer SK, Muñoz N, 2008, Epidemiology and natural history of human papillomavirus infections and type-specific implications in cervical neoplasia, Vaccine, vol. 26 Suppl 10, pp. K1-16.
Bosetti, C., Bravi, F., Negri, E. & La Vecchia, C. 2009, Oral contraceptives and colorectal cancer risk: a systematic review and meta-analysis, Hum Reprod Update, vol. 15, no. 5, pp. 489-498.
Bosetti, C., Gallus, S. & La Vecchia, C. 2006, Aspirin and cancer risk: an updated quantitative review to 2005, Cancer Causes Control, vol. 17, no. 7, pp. 871-888.
Bouvard, V., Baan, R., Straif, K., Grosse, Y., Secretan, B., El Ghissassi, F., Benbrahim-Tallaa, L., Guha, N., Freeman, C., Galichet, L., Cogliano, V. & WHO International Agency for Research on Cancer Monograph Working Group 2009, A review of human carcinogens--Part B: biological agents, Lancet Oncol, vol. 10, no. 4, pp. 321-322.
Boyle R., O'Hagan A.H., Donnelly D., Donnelly C., Gordon S., McElwee G., Gavin A., 2010, Trends in reported sun bed use, sunburn, and sun care knowledge and attitudes in a U.K. region: results of a survey of the Northern Ireland population, Br J Dermatol, vol. 163, no. 6. Pp. 1269-75
Bray F., Loos A.H., Oostindier M., Weiderpass E., 2005, Geographic and temporal variations in cancer of the corpus uteri: incidence and mortality in pre- and postmenopausal women in Europe, Int J Cancer, vol. 117, no. 1, pp. 123-31
Brennan, P., Bogillot, O., Cordier, S., Greiser, E., Schill, W., Vineis, P., Lopez-Abente, G., Tzonou, A., Chang-Claude, J., Bolm-Audorff, U., Jöckel, K.H., Donato, F., Serra, C., Wahrendorf, J., Hours, M., T'Mannetje, A., Kogevinas, M. & Boffetta, P. 2000, Cigarette smoking and bladder cancer in men: a pooled analysis of 11 case-control studies, Int J Cancer, vol. 86, no. 2, pp. 289-294.
Brennan, P., Bogillot, O., Greiser, E., Chang-Claude, J., Wahrendorf, J., Cordier, S., Jöckel, K.H., Lopez-Abente, G., Tzonou, A., Vineis, P., Donato, F., Hours, M., Serra, C., Bolm-Audorff, U., Schill, W., Kogevinas, M. & Boffetta, P. 2001, The contribution of cigarette smoking to bladder cancer in women (pooled European data), Cancer Causes Control, vol. 12, no. 5, pp. 411-417.
Breslow, N.E. 1984, Extra-Poisson variation in log-linear models, Appl Stat, vol. 33, pp. 38-44.
Brown, J.R. 2008, Inherited predisposition to chronic lymphocytic leukemia, Expert Rev Hematol, vol. 1, no. 1, pp. 51-61.
Brown L.M., 2000, Helicobacter pylori: epidemiology and routes of transmission, Epidemiol Rev, vol. 22, no. 2, pp. 283-97.
Bruner, D.W., Moore, D., Parlanti, A., Dorgan, J. & Engstrom, P. 2003, Relative risk of prostate cancer for men with affected relatives: systematic review and meta-analysis, Int J Cancer, vol. 107, no. 5, pp. 797-803.
Buckley M.J., O'Shea J., Grace A., English L., Keane C., Hourihan D., O'Morain C.A., 1998, A community-based study of the epidemiology of Helicobacter pylori infection and associated asymptomatic gastroduodenal pathology. Eur J Gastroenterol Hepatol, vol. 10, no. 5, pp. 375-9
Buschemeyer, W.C.3. & Freedland, S.J. 2007, Obesity and prostate cancer: epidemiology and clinical implications, Eur Urol, vol. 52, no. 2, pp. 331-343.
Campo J., Comber H., Gavin A.T. 2004, All-Ireland Cancer Statistics 1998-2000. Northern Ireland Cancer Registry/ National Cancer Registry , Belfast/Cork.
Carsin, A.E, Sharp, L., Comber, H., 2009, An Atlas of Cancer in Ireland 1994-2003, National Cancer Registry, Cork.
Carsin A.E., Drummond F.J., Black A., van Leeuwen P.J., Sharp L., Murray L.J., Connolly D., Egevad L., Boniol M., Autier P., Comber H., Gavin A., 2010, Impact of PSA testing and prostatic biopsy on cancer incidence and mortality: comparative study between the Republic of Ireland and Northern Ireland, Cancer Causes Control. Vol. 21, no. 9, pp. 1523-31.
Castellsagué, X. & Muñoz, N. 2003, Chapter 3: cofactors in human papillomavirus carcinogenesis - role of parity, oral contraceptives, and tobacco smoking, J Natl Cancer Inst Monographs, vol. 31, pp. 20-28.
Celik, I., Gallicchio, L., Boyd, K., Lam, T.K., Matanoski, G., Tao, X., Shiels, M., Hammond, E., Chen, L., Robinson, K.A., Caulfield, L.E., Herman, J.G., Guallar, E. & Alberg, A.J. 2008, Arsenic in drinking water and lung cancer: a systematic review, Environmental research, vol. 108, no. 1, pp. 48-55.
Central Statistics Office, 1986. Census of population 1981. Stationery Office, Dublin.
Central Statistics Office, 2003. 2002 Census Results. from http://www.cso.ie/census/ [4].
Central Statistics Office, 2007, 2006 Census Reports. Volume 2. Ages and Marital Staus. Stationery Office, Dublin.
Chen, C., Xu, T., Chen, J., Zhou, J., Yan, Y., Lu, Y. & Wu, S. 2011, Allergy and risk of glioma: a meta-analysis, European journal of neurology : the official journal of the European Federation of Neurological Societies, vol. 18, no. 3, pp. 387-395.
Chen, P., Hu, P., Xie, D., Qin, Y., Wang, F. & Wang, H. 2010, Meta-analysis of vitamin D, calcium and the prevention of breast cancer, Breast cancer research and treatment, vol. 121, no. 2, pp. 469-477.
Cibula, D., Gompel, A., Mueck, A.O., La Vecchia, C., Hannaford, P.C., Skouby, S.O., Zikan, M. & Dusek, L. 2010, Hormonal contraception and risk of cancer, Hum Reprod Update, vol. 16, no. 6, pp. 631-650.
Cibula, D., Widschwendter, M., Majek, O. & Dusek, L. 2011, Tubal ligation and the risk of ovarian cancer: review and meta-analysis, Hum Reprod Update, vol. 17, no. 1, pp. 55-67.
Clague, J [5]., Lin J [6], Cassidy, A [7]., Matin, S [8]., Tannir, N.M [9]., Tamboli, P [10]., Wood, C.G [11]. & Wu, X [12]. 2009, Family history and risk of renal cell carcinoma: results from a case-control study and systematic meta-analysis, Cancer Epidemiol Biomarkers Prev, [13] vol. 18, no 3, pp. 801-7.
Clayton, D. & Kaldor, J. 1987, Empirical Bayes estimates of age-standardized relative risks for use in disease mapping, Biometrics, vol. 43, no. 3, pp. 671-681.
Cook, S., Poole, M.A., Pringle, D.G., Moore, P.A., 2000, Comparative spatial deprivation in Ireland. A cross-border analysis. Oak Tree Press, Dublin.
Collaborative Group on Epidemiological Studies of Ovarian Cancer, Beral, V., Doll, R., Hermon, C., Peto, R. & Reeves, G. 2008, Ovarian cancer and oral contraceptives: collaborative reanalysis of data from 45 epidemiological studies including 23,257 women with ovarian cancer and 87,303 controls, Lancet, vol. 371, no. 9609, pp. 303-314.
Collaborative Group on Hormonal Factors in Breast Care, 2002, Breast cancer and breastfeeding: collaborative reanalysis of individual data from 47 epidemiological studies in 30 countries, including 50302 women with breast cancer and 96973 women without the disease, Lancet, vol. 360, no. 9328, pp. 187-195.
Corcoran, L.M., Gillmor, D.A., Killen J.E., An analysis of summer sun tourists—outbound package holidays from Dublin Airport, 1996, Irish Geography, vol. 29, no, 2, pp. 106-115.
Corrao, G [14]., Scotti, L [15]., Bagnardi, V [16]. and Sega, R [17]. 2007, Hypertension, antihypertensive therapy and renal-cell cancer: a meta-analysis, Curr Drug Saf [18], vol. 2, no. 2, pp. 125-33.
Costet, N., Villanueva, C.M., Jaakkola, J.J., Kogevinas, M., Cantor, K.P., King, W.D., Lynch, C.F., Nieuwenhuijsen, M.J. & Cordier, S. 2011, Water disinfection by-products and bladder cancer: is there a European specificity? A pooled and meta-analysis of European case-control studies, Occup Environ Med, vol. 68, no. 5, pp. 379-385.
Crosbie, E.J., Zwahlen, M., Kitchener, H.C., Egger, M. & Renehan, A.G. 2010, Body mass index, hormone replacement therapy, and endometrial cancer risk: a meta-analysis, Cancer Epidemiol Biomarkers Prev, vol. 19, no. 12, pp. 3119-3130.
Daniels, R.D. & Schubauer-Berigan, M.K. 2011, A meta-analysis of leukaemia risk from protracted exposure to low-dose gamma radiation, Occup Environ Med, vol. 68, no. 6, pp. 457-464.
Daugherty, S.E., Pfeiffer, R.M., Sigurdson, A.J., Hayes, R.B., Leitzmann, M., Schatzkin, A., Hollenbeck, A.R. & Silverman, D.T. 2011, Nonsteroidal antiinflammatory drugs and bladder cancer: a pooled analysis, Am J Epidemiol, vol. 173, no. 7, pp. 721-730.
de Sanjosé, S., Bosch, F.X., Muñoz, N. & Shah, K. 1997, Social differences in sexual behaviour and cervical cancer in Social inequalities and cancer, No. 138 edn, IARC Scientific Publications, Lyon, pp. 309-317.
Decensi, A., Puntoni, M., Goodwin, P., Cazzaniga, M., Gennari, A., Bonanni, B. & Gandini, S. 2010, Metformin and cancer risk in diabetic patients: a systematic review and meta-analysis, Cancer Prev Res (Phila), vol. 3, no. 11, pp. 1451-1461.
Department of Agriculture and Rural Development, 2011, http://www.dardni.gov.uk/index/fisheries-farming-and-food/marine_fisheries/fisheries-sea-fisheries.htm [19] [accessed 20/09/2011]
Department of Agriculture, Fisheries and Food, 2011. http://www.agriculture.gov.ie/fisheries/fisheryharbours/ [20] [accessed 20/09/2011]
Department of Health Social Services and Public Safety, 2008. Adult drinking patterns in Northern Ireland, 2008, Department of Health Social Services and Public Safety, Belfast.
Dietrich, K., Demidenko, E., Schned, A., Zens, M.S., Heaney, J. & Karagas, M.R. 2011, Parity, early menopause and the incidence of bladder cancer in women: a case-control study and meta-analysis, Eur J Cancer, vol. 47, no. 4, pp. 592-599.
Dolan C., O'Halloran A., Bradley D.G., Croke D.T., Evans A., O'Brien J.K., Dicker P., Shields D.C., 2005, Genetic stratification of pathogen-response-related and other variants within a homogeneous Caucasian Irish population. Eur J Hum Genet, vol.13, no. 7, pp. 798-806.
Doll, R. & Peto, R. 1981, The causes of cancer: quantitative estimates of avoidable risks of cancer in the United States today, J Natl Cancer Inst, vol. 66, no. 6, pp. 1191-1308.
Dong, J.Y. & Qin, L.Q. 2011, Soy isoflavones consumption and risk of breast cancer incidence or recurrence: a meta-analysis of prospective studies, Breast Cancer Res Treat, vol. 125, no. 2, pp. 315-323.
Dong, J.Y., He, K., Wang, P. & Qin, L.Q. 2011a, Dietary fiber intake and risk of breast cancer: a meta-analysis of prospective cohort studies, Am J Clin Nutr, vol. 94, no. 3, pp. 900-905.
Dong, J.Y., Zhang, L., He, K. & Qin, L.Q. 2011b, Dairy consumption and risk of breast cancer: a meta-analysis of prospective cohort studies, Breast Cancer Res Treat, vol. 127, no. 1, pp. 23-31.
Donnelly, D.W., Gavin, A.T. & Comber, H. 2009, Cancer in Ireland 1994-2004: a comprehensive report, Northern Ireland Cancer Registry/National Cancer Registry, Ireland.
Donnelly, D., Gavin A. Monitoring care of female breast cancer patients in Northern Ireland diagnosed 2006 (with comparisons to 1996 & 2001), 2010, Northern Ireland Cancer Registry, Belfast.
dos Santos Silva I., Swerdlow A.J., 1996, Sex differences in time trends of colorectal cancer in England and Wales: the possible effect of female hormonal factors. Br J Cancer, vol. 73, no. 5, pp. 692-7.
Dossus, L., Allen, N., Kaaks, R., Bakken, K., Lund, E., Tjonneland, A., Olsen, A., Overvad, K., Clavel-Chapelon, F., Fournier, A., Chabbert-Buffet, N., Boeing, H., Schutze, M., Trichopoulou, A., Trichopoulos, D., Lagiou, P., Palli, D., Krogh, V., Tumino, R., Vineis, P., Mattiello, A., Bueno-de-Mesquita, H.B., Onland-Moret, N.C., Peeters, P.H., Dumeaux, V., Redondo, M.L., Duell, E., Sanchez-Cantalejo, E., Arriola, L., Chirlaque, M.D., Ardanaz, E., Manjer, J., Borgquist, S., Lukanova, A., Lundin, E., Khaw, K.T., Wareham, N., Key, T., Chajes, V., Rinaldi, S., Slimani, N., Mouw, T., Gallo, V. & Riboli, E. 2010, Reproductive risk factors and endometrial cancer: the European Prospective Investigation into Cancer and Nutrition, Int J Cancer, vol. 127, no. 2, pp. 442-451.
Drummond, F.J., Carsin, A.E., Sharp, L. & Comber, H. 2009, Factors prompting PSA-testing of asymptomatic men in a country with no guidelines: a national survey of general practitioners, BMC Fam Pract, vol. 10, pp. 3.
Drummond, F.J., Carsin, A.E., Sharp, L. & Comber, H. 2010, Trends in prostate specific antigen testing in Ireland: lessons from a country without guidelines, Ir J Med Sci. vol. 179, no. 1, pp. 43-9
Ekstrom Smedby, K., Vajdic, C.M., Falster, M., Engels, E.A., Martinez-Maza, O., Turner, J., Hjalgrim, H., Vineis, P., Seniori Costantini, A., Bracci, P.M., Holly, E.A., Willett, E., Spinelli, J.J., La Vecchia, C., Zheng, T., Becker, N., De Sanjose, S., Chiu, B.C., Dal Maso, L., Cocco, P., Maynadie, M., Foretova, L., Staines, A., Brennan, P., Davis, S., Severson, R., Cerhan, J.R., Breen, E.C., Birmann, B., Grulich, A.E. & Cozen, W. 2008, Autoimmune disorders and risk of non-Hodgkin lymphoma subtypes: a pooled analysis within the InterLymph Consortium, Blood, vol. 111, no. 8, pp. 4029-4038.
El Ghissassi, F., Baan, R., Straif, K., Grosse, Y., Secretan, B., Bouvard, V., Benbrahim-Tallaa, L., Guha, N., Freeman, C., Galichet, L., Cogliano, V. & WHO International Agency for Research on Cancer Monograph Working Group 2009, A review of human carcinogens--part D: radiation, Lancet Oncol, vol. 10, no. 8, pp. 751-752.
Elliott, P., Cuzick, J., English, D., Stern, R. & On behalf of the World Health Organization Regional Office for Europe, (eds) 1996, Geographical and environmental epidemiology. Methods for small-area studies, Oxford University Press.
Estève, J., Benhamou, E. & Raymond, L. 1994, Statistical methods in cancer research volume IV. Descriptive epidemiology., IARC Scientific Publications, vol. 128, pp. 1-302.
Faggiano, F., Partanen, T., Kogevinas, M. & Bofetta, P. 1997, Socioeconomic differences in cancer incidence and mortality in Social Inequalities and Cancer, No. 138 edn, IARC Scientific Publications, Lyon, pp. 65-176.
Falebita O.A., Mancini S., Kiely E., Comber H., 2009, Rising incidence of renal cell carcinoma in Ireland, Int Urol Nephrol, vol. 41, no. 1, pp.7-12.
Ferlay, J., Burkhard, C., Whelan, S. & Parkin, D.M. 2005, Check and conversion programs for cancer registries (IARC/IACR tools for cancer registries), IARC, Lyon.
Ferlay, J., H. R. Shin, et al. (Dec 15). Estimates of worldwide burden of cancer in 2008: GLOBOCAN 2008. GLOBOCAN 2008 2011/02/26. Retrieved 12, 127, from http://globocan.iarc.fr [21].
Friberg, E., Orsini, N., Mantzoros, C.S. & Wolk, A. 2007, Diabetes mellitus and risk of endometrial cancer: a meta-analysis, Diabetologia, vol. 50, no. 7, pp. 1365-1374.
Friel, S., Nic Gabhainn, S., Kelleher, C., 1999, The National Health & Lifestyle Surveys, Health Promotion Unit, Department of Health and Children, Dublin/Centre for Health Promotion Studies, National University of Ireland, Galway
Fuccio, L., Zagari, R.M., Eusebi, L.H., Laterza, L., Cennamo, V., Ceroni, L., Grilli, D. & Bazzoli, F. 2009, Meta-analysis: can Helicobacter pylori eradication treatment reduce the risk for gastric cancer?, Ann Intern Med, vol. 151, no. 2, pp. 121-128.
Galeone, C., Turati, F., La Vecchia, C. & Tavani, A. 2010, Coffee consumption and risk of colorectal cancer: a meta-analysis of case-control studies, Cancer Causes Control, vol. 21, no. 11, pp. 1949-1959.
Galway K.J., Murphy A.W., O'Reilly D., O'Dowd T., O'Neill C., Shryane E., Steele K., Bury G., Gilliland A., Kelly A., 2007, Perceived and reported access to the general practitioner: an international comparison of universal access and mixed private/public systems. Ir Med J., vol. 100, no. 6, pp. 494-7.
Gandini, S., Sera, F., Cattaruzza, M.S., Pasquini, P., Picconi, O., Boyle, P. & Melchi, C.F. 2005a, Meta-analysis of risk factors for cutaneous melanoma: II. Sun exposure, Eur J Cancer, vol. 41, no. 1, pp. 45-60.
Gandini, S., Sera, F., Cattaruzza, M.S., Pasquini, P., Zanetti, R., Masini, C., Boyle, P. & Melchi, C.F. 2005b, Meta-analysis of risk factors for cutaneous melanoma: III. Family history, actinic damage and phenotypic factors, Eur J Cancer, vol. 41, no. 14, pp. 2040-2059.
Gandini, S., Lowenfels, A.B., Jaffee, E.M., Armstrong, T.D. & Maisonneuve, P. 2005c, Allergies and the risk of pancreatic cancer: a meta-analysis with review of epidemiology and biological mechanisms, Cancer Epidemiol Biomarkers Prev, vol. 14, no. 8, pp. 1908-1916.
Garcia-Manero, G. 2011, Myelodysplastic syndromes: 2011 update on diagnosis, risk-stratification, and management, Am J Hematol, vol. 86, no. 6, pp. 490-498.
Gatto, N.M., Kelsh, M.A., Mai, D.H., Suh, M. & Proctor, D.M. 2010, Occupational exposure to hexavalent chromium and cancers of the gastrointestinal tract: a meta-analysis, Cancer Epidemiol, vol. 34, no. 4, pp. 388-399.
Gaudet, M.M., Olshan, A.F., Chuang, S.C., Berthiller, J., Zhang, Z.F., Lissowska, J., Zaridze, D., Winn, D.M., Wei, Q., Talamini, R., Szeszenia-Dabrowska, N., Sturgis, E.M., Schwartz, S.M., Rudnai, P., Eluf-Neto, J., Muscat, J., Morgenstern, H., Menezes, A., Matos, E., Bucur, A., Levi, F., Lazarus, P., La Vecchia, C., Koifman, S., Kelsey, K., Herrero, R., Hayes, R.B., Franceschi, S., Wunsch-Filho, V., Fernandez, L., Fabianova, E., Daudt, A.W., Dal Maso, L., Curado, M.P., Chen, C., Castellsague, X., Benhamou, S., Boffetta, P., Brennan, P. & Hashibe, M. 2010, Body mass index and risk of head and neck cancer in a pooled analysis of case-control studies in the International Head and Neck Cancer Epidemiology (INHANCE) Consortium, Int J Epidemiol, vol. 39, no. 4, pp. 1091-1102.
Gibson G. E., Codd M. B., Murphy G. M., 1997, Skin type distribution and skin disease in Ireland, Ir J Med Sci vol. 166 no. 2, pp. 72-74.
Giovannucci, E. & Michaud, D. 2007, The role of obesity and related metabolic disturbances in cancers of the colon, prostate, and pancreas, Gastroenterology, vol. 132, no. 6, pp. 2208-2225.
Greiser, C.M., Greiser, E.M. & Doren, M. 2010, Menopausal hormone therapy and risk of lung cancer-Systematic review and meta-analysis, Maturitas, vol. 65, no. 3, pp. 198-204.
Grosse, Y., Baan, R., Straif, K., Secretan, B., El Ghissassi, F., Bouvard, V., Benbrahim-Tallaa, L., Guha, N., Galichet, L., Cogliano, V. & WHO International Agency for Research on Cancer Monograph Working Group 2009, A review of human carcinogens-Part A: pharmaceuticals, Lancet Oncol, vol. 10, no. 1, pp. 13-14.
Grosse, Y., Baan, R., Secretan-Lauby, B., El Ghissassi, F., Bouvard, V., Benbrahim-Tallaa, L., Guha, N., Islami, F., Galichet, L., Straif, K. & WHO International Agency for Research on Cancer Monograph Working Group 2011, Carcinogenicity of chemicals in industrial and consumer products, food contaminants and flavourings, and water chlorination byproducts, Lancet Oncol, vol. 12, no. 4, pp. 328-329.
Grossman, E., Messerli, F.H. & Goldbourt, U. 2001, Antihypertensive therapy and the risk of malignancies, Eur Heart J, vol. 22, no. 15, pp. 1343-1352.
Grulich, A.E. & Vajdic, C.M. 2005, The epidemiology of non-Hodgkin lymphoma, Pathology, vol. 37, no. 6, pp. 409-419.
Guha, N., Merletti, F., Steenland, N.K., Altieri, A., Cogliano, V. & Straif, K. 2010, Lung cancer risk in painters: a meta-analysis, Environ Health Perspect, vol. 118, no. 3, pp. 303-312.
Guha, N., Steenland, N.K., Merletti, F., Altieri, A., Cogliano, V. & Straif, K. 2010, Bladder cancer risk in painters: a meta-analysis, Occup Environ Med, vol. 67, no. 8, pp. 568-573.
Harling, M., Schablon, A., Schedlbauer, G., Dulon, M. & Nienhaus, A. 2010, Bladder cancer among hairdressers: a meta-analysis, Occup Environ Med, vol. 67, no. 5, pp. 351-358.
Harrington J., Fitzgerald A.P., Layte R., Lutomski J., Molcho M., Perry I.J., 2011, Sociodemographic, health and lifestyle predictors of poor diets, Public Health Nutr. Jun 13;. [Epub ahead of print]
Harrington, J., Perry, I., Lutomski, J., Morgan, K., McGee, H., Shelley, E., Watson, D. and Barry, M., 2008, SLÁN 2007: Survey of Lifestyle, Attitudes and Nutrition in Ireland. Dietary Habits of the Irish Population, Dublin, Stationery Office.
Harriss, D.J., Atkinson, G., Batterham, A., George, K., Cable, N.T., Reilly, T., Haboubi, N., Renehan, A.G. & Colorectal Cancer, Lifestyle, Exercise And Research Group 2009, Lifestyle factors and colorectal cancer risk (2): a systematic review and meta-analysis of associations with leisure-time physical activity, Colorectal Dis, vol. 11, no. 7, pp. 689-701.
Hashibe, M., Brennan, P., Chuang, S.C., Boccia, S., Castellsague, X., Chen, C., Curado, M.P., Dal Maso, L., Daudt, A.W., Fabianova, E., Fernandez, L., Wünsch-Filho, V., Franceschi, S., Hayes, R.B., Herrero, R., Kelsey, K., Koifman, S., La Vecchia, C., Lazarus, P., Levi, F., Lence, J.J., Mates, D., Matos, E., Menezes, A., McClean, M.D., Muscat, J., Eluf-Neto, J., Olshan, A.F., Purdue, M., Rudnai, P., Schwartz, S., Smith, E., Sturgis, E.M., Szeszenia-Dabrowska, N., Talamini, R., Wei, Q., Winn, D.M., Shangina, O., Pilarska, A., Zhang, Z.F., Ferro, G., Berthiller, J. & Boffetta, P. 2009, Interaction between tobacco and alcohol use and the risk of head and neck cancer: pooled analysis in the International Head and Neck Cancer Epidemiology Consortium, Cancer Epidemiol Biomarkers Prev, vol. 18, no. 2, pp. 541-550.
Hawkins, N.J. & Ward, R.L. 2001, Sporadic colorectal cancers with microsatellite instability and their possible origin in hyperplastic polyps and serrated adenomas, J Natl Cancer Inst, vol. 93, no. 17, pp. 1307-1313.
Health Service Executive, 2011, National Cancer Control Programme, National Prostate Cancer GP Referral Guidelines, Version 1.3, January 2011. Available at URL http://www.healthlink.ie/Oncology/NCCP%20Prostate% [22] 20Cancer%20Referral%20Guideline%20Version%201.3%20January%202011.pdf [Accessed 27th September 2011]
Heck, J.E [23]., Berthiller, J [24]., Vaccarella, S [25]., Winn, D.M [26]., Smith, E.M [27]., Shan'gina, O [28]., Schwartz, S.M [29]., Purdue, M.P [30]., Pilarska, A [31]., Eluf-Neto, J [32]., Menezes, A [33]., McClean, M.D [34]., Matos, E [35]., Koifman, S [36]., Kelsey, K.T [37]., Herrero, R [38]., Hayes, R.B [39]., Franceschi, S [40]., Wünsch-Filho, V [41]., Fernández, L [42]., Daudt, A.W [43]., Curado, M.P [44]., Chen, C [45]., Castellsagué, X [46]., Ferro, G [47]., Brennan, P [48]., Boffetta, P [49]. & Hashibe, M [50]. 2010, Sexual behaviours and the risk of head and neck cancers: a pooled analysis in the International Head and Neck Cancer Epidemiology (INHANCE) consortium, Int J Epidemiol [51], vol. 39, no. 1, pp. 166-81.
Helicobacter and Cancer Collaborative Group, 2001, Gastric cancer and helicobacter pylori: a combined analysis of 12 case control studies nested within prospective cohorts, Gut, vol. 49, no. 3, pp. 347-353.
Hemminki, K., Bermejo, J.L. & Granstrom, C. 2005, Endometrial cancer: population attributable risks from reproductive, familial and socioeconomic factors, Eur J Cancer, vol. 41, no. 14, pp. 2155-2159.
Hill E.W., Jobling M.A., Bradley D.G., 2000, Y-chromosome variation and Irish origins. Nature, vol. 404, pp. 351– 352.
Hock, L.M., Lynch J., Balaji K.C., 2002. Increasing incidence of all stages of kidney cancer in the last 2 decades in the United States, J Urol, vol. 167, no. 1, pp. 57-60.
Hosgood, H.D.,3rd, Boffetta, P., Greenland, S., Lee, Y.C., McLaughlin, J., Seow, A., Duell, E.J., Andrew, A.S., Zaridze, D., Szeszenia-Dabrowska, N., Rudnai, P., Lissowska, J., Fabianova, E., Mates, D., Bencko, V., Foretova, L., Janout, V., Morgenstern, H., Rothman, N., Hung, R.J., Brennan, P. & Lan, Q. 2010, In-home coal and wood use and lung cancer risk: a pooled analysis of the International Lung Cancer Consortium, Environ Health Perspect, vol. 118, no. 12, pp. 1743-1747.
HSC Public Health Agency, 2011, http://www.cancerscreening.hscni.net/breast/ [52] [accessed 23/09/2011]
Huncharek, M., Haddock, K.S., Reid, R. & Kupelnick, B. 2010, Smoking as a risk factor for prostate cancer: a meta-analysis of 24 prospective cohort studies, Am J Public Health, vol. 100, no. 4, pp. 693-701.
Huncharek, M., Muscat, J. & Kupelnick, B. 2009, Colorectal cancer risk and dietary intake of calcium, vitamin D, and dairy products: a meta-analysis of 26,335 cases from 60 observational studies, Nutr Cancer, vol. 61, no. 1, pp. 47-69.
Hung, R.J [53]., Moore, L [54]., Boffetta, P [49]., Feng, B.J [55]., Toro, J.R [56]., Rothman, N [57]., Zaridze, D [58]., Navratilova, M [59]., Bencko, V [60]., Janout, V [61]., Kollarova, H [62]., Szeszenia-Dabrowska, N [63]., Mates, D [64]., Chow, W.H [65]. & Brennan, P [48]. 2007, Family history and the risk of kidney cancer: a multicenter case-control study in Central Europe, Cancer Epidemiol Biomarkers Prev, [66]vol. 16, no. 6, pp. 1287-90.
Hwang, Y.W., Kim, S.Y., Jee, S.H., Kim, Y.N. & Nam, C.M. 2009, Soy food consumption and risk of prostate cancer: a meta-analysis of observational studies, Nutr Cancer, vol. 61, no. 5, pp. 598-606.
Ildaphonse, G [67]., George, P.S [68]. & Mathew, A [69]. 2009, Obesity and kidney cancer risk in men: a meta-analysis (1992-2008), Asian Pac J Cancer Prev, [70]vol. 10, no. 2, pp. 279-86.
International Agency for Research on Cancer 1987, IARC monographs on the evaluation of carcinogenic risks to humans: overall evaluation of carcinogenicity, IARC, Lyon.
International Agency for Research on Cancer 1992, IARC monographs on the evaluation of carcinogenic risks to humans:solar and ultraviolet radiation, IARC Scientific, Lyon.
International Agency for Research on Cancer 1994 (updated 1997), IARC Working Group on the Evaluation of Carcinogenic Risks to Humans. Volume 61. Schistosomes, liver flukes and Helicobacter pylori. Summary of data reported and evaluation., WHO.
International Agency for Research on Cancer 1997, IARC handbooks of cancer prevention. Non-steroidal anti-inflammatory drugs., IARC, Lyon, France.
International Agency for Research on Cancer 2001, International Agency for Research on Cancer Working Group. IARC handbooks of cancer prevention: sunscreens, IARC, Lyon.
International Agency for Research on Cancer 2002, IARC handbooks of cancer prevention. Volume 6. Weight control and physical activity., IARC Press, Lyon, France.
International Agency for Research on Cancer 2003, IARC handbooks of cancer prevention. Volume 8. Fruit and vegetables., IARC Press, Lyon France.
International Agency for Research on Cancer 2004a. IARC Working Group on the Evaluation of Carcinogenic Risks to Humans. Some drinking-water disinfectants and contaminants, including arsenic. Summary of data reported and evaluation., WHO.
International Agency for Research on Cancer 2004b, IARC Monographs on the Evaluation of Carcinogenic Risks to Humans. Volume 83. Tobacco smoke and involuntary smoking, IARC, Lyon, France.
International Agency for Research on Cancer 2007, IARC Monographs on the Evaluation of Carcinogenic Risks to Humans. Volume 90. Human papillomaviruses, IARC, Lyon, France.
International Agency for Research on Cancer 2011a, IARC Working Group on the Evaluation of Carcinogenic Risks to Humans, A review of human carcinogens. Part A: pharmaceuticals, IARC monographs on the evaluation of carcinogenic risks to humans, Lyon, France.
International Agency for Research on Cancer 2011b, IARC Working Group on the Evaluation of Carcinogenic Risks to Humans, A review of human carcinogens. Part B:biological agents., IARC monographs on the evaluation of carcinogenic risks to humans., Lyon, France.
International Agency for Research on Cancer, 2011c. WHO Cancer Mortality Database. [accessed 23/09/2011]
Ip, S., Chung, M., Raman, G., Trikalinos, T.A. & Lau, J. 2009, A summary of the Agency for Healthcare Research and Quality's evidence report on breastfeeding in developed countries, Breastfeed Med, vol. 4 Suppl 1, pp. S17-30.
Islami, F., Ren, J.S., Taylor, P.R. & Kamangar, F. 2009a, Pickled vegetables and the risk of oesophageal cancer: a meta-analysis, Br J Cancer, vol. 101, no. 9, pp. 1641-1647.
Islami, F., Boffetta, P., Ren, J.S., Pedoeim, L., Khatib, D. & Kamangar, F. 2009b, High-temperature beverages and foods and esophageal cancer risk--a systematic review, Int J Cancer, vol. 125, no. 3, pp. 491-524.
Islami, F., Fedirko, V., Tramacere, I., Bagnardi, V., Jenab, M., Scotti, L., Rota, M., Corrao, G., Garavello, W., Schuz, J., Straif, K., Negri, E., Boffetta, P. & La Vecchia, C. 2010, Alcohol drinking and esophageal squamous cell carcinoma with focus on light-drinkers and never-smokers - A systematic review and meta-analysis, Int J Cancer. 2010 Dec 28; [Epub ahead of print].
Islami, F [71]. & Kamangar, F [72]. 2008, Helicobacter pylori and esophageal cancer risk: a meta-analysis, Cancer Prev Res (Phila), [73]vol. 1, no. 5, pp. 329-38.
Islami, F., Sheikhattari, P., Ren, J.S. & Kamangar, F. 2011, Gastric atrophy and risk of oesophageal cancer and gastric cardia adenocarcinoma--a systematic review and meta-analysis, Ann Oncol, vol. 22, no. 4, pp. 754-760.
Jacobs, E.J., Chanock, S.J., Fuchs, C.S., Lacroix, A., McWilliams, R.R., Steplowski, E., Stolzenberg-Solomon, R.Z., Arslan, A.A., Bueno-de-Mesquita, H.B., Gross, M., Helzlsouer, K., Petersen, G., Zheng, W., Agalliu, I., Allen, N.E., Amundadottir, L., Boutron-Ruault, M.C., Buring, J.E., Canzian, F., Clipp, S., Dorronsoro, M., Gaziano, J.M., Giovannucci, E.L., Hankinson, S.E., Hartge, P., Hoover, R.N., Hunter, D.J., Jacobs, K.B., Jenab, M., Kraft, P., Kooperberg, C., Lynch, S.M., Sund, M., Mendelsohn, J.B., Mouw, T., Newton, C.C., Overvad, K., Palli, D., Peeters, P.H., Rajkovic, A., Shu, X.O., Thomas, G., Tobias, G.S., Trichopoulos, D., Virtamo, J., Wactawski-Wende, J., Wolpin, B.M., Yu, K. & Zeleniuch-Jacquotte, A. 2010, Family history of cancer and risk of pancreatic cancer: a pooled analysis from the Pancreatic Cancer Cohort Consortium (PanScan), Int J Cancer, vol. 127, no. 6, pp. 1421-1428.
Jakimiuk, A.J. & Issat, T. 2009, PCOS and cancer risk, Folia Histochem Cytobiol, vol. 47, no. 5, pp. S101-5.
Jansen-van der Weide, M.C [74]., Greuter, M.J [75]., Jansen, L [76]., Oosterwijk, J.C [77]., Pijnappel, R.M [78]. & de Bock, G.H [79]. 2010, Exposure to low-dose radiation and the risk of breast cancer among women with a familial or genetic predisposition: a meta-analysis, Eur Radiol [80], vol. 20, no. 11, pp. 2547-56.
Jiang, L., Yang, K.H., Tian, J.H., Guan, Q.L., Yao, N., Cao, N., Mi, D.H., Wu, J., Ma, B. & Yang, S.H. 2010, Efficacy of antioxidant vitamins and selenium supplement in prostate cancer prevention: a meta-analysis of randomized controlled trials, Nutr Cancer, vol. 62, no. 6, pp. 719-727.
Jiao, L., Berrington de Gonzalez, A., Hartge, P., Pfeiffer, R.M., Park, Y., Freedman, D.M., Gail, M.H., Alavanja, M.C., Albanes, D., Beane Freeman, L.E., Chow, W.H., Huang, W.Y., Hayes, R.B., Hoppin, J.A., Ji, B.T., Leitzmann, M.F., Linet, M.S., Meinhold, C.L., Schairer, C., Schatzkin, A., Virtamo, J., Weinstein, S.J., Zheng, W. & Stolzenberg-Solomon, R.Z. 2010, Body mass index, effect modifiers, and risk of pancreatic cancer: a pooled study of seven prospective cohorts, Cancer Causes Control, vol. 21, no. 8, pp. 1305-1314.
Jick, H., Walker, A.M. & Rothman, K.J. 1980, The epidemic of endometrial cancer: a commentary, Am J Public Health, vol. 70, no. 3, pp. 264-267.
Johns, L.E. & Houlston, R.S. 2001, A systematic review and meta-analysis of familial colorectal cancer risk, Am J Gastroenterol, vol. 96, no. 10, pp. 2992-3003.
Jordan SJ, Green AC, Whiteman DC, Webb PM; Australian Ovarian Cancer Study Group, 2007, Risk factors for benign, borderline and invasive mucinous ovarian tumors: epidemiological evidence of a neoplastic continuum? Gynecol Oncol, vol. 107, no. 2, pp. 223-30.
Jordan, S.J., Whiteman, D.C., Purdie, D.M., Green, A.C. & Webb, P.M. 2006, Does smoking increase risk of ovarian cancer? A systematic review, Gynecol Oncol, vol. 103, no. 3, pp. 1122-1129.
Karagas, M.R., Stannard, V.A., Mott, L.A., Slattery, M.J., Spencer, S.K. & Weinstock, M.A. 2002, Use of tanning devices and risk of basal cell and squamous cell skin cancers, J Natl Cancer Inst, vol. 94, no. 3, pp. 224-226.
Keegan, H., Ryan, F., Malkin, A., Griffin, M. & Lambkin, H. 2007, Human papillomavirus prevalence and genotypes in an opportunistically screened Irish female population, Br J Biomed Sci, vol. 64, no. 1, pp. 18-22.
Kelleher, C., Nic Gabhainn, S., Friel, S., Corrigan H., Nolan, G., Sixsmith, J., Walsh, O., Cooke, M, 2003, The National Health & Lifestyle Surveys, Department of Health and Children, Dublin/Centre for Health Promotion Studies, National University of Ireland, Galway/Department of Public Health Medicine and Epidemiology, University College Dublin
Kelsh, M.A [81]., Alexander, D.D [82]., Mink, P.J [83]. & Mandel, J.H [84]. 2010, Occupational trichloroethylene exposure and kidney cancer: a meta-analysis, Epidemiology [85], vol. 21, no. 1, pp. 95-102.
Kennedy, D.A., Stern, S.J., Moretti, M., Matok, I., Sarkar, M., Nickel, C. & Koren, G. 2011, Folate intake and the risk of colorectal cancer: a systematic review and meta-analysis, Cancer Epidemiol, vol. 35, no. 1, pp. 2-10.
Key, T.J., Verkasalo, P.K. & Banks, E. 2001, Epidemiology of breast cancer, Lancet Oncol, vol. 2, no. 3, pp. 133-140.
Khuder, S.A., Mutgi, A.B. & Schaub, E.A. 1998, Meta-analyses of brain cancer and farming, Am J Ind Med, vol. 34, no. 3, pp. 252-260.
Kim, H.J., Lim, S.Y., Lee, J.S., Park, S., Shin, A., Choi, B.Y., Shimazu, T., Inoue, M., Tsugane, S. & Kim, J. 2010, Fresh and pickled vegetable consumption and gastric cancer in Japanese and Korean populations: a meta-analysis of observational studies, Cancer Sci, vol. 101, no. 2, pp. 508-516.
Kim, J., Kang, M., Lee, J.S., Inoue, M., Sasazuki, S. & Tsugane, S. 2011, Fermented and non-fermented soy food consumption and gastric cancer in Japanese and Korean populations: a meta-analysis of observational studies, Cancer Sci, vol. 102, no. 1, pp. 231-244.
Kricker, A., Armstrong, B.K., Hughes, A.M., Goumas, C., Smedby, K.E., Zheng, T., Spinelli, J.J., De Sanjose, S., Hartge, P., Melbye, M., Willett, E.V., Becker, N., Chiu, B.C., Cerhan, J.R., Maynadie, M., Staines, A., Cocco, P., Boffeta, P. & Interlymph Consortium 2008, Personal sun exposure and risk of non Hodgkin lymphoma: a pooled analysis from the Interlymph Consortium, Int J Cancer, vol. 122, no. 1, pp. 144-154.
Kuoppala, J., Lamminpaa, A. & Pukkala, E. 2008, Statins and cancer: A systematic review and meta-analysis, Eur J Cancer, vol. 44, no. 15, pp. 2122-2132.
La Torre, G., Chiaradia, G., Gianfagna, F., De Lauretis, A., Boccia, S., Mannocci, A. & Ricciardi, W. 2009, Smoking status and gastric cancer risk: an updated meta-analysis of case-control studies published in the past ten years, Tumori, vol. 95, no. 1, pp. 13-22.
Lacasse, Y., Martin, S., Gagne, D. & Lakhal, L. 2009, Dose-response meta-analysis of silica and lung cancer, Cancer Causes Control, vol. 20, no. 6, pp. 925-933.
Ladeiras-Lopes, R., Pereira, A.K., Nogueira, A., Pinheiro-Torres, T., Pinto, I., Santos-Pereira, R. & Lunet, N. 2008, Smoking and gastric cancer: systematic review and meta-analysis of cohort studies, Cancer Causes Control, vol. 19, no. 7, pp. 689-701.
Lahmann, P.H [86]., Cust, A.E [87],, Friedenreich, C.M [88]., Schulz, M [89]., Lukanova, A [90]., Kaaks, R [91]., Lundin, E [92]., Tjønneland, A [93]., Halkjaer, J [94]., Severinsen, M.T [95]., Overvad, K [96]., Fournier, A [97]., Chabbert-Buffet, N [98]., Clavel-Chapelon, F [99]., Dossus, L [100]., Pischon, T [101]., Boeing, H [102]., Trichopoulou, A [103]., Lagiou, P [104]., Naska, A [105]., Palli, D [106]., Grioni, S [107]., Mattiello, A [108]., Tumino, R [109]., Sacerdote, C [110]., Redondo, M.L [111]., Jakszyn, P [112]., Sánchez, M.J [113]., Tormo, M.J [114]., Ardanaz, E [115]., Arriola, L [116]., Manjer, J [117]., Jirström, K [118]., Bueno-de-Mesquita, H.B [119]., May, A.M [120]., Peeters, P.H [121]., Onland-Moret, N.C [122]., Bingham, S [123]., Khaw, K.T [124]., Allen, N.E [125]., Spencer, E [126]., Rinaldi, S [127]., Slimani, N [128]., Chajes, V [129]., Michaud, D [130]., Norat, T [131]. & Riboli, E [132]. 2010, Anthropometric measures and epithelial ovarian cancer risk in the European Prospective Investigation into Cancer and Nutrition, Int J Cancer, [133]vol. 126, no. 10, pp. 2404-15.
Lam, T.K., Gallicchio, L., Lindsley, K., Shiels, M., Hammond, E., Tao, X.G., Chen, L., Robinson, K.A., Caulfield, L.E., Herman, J.G., Guallar, E. & Alberg, A.J. 2009, Cruciferous vegetable consumption and lung cancer risk: a systematic review, Cancer Epidemiol Biomarkers Prev, vol. 18, no. 1, pp. 184-195.
Lang I.A., Gibbs S.J., Steel N., Melzer D., 2008, Neighbourhood deprivation and dental service use: a cross-sectional analysis of older people in England, J Public Health (Oxf), vol. 30, no. 4, pp. 472-8
Larsson, S.C. & Wolk, A. 2007, Obesity and risk of non-Hodgkin's lymphoma: a meta-analysis, Int J Cancer, vol. 121, no. 7, pp. 1564-1570.
Larsson, S.C. & Wolk, A. 2008, Overweight and obesity and incidence of leukemia: a meta-analysis of cohort studies, Int J Cancer, vol. 122, no. 6, pp. 1418-1421.
Larsson, S.C., Orsini, N. & Wolk, A. 2005, Diabetes mellitus and risk of colorectal cancer: a meta-analysis, J Natl Cancer Inst, vol. 97, no. 22, pp. 1679-1687.
Larsson, S.C., Orsini, N. & Wolk, A. 2010, Vitamin B6 and risk of colorectal cancer: a meta-analysis of prospective studies, JAMA, vol. 303, no. 11, pp. 1077-1083.
Larsson, S.C., Orsini, N., Brismar, K. & Wolk, A. 2006, Diabetes mellitus and risk of bladder cancer: a meta-analysis, Diabetologia, vol. 49, no. 12, pp. 2819-2823.
Lawson, A.B., Biggeri, A.B., Boehning, D., Lesaffre, E., Viel, J.F., Clark, A., Schlattmann, P. & Divino, F. 2000, Disease mapping models: an empirical evaluation. Disease mapping collaborative group., Stat Med, vol. 19, no. 17-18, pp. 2217-2241.
Layte R., Harrington J., Sexton E., Perry I.J., Cullinan J., Lyons S., 2011, Irish exceptionalism? Local food environments and dietary quality, J Epidemiol Community Health., vol. 65, no. 10, pp. 881-8.
Lee, J.E., Hunter, D.J., Spiegelman, D., Adami, H.O., Albanes, D., Bernstein, L., van den Brandt, P.A., Buring, J.E., Cho, E., Folsom, A.R., Freudenheim, J.L., Giovannucci, E., Graham, S., Horn-Ross, P.L., Leitzmann, M.F., McCullough, M.L., Miller, A.B., Parker, A.S., Rodriguez, C., Rohan, T.E., Schatzkin, A., Schouten, L.J., Virtanen, M., Willett, W.C., Wolk, A., Zhang, S.M. & Smith-Warner, S.A. 2007, Alcohol intake and renal cell cancer in a pooled analysis of 12 prospective studies, J Natl Cancer Inst, vol. 99, no. 10, pp. 801-810.
Lee, P.N. & Hamling, J. 2009, Systematic review of the relation between smokeless tobacco and cancer in Europe and North America, BMC Med, vol. 7, pp. 36.
Lee, Y.C., Boffetta, P., Sturgis, E.M., Wei, Q., Zhang, Z.F., Muscat, J., Lazarus, P., Matos, E., Hayes, R.B., Winn, D.M., Zaridze, D., Wunsch-Filho, V., Eluf-Neto, J., Koifman, S., Mates, D., Curado, M.P., Menezes, A., Fernandez, L., Daudt, A.W., Szeszenia-Dabrowska, N., Fabianova, E., Rudnai, P., Ferro, G., Berthiller, J., Brennan, P. & Hashibe, M. 2008, Involuntary smoking and head and neck cancer risk: pooled analysis in the International Head and Neck Cancer Epidemiology Consortium, Cancer Epidemiol Biomarkers Prev, vol. 17, no. 8, pp. 1974-1981.
Lenters, V., Basinas, I., Beane-Freeman, L., Boffetta, P., Checkoway, H., Coggon, D., Portengen, L., Sim, M., Wouters, I.M., Heederik, D. & Vermeulen, R. 2010, Endotoxin exposure and lung cancer risk: a systematic review and meta-analysis of the published literature on agriculture and cotton textile workers, Cancer Causes Control, vol. 21, no. 4, pp. 523-555.
Li, D., Tang, H., Hassan, M.M., Holly, E.A., Bracci, P.M. & Silverman, D.T. 2011, Diabetes and risk of pancreatic cancer: a pooled analysis of three large case-control studies, Cancer Causes Control, vol. 22, no. 2, pp. 189-197.
Li, N., Yang, L., Zhang, Y., Zhao, P., Zheng, T. & Dai, M. 2011, Human papillomavirus infection and bladder cancer risk: a meta-analysis, J Infect Dis, vol. 204, no. 2, pp. 217-223.
Liang, H.Y., Li, X.L., Yu, X.S., Guan, P., Yin, Z.H., He, Q.C. & Zhou, B.S. 2009, Facts and fiction of the relationship between preexisting tuberculosis and lung cancer risk: a systematic review, Int J Cancer, vol. 125, no. 12, pp. 2936-2944.
Lichtman, M.A. 2010, Obesity and the risk for a hematological malignancy: leukemia, lymphoma, or myeloma, Oncologist, vol. 15, no. 10, pp. 1083-1101.
Lissowska, J., Foretova, L., Dabek, J., Zaridze, D., Szeszenia-Dabrowska, N., Rudnai, P., Fabianova, E., Cassidy, A., Mates, D., Bencko, V., Janout, V., Hung, R.J., Brennan, P. & Boffetta, P. 2010, Family history and lung cancer risk: international multicentre case-control study in Eastern and Central Europe and meta-analyses, Cancer Causes Control, vol. 21, no. 7, pp. 1091-1104.
Ljungberg, B., Campbell, S.C., Cho, H.Y., Jacqmin, D., Lee, J.E., Weikert, S. & Kiemeney, L.A. 2011, The epidemiology of renal cell carcinoma, Eur Urol. 2011 vol. 60 no. 4 pp. 615-21
Lubin, J.H., Muscat, J., Gaudet, M.M., Olshan, A.F., Curado, M.P., Dal Maso, L., Wunsch-Filho, V., Sturgis, E.M., Szeszenia-Dabrowska, N., Castellsague, X., Zhang, Z.F., Smith, E., Fernandez, L., Matos, E., Franceschi, S., Fabianova, E., Rudnai, P., Purdue, M.P., Mates, D., Wei, Q., Herrero, R., Kelsey, K., Morgenstern, H., Shangina, O., Koifman, S., Lissowska, J., Levi, F., Daudt, A.W., Neto, J.E., Chen, C., Lazarus, P., Winn, D.M., Schwartz, S.M., Boffetta, P., Brennan, P., Menezes, A., La Vecchia, C., McClean, M., Talamini, R., Rajkumar, T., Hayes, R.B. & Hashibe, M. 2011, An examination of male and female odds ratios by BMI, cigarette smoking, and alcohol consumption for cancers of the oral cavity, pharynx, and larynx in pooled data from 15 case-control studies, Cancer Causes Control, vol. 22, no. 9, pp. 1217-1231.
Lucenteforte, E., La Vecchia, C., Silverman, D., Petersen, G.M., Bracci, P.M., Ji, B.T., Bosetti, C., Li, D., Gallinger, S., Miller, A.B., Bueno-de-Mesquita, H.B., Talamini, R., Polesel, J., Ghadirian, P., Baghurst, P.A., Zatonski, W., Fontham, E., Bamlet, W.R., Holly, E.A., Gao, Y.T., Negri, E., Hassan, M., Cotterchio, M., Su, J., Maisonneuve, P., Boffetta, P. & Duell, E.J. 2011, Alcohol consumption and pancreatic cancer: a pooled analysis in the International Pancreatic Cancer Case-Control Consortium (PanC4), Ann Oncol. 2011 May 2; [Epub ahead of print].
Lucenteforte, E., Talamini, R., Montella, M., Dal Maso, L., Pelucchi, C., Franceschi, S., La Vecchia, C. & Negri, E. 2009, Family history of cancer and the risk of endometrial cancer, Eur J Cancer Prev, vol. 18, no. 2, pp. 95-99.
Lunn, D.J., Thomas, A., Best, N. & Spiegelhalter, D. 2000, WinBUGS -- a Bayesian modelling framework: concepts, structure, and extensibility., Stat Comput, vol. 10, pp. 325-337.
Lynch, S.M., Vrieling, A., Lubin, J.H., Kraft, P., Mendelsohn, J.B., Hartge, P., Canzian, F., Steplowski, E., Arslan, A.A., Gross, M., Helzlsouer, K., Jacobs, E.J., LaCroix, A., Petersen, G., Zheng, W., Albanes, D., Amundadottir, L., Bingham, S.A., Boffetta, P., Boutron-Ruault, M.C., Chanock, S.J., Clipp, S., Hoover, R.N., Jacobs, K., Johnson, K.C., Kooperberg, C., Luo, J., Messina, C., Palli, D., Patel, A.V., Riboli, E., Shu, X.O., Rodriguez Suarez, L., Thomas, G., Tjonneland, A., Tobias, G.S., Tong, E., Trichopoulos, D., Virtamo, J., Ye, W., Yu, K., Zeleniuch-Jacquette, A., Bueno-de-Mesquita, H.B. & Stolzenberg-Solomon, R.Z. 2009, Cigarette smoking and pancreatic cancer: a pooled analysis from the pancreatic cancer cohort consortium, Am J Epidemiol, vol. 170, no. 4, pp. 403-413.
Magruder, J.T., Elahi, D. & Andersen, D.K. 2011, Diabetes and pancreatic cancer: chicken or egg?, Pancreas, vol. 40, no. 3, pp. 339-351.
Mahmud, S.M., Franco, E.L. & Aprikian, A.G. 2010, Use of nonsteroidal anti-inflammatory drugs and prostate cancer risk: a meta-analysis, Int J Cancer, vol. 127, no. 7, pp. 1680-1691.
Maisonneuve, P. & Lowenfels, A.B. 2010, Epidemiology of pancreatic cancer: an update, Dig Dis, vol. 28, no. 4-5, pp. 645-656.
Mandel, J.H., Kelsh, M.A., Mink, P.J., Alexander, D.D., Kalmes, R.M., Weingart, M., Yost, L. & Goodman, M. 2006, Occupational trichloroethylene exposure and non-Hodgkin's lymphoma: a meta-analysis and review, Occup Environ Med, vol. 63, no. 9, pp. 597-607.
Manju, L., George, P.S. & Mathew, A. 2009, Urinary bladder cancer risk among motor vehicle drivers: a meta-analysis of the evidence, 1977-2008, Asian Pac J Cancer Prev, vol. 10, no. 2, pp. 287-294.
Mathew, A [69]., George, P.S [68]. & Ildaphonse, G [67]. 2009, Obesity and kidney cancer risk in women: a meta-analysis (1992-2008), Asian Pac J Cancer Prev, [134]vol. 10, no. 3, pp. 471-8.
McBride D., Hardoon S., Walters K., Gilmour S., Raine R., 2010, Explaining variation in referral from primary to secondary care: cohort study, BMJ, vol. ;341:c6267
McCarthy, B.J., Rankin, K.M., Aldape, K., Bondy, M.L., Brannstrom, T., Broholm, H., Feychting, M., Il'yasova, D., Inskip, P.D., Johansen, C., Melin, B.S., Ruder, A.M., Butler, M.A., Scheurer, M.E., Schuz, J., Schwartzbaum, J.A., Wrensch, M.R. & Davis, F.G. 2011, Risk factors for oligodendroglial tumors: a pooled international study, Neuro Oncol, vol. 13, no. 2, pp. 242-250.
Michaud, D.S., Vrieling, A., Jiao, L., Mendelsohn, J.B., Steplowski, E., Lynch, S.M., Wactawski-Wende, J., Arslan, A.A., Bas Bueno-de-Mesquita, H., Fuchs, C.S., Gross, M., Helzlsouer, K., Jacobs, E.J., Lacroix, A., Petersen, G., Zheng, W., Allen, N., Ammundadottir, L., Bergmann, M.M., Boffetta, P., Buring, J.E., Canzian, F., Chanock, S.J., Clavel-Chapelon, F., Clipp, S., Freiberg, M.S., Michael Gaziano, J., Giovannucci, E.L., Hankinson, S., Hartge, P., Hoover, R.N., Allan Hubbell, F., Hunter, D.J., Hutchinson, A., Jacobs, K., Kooperberg, C., Kraft, P., Manjer, J., Navarro, C., Peeters, P.H., Shu, X.O., Stevens, V., Thomas, G., Tjonneland, A., Tobias, G.S., Trichopoulos, D., Tumino, R., Vineis, P., Virtamo, J., Wallace, R., Wolpin, B.M., Yu, K., Zeleniuch-Jacquotte, A. & Stolzenberg-Solomon, R.Z. 2010, Alcohol intake and pancreatic cancer: a pooled analysis from the pancreatic cancer cohort consortium (PanScan), Cancer Causes Control, vol. 21, no. 8, pp. 1213-1225.
The influence of mammographic screening on national trends in breast cancer incidence, Møller B., Weedon-Fekjaer H., Hakulinen T., Tryggvadóttir L., Storm H. H., Talbäck M., Haldorsen T., 2005, Eur J Cancer Prev, vol. 14, no. 2, pp. 117-28.
Morgan, K., McGee, H., Watson, D., Perry, I., Barry, M., Shelley, E., Harrington, J., Molcho, M., Layte, R., Tully, N., van Lente, E., Ward, M., Lutomski, J., Conroy, R. & Brugha, R. 2008, SLÁN 2007: survey of lifestyle, attitudes & nutrition in Ireland. Main report. Dublin: Department of Health & Children, The Stationery Office, Dublin, Ireland.
Morgan, K., McGee, H., Dicker, P., Brugha, R., Ward, M., Shelley, E., Van Lente, E., Harrington, J., Barry, M., Perry, I. and Watson, D., 2009. SLÁN 2007: Survey of Lifestyle, Attitudes and Nutrition in Ireland. Alcohol use in Ireland: A profile of drinking patterns and alcohol-related harm from SLÁN 2007, Dublin. The Stationery Office.
Morrissey K, Clarke G, Ballas D, Hynes S, O’Donoghue C, 2008, Examining access to GP services in rural Ireland using microsimulation data, Area vol. 40, no.3 pp. 354-64.
Morton, L.M., Hartge, P., Holford, T.R., Holly, E.A., Chiu, B.C., Vineis, P., Stagnaro, E., Willett, E.V., Franceschi, S., La Vecchia, C., Hughes, A.M., Cozen, W., Davis, S., Severson, R.K., Bernstein, L., Mayne, S.T., Dee, F.R., Cerhan, J.R. & Zheng, T. 2005, Cigarette smoking and risk of non-Hodgkin lymphoma: a pooled analysis from the International Lymphoma Epidemiology Consortium (interlymph), Cancer Epidemiol Biomarkers Prev, vol. 14, no. 4, pp. 925-933.
Mulholland, H.G., Murray, L.J., Cardwell, C.R. & Cantwell, M.M. 2008, Dietary glycaemic index, glycaemic load and endometrial and ovarian cancer risk: a systematic review and meta-analysis, Br J Cancer, vol. 99, no. 3, pp. 434-441.
Murray, L.J., McCrum, E.E., Evans, A.E. & Bamford, K.B. 1997, Epidemiology of helicobacter pylori infection among 4742 randomly selected subjects from Northern Ireland, Int J Epidemiol, vol. 26, no. 4, pp. 880-887.
Myung, S.K., Ju, W., Choi, H.J., Kim, S.C. & Korean Meta-Analysis (KORMA) Study Group 2009, Soy intake and risk of endocrine-related gynaecological cancer: a meta-analysis, BJOG, vol. 116, no. 13, pp. 1697-1705.
Nagle, C.M., Olsen, C.M., Webb, P.M., Jordan, S.J., Whiteman, D.C., Green, A.C., Australian Cancer Study Group, Australian Ovarian Cancer Study Group, 2008, Endometrioid and clear cell ovarian cancers: a comparative analysis of risk factors. Eur J Cancer, vol. 44, no. 16, pp. 2477-84.
National Cancer Registry, 2010a, Cancer trends: leukaemia, National Cancer Registry, Cork
National Cancer Registry, 2010b, Cancer Trends: cancers of the brain and central nervous system, National Cancer Registry, Cork
National Cancer Registry, 2011, Cancer in Ireland 2011: annual report of the National Cancer Registry, National Cancer Registry, Cork
National Cancer Screening Service, 2010, BreastCheck Programme Report 2009-2010. HSE, Dublin.
National Toxicology Program 2008, Final Report on Carcinogens Background Document for Styrene, Department of Health and Human Services, North Carolina.
National Toxicology Program 2010, Final Report on Carcinogens Background Document for Formaldehyde, Department of Health and Human Services, North Carolina.
National Toxicology Program, 2011, Report on Carcinogens Twelfth Edition, Department of Health and Human Services, North Carolina.
Negri, E., Boffetta, P., Berthiller, J., Castellsague, X., Curado, M.P., Dal Maso, L., Daudt, A.W., Fabianova, E., Fernandez, L., Wunsch-Filho, V., Franceschi, S., Hayes, R.B., Herrero, R., Koifman, S., Lazarus, P., Lence, J.J., Levi, F., Mates, D., Matos, E., Menezes, A., Muscat, J., Eluf-Neto, J., Olshan, A.F., Rudnai, P., Shangina, O., Sturgis, E.M., Szeszenia-Dabrowska, N., Talamini, R., Wei, Q., Winn, D.M., Zaridze, D., Lissowska, J., Zhang, Z.F., Ferro, G., Brennan, P., La Vecchia, C. & Hashibe, M. 2009, Family history of cancer: pooled analysis in the International Head and Neck Cancer Epidemiology Consortium, Int J Cancer, vol. 124, no. 2, pp. 394-401.
Ness, R.B., Cramer, D.W., Goodman, M.T., Kjaer, S.K., Mallin, K., Mosgaard, B.J., Purdie, D.M., Risch, H.A., Vergona, R. & Wu, A.H. 2002, Infertility, fertility drugs, and ovarian cancer: a pooled analysis of case-control studies, Am J Epidemiol, vol. 155, no. 3, pp. 217-224.
Newcomb, P.A. & Trentham-Dietz, A. 2000, Breast feeding practices in relation to endometrial cancer risk, USA, Cancer Causes Control, vol. 11, no. 7, pp. 663-667.
Ning, Y., Wang, L. & Giovannucci, E.L. 2010, A quantitative analysis of body mass index and colorectal cancer: findings from 56 observational studies, Obesity reviews : an official journal of the International Association for the Study of Obesity, vol. 11, no. 1, pp. 19-30.
Northern Ireland Statistics and Research Agency, 1982. Census 1981.
Northern Ireland Statistics and Research Agency, 2003. Census 2001 Output. Retrieved 1/4/2011, from http://www.nisra.gov.uk/Census.html [135].
Northern Ireland Statistics and Research Agency, 2010a. Central postcode directory, http://www.nisra.gov.uk [136].
Northern Ireland Statistics and Research Agency, 2010b. Continuous Household Survey. http://www.ninis.nisra.gov.uk/mapxtreme/DataCatalogue.asp?button=Health [137]
Noto, H., Osame, K., Sasazuki, T. & Noda, M. 2010, Substantially increased risk of cancer in patients with diabetes mellitus: a systematic review and meta-analysis of epidemiologic evidence in Japan, Journal of diabetes and its complications, vol. 24, no. 5, pp. 345-353.
O'Dushlaine C.T., Dolan C., Weale M.E., Stanton A., Croke D.T., Kalviainen R., Eriksson K., Kantanen A.M., Gibson R.A., Hosford D., Sisodiya S.M., Gill M., Corvin A.P., Morris D.W., Delanty N., Cavalleri G.L., 2008, An assessment of the Irish population for large-scale genetic mapping studies involving epilepsy and other complex diseases. Eur J Hum Genet, vol. 16, no. 2, pp.176-83
Office of Tobacco Control 2010, http://www.otc.ie/fig.asp?image=2010Charts/Fig2.1.jpg [138] [accessed 19/9/2011]
Olsen, C.M., Bain, C.J., Jordan, S.J., Nagle, C.M., Green, A.C., Whiteman, D.C., Webb, P.M. & Australian Ovarian Cancer Study Group 2007, Recreational physical activity and epithelial ovarian cancer: a case-control study, systematic review, and meta-analysis, Cancer Epidemiol Biomarkers Prev, vol. 16, no. 11, pp. 2321-2330.
Olsen, C.M., Carroll, H.J. & Whiteman, D.C. 2010a, Estimating the attributable fraction for cancer: A meta-analysis of nevi and melanoma, Cancer Prev Res (Phila), vol. 3, no. 2, pp. 233-245.
Olsen, C.M., Carroll, H.J. & Whiteman, D.C. 2010b, Estimating the attributable fraction for melanoma: a meta-analysis of pigmentary characteristics and freckling, Int J Cancer, vol. 127, no. 10, pp. 2430-2445.
Olsen, C.M., Carroll, H.J. & Whiteman, D.C. 2010c, Familial melanoma: a meta-analysis and estimates of attributable fraction, Cancer Epidemiol Biomarkers Prev, vol. 19, no. 1, pp. 65-73.
Olsen, C.M., Green, A.C., Zens, M.S., Stukel, T.A., Bataille, V., Berwick, M., Elwood, J.M., Gallagher, R., Holly, E.A., Kirkpatrick, C., Mack, T., Osterlind, A., Rosso, S., Swerdlow, A.J. & Karagas, M.R. 2008, Anthropometric factors and risk of melanoma in women: a pooled analysis, Int J Cancer, vol. 122, no. 5, pp. 1100-1108.
Olsen, C.M., Zens, M.S., Green, A.C., Stukel, T.A., Holman, C.D., Mack, T., Elwood, J.M., Holly, E.A., Sacerdote, C., Gallagher, R., Swerdlow, A.J., Armstrong, B.K., Rosso, S., Kirkpatrick, C., Zanetti, R., Bishop, J.N., Bataille, V., Chang, Y.M., Mackie, R., Osterlind, A., Berwick, M., Karagas, M.R. & Whiteman, D.C. 2011, Biologic markers of sun exposure and melanoma risk in women: pooled case-control analysis, Int J Cancer, vol. 129, no. 3, pp. 713-723.
Olsson, A.C., Gustavsson, P., Kromhout, H., Peters, S., Vermeulen, R., Bruske, I., Pesch, B., Siemiatycki, J., Pintos, J., Bruning, T., Cassidy, A., Wichmann, H.E., Consonni, D., Landi, M.T., Caporaso, N., Plato, N., Merletti, F., Mirabelli, D., Richiardi, L., Jockel, K.H., Ahrens, W., Pohlabeln, H., Lissowska, J., Szeszenia-Dabrowska, N., Zaridze, D., Stucker, I., Benhamou, S., Bencko, V., Foretova, L., Janout, V., Rudnai, P., Fabianova, E., Dumitru, R.S., Gross, I.M., Kendzia, B., Forastiere, F., Bueno-de-Mesquita, B., Brennan, P., Boffetta, P. & Straif, K. 2011, Exposure to diesel motor exhaust and lung cancer risk in a pooled analysis from case-control studies in Europe and Canada, Am J Respir Crit Care Med, vol. 183, no. 7, pp. 941-948.
O'Rorke, M.A., Cantwell, M.M., Cardwell, C.R., Mulholland, H.G. & Murray, L.J. 2010, Can physical activity modulate pancreatic cancer risk? a systematic review and meta-analysis, Int J Cancer, vol. 126, no. 12, pp. 2957-2968.
Pascutto, C., Wakefield, J.C., Best, N.G., Richardson, S., Bernardinelli, L., Staines, A. & Elliott, P. 2000, Statistical issues in the analysis of disease mapping data, Stat Med, vol. 19, pp. 2493-2519.
Pearce, C.L., Chung, K., Pike, M.C. & Wu, A.H. 2009, Increased ovarian cancer risk associated with menopausal estrogen therapy is reduced by adding a progestin, Cancer, vol. 115, no. 3, pp. 531-539.
Pera, M., Manterola, C., Vidal, O. & Grande, L. 2005, Epidemiology of esophageal adenocarcinoma, J Surg Oncol , vol. 92, no. 3, pp. 151-159.
Peters, S., Kromhout, H., Olsson, A.C., Wichmann, H.E., Bruske, I., Consonni, D., Landi, M.T., Caporaso, N., Siemiatycki, J., Richiardi, L., Mirabelli, D., Simonato, L., Gustavsson, P., Plato, N., Jockel, K.H., Ahrens, W., Pohlabeln, H., Boffetta, P., Brennan, P., Zaridze, D., Cassidy, A., Lissowska, J., Szeszenia-Dabrowska, N., Rudnai, P., Fabianova, E., Forastiere, F., Bencko, V., Foretova, L., Janout, V., Stucker, I., Dumitru, R.S., Benhamou, S., Bueno-de-Mesquita, B., Kendzia, B., Pesch, B., Straif, K., Bruning, T. & Vermeulen, R. 2011, Occupational exposure to organic dust increases lung cancer risk in the general population, Thorax. 2011 Aug 19; [Epub ahead of print]
Peto, R., Darby, S., Deo, H., Silcocks, P., Whitley, E., Doll, R., 2000, Smoking, smoking cessation, and lung cancer in the UK since 1950: combination of national statistics with two case-control studies, BMJ, vol. 321, no. 7257, pp. 323-9.
Pitard, A., Brennan, P., Clavel, J., Greiser, E., Lopez-Abente, G., Chang-Claude, J., Wahrendorf, J., Serra, C., Kogevinas, M. & Boffetta, P. 2001, Cigar, pipe, and cigarette smoking and bladder cancer risk in European men, Cancer Causes Control, vol. 12, no. 6, pp. 551-556.
Purdie, D.M. & Green, A.C. 2001, Epidemiology of endometrial cancer, Baillieres Best Pract Res Clin Obstet Gynaecol, vol. 15, no. 3, pp. 341-354.
Puskin, J.S [139]. 2003, Smoking as a confounder in ecologic correlations of cancer mortality rates with average county radon levels, Health Phys, [140]vol. 84, no. 4, pp. 526-32.
Quinn, M [141]. & Babb, P [142]. 2002, Patterns and trends in prostate cancer incidence, survival, prevalence and mortality. Part I: international comparisons, BJU Int, [143] vol. 90, no. 2, pp. 162-73.
Quinn, M., Wood, H., Cooper, N. & Rowan, S. 2005, Cancer atlas of the United Kingdom and Ireland 1991-2000. Studies on medical and populatin subjects no. 68, Palgrave MacMillan, Hampshire, England.
Rahman, M.B., Driscoll, T., Cowie, C. & Armstrong, B.K. 2010, Disinfection by-products in drinking water and colorectal cancer: a meta-analysis, Int J Epidemiol, vol. 39, no. 3, pp. 733-745.
Raimondi, S., Lowenfels, A.B., Morselli-Labate, A.M., Maisonneuve, P. & Pezzilli, R. 2010, Pancreatic cancer in chronic pancreatitis; aetiology, incidence, and early detection, Baillieres Best Pract Res Clin Gastroenterol, vol. 24, no. 3, pp. 349-358.
Reeves, G.K., Pirie, K., Green, J., Bull, D., Beral, V. & Million Women Study Collaborators 2009, Reproductive factors and specific histological types of breast cancer: prospective study and meta-analysis, Br J Cancer, vol. 100, no. 3, pp. 538-544.
Renehan, A.G., Tyson, M., Egger, M., Heller, R.F. & Zwahlen, M. 2008, Body-mass index and incidence of cancer: a systematic review and meta-analysis of prospective observational studies, Lancet, vol. 371, no. 9612, pp. 569-578.
Reulen, R.C., Kellen, E., Buntinx, M., Brinkman, M. & Zeegers, M.P. 2008, A meta-analysis on the association between bladder cancer and occupation, Scand J Urol Nephrol Suppl, vol. 218, pp. 64-78.
Richardson, S., Thomson, A., Best, N. & Elliott, P. 2004, Interpreting posterior relative risk estimates in disease-mapping studies, Environ Health Perspect, vol. 112, no. 9, pp. 1016-1025.
Riman, T., Nilsson, S. & Persson, I.R. 2004, Review of epidemiological evidence for reproductive and hormonal factors in relation to the risk of epithelial ovarian malignancies, Acta Obstet Gynecol Scand, vol. 83, no. 9, pp. 783-795.
Rinaldi, S., Cleveland, R., Norat, T., Biessy, C., Rohrmann, S., Linseisen, J., Boeing, H., Pischon, T., Panico, S., Agnoli, C., Palli, D., Tumino, R., Vineis, P., Peeters, P.H., van Gils, C.H., Bueno-de-Mesquita, B.H., Vrieling, A., Allen, N.E., Roddam, A., Bingham, S., Khaw, K.T., Manjer, J., Borgquist, S., Dumeaux, V., Torhild Gram, I., Lund, E., Trichopoulou, A., Makrygiannis, G., Benetou, V., Molina, E., Donate Suarez, I., Barricarte Gurrea, A., Gonzalez, C.A., Tormo, M.J., Altzibar, J.M., Olsen, A., Tjonneland, A., Gronbaek, H., Overvad, K., Clavel-Chapelon, F., Boutron-Ruault, M.C., Morois, S., Slimani, N., Boffetta, P., Jenab, M., Riboli, E. & Kaaks, R. 2010, Serum levels of IGF-I, IGFBP-3 and colorectal cancer risk: results from the EPIC cohort, plus a meta-analysis of prospective studies, Int J Cancer, vol. 126, no. 7, pp. 1702-1715.
Rokkas, T., Pistiolas, D., Sechopoulos, P., Robotis, I. & Margantinis, G. 2007, Relationship between Helicobacter pylori infection and esophageal neoplasia: a meta-analysis, Clin Gastroenterol Hepatol, vol. 5, no. 12, pp. 1413-1417.
Rosato, V., Tavani, A., Bosetti, C., Pelucchi, C., Talamini, R., Polesel, J., Serraino, D., Negri, E. & La Vecchia, C. 2011, Metabolic syndrome and pancreatic cancer risk: a case-control study in Italy and meta-analysis, Metabolism. Vol. 60, no. 10, pp. 1372-8.
Rowlands, M.A., Gunnell, D., Harris, R., Vatten, L.J., Holly, J.M. & Martin, R.M. 2009, Circulating insulin-like growth factor peptides and prostate cancer risk: a systematic review and meta-analysis, Int J Cancer, vol. 124, no. 10, pp. 2416-2429.
Saladi, R.N. & Persaud, A.N. 2005, The causes of skin cancer: a comprehensive review, Drugs Today (Barc), vol. 41, no. 1, pp. 37-53.
Salazar-Martinez, E., Lazcano-Ponce, E.C., Gonzalez Lira-Lira, G., Escudero-De los Rios, P., Salmeron-Castro, J. & Hernandez-Avila, M. 1999, Reproductive factors of ovarian and endometrial cancer risk in a high fertility population in Mexico, Can Res, vol. 59, no. 15, pp. 3658-3662.
Scélo, G. & Brennan, P. 2007, The epidemiology of bladder and kidney cancer, Nature Clinical Practice Urology, vol. 4, no. 4, pp. 205-217 Review.
Schoemaker, M.J., Swerdlow, A.J., Hepworth, S.J., McKinney, P.A., van Tongeren, M. & Muir, K.R. 2006, History of allergies and risk of glioma in adults, Int J Cancer, vol. 119, no. 9, pp. 2165-2172.
Schouten, L.J., Rivera, C., Hunter, D.J., Spiegelman, D., Adami, H.O., Arslan, A., Beeson, W.L., van den Brandt, P.A., Buring, J.E., Folsom, A.R., Fraser, G.E., Freudenheim, J.L., Goldbohm, R.A., Hankinson, S.E., Lacey, J.V.,Jr, Leitzmann, M., Lukanova, A., Marshall, J.R., Miller, A.B., Patel, A.V., Rodriguez, C., Rohan, T.E., Ross, J.A., Wolk, A., Zhang, S.M. & Smith-Warner, S.A. 2008, Height, body mass index, and ovarian cancer: a pooled analysis of 12 cohort studies, Cancer Epidemiol Biomarkers Prev, vol. 17, no. 4, pp. 902-912.
Schwilk, E., Zhang, L., Smith, M.T., Smith, A.H. & Steinmaus, C. 2010, Formaldehyde and leukemia: an updated meta-analysis and evaluation of bias, J Occup Environ Med, vol. 52, no. 9, pp. 878-886.
Secretan, B., Straif, K., Baan, R., Grosse, Y., El Ghissassi, F., Bouvard, V., Benbrahim-Tallaa, L., Guha, N., Freeman, C., Galichet, L., Cogliano, V. & WHO International Agency for Research on Cancer Monograph Working Group 2009, A review of human carcinogens--Part E: tobacco, areca nut, alcohol, coal smoke, and salted fish, Lancet Oncol, vol. 10, no. 11, pp. 1033-1034.
Segnan, N. 1997, Socioeconomic status and cancer screening in Social inequalities and cancer, No. 138 edn, IARC Scientific Publications, Lyon, pp. 369-376.
Sheehan K.M., Byrne M.F., Murray F.E., 2004, The seroprevalence of Helicobacter pylori in an Irish university student population, J Infect, vol. 48, no. 3, pp. 283-4.
Sidorchuk, A., Agardh, E.E., Aremu, O., Hallqvist, J., Allebeck, P. & Moradi, T. 2009, Socioeconomic differences in lung cancer incidence: a systematic review and meta-analysis, Cancer Causes Control, vol. 20, no. 4, pp. 459-471.
Smith, M., Zhou, M., Whitlock, G., Yang, G., Offer, A., Hui, G., Peto, R., Huang, Z. & Chen, Z. 2008, Esophageal cancer and body mass index: results from a prospective study of 220,000 men in China and a meta-analysis of published studies, Int J Cancer, vol. 122, no. 7, pp. 1604-1610.
Straif, K., Benbrahim-Tallaa, L., Baan, R., Grosse, Y., Secretan, B., El Ghissassi, F., Bouvard, V., Guha, N., Freeman, C., Galichet, L., Cogliano, V. & WHO International Agency for Research on Cancer Monograph Working Group 2009, A review of human carcinogens--part C: metals, arsenic, dusts, and fibres, Lancet Oncol, vol. 10, no. 5, pp. 453-454.
Stratton, J.F., Pharoah, P., Smith, S.K., Easton, D. & Ponder, B.A. 1998, A systematic review and meta-analysis of family history and risk of ovarian cancer, Br J Obstet Gynaecol, vol. 105, no. 5, pp. 493-499.
Suzuki, R., Orsini, N., Mignone, L., Saji, S. & Wolk, A. 2008, Alcohol intake and risk of breast cancer defined by estrogen and progesterone receptor status--a meta-analysis of epidemiological studies, Int J Cancer, vol. 122, no. 8, pp. 1832-1841.
Suzuki, R., Orsini, N., Saji, S., Key, T.J. & Wolk, A. 2009, Body weight and incidence of breast cancer defined by estrogen and progesterone receptor status--a meta-analysis, Int J Cancer, vol. 124, no. 3, pp. 698-712.
Takkouche, B., Regueira-Mendez, C. & Etminan, M. 2008, Breast cancer and use of nonsteroidal anti-inflammatory drugs: a meta-analysis, J Natl Cancer Inst, vol. 100, no. 20, pp. 1439-1447.
Tang, N., Wu, Y., Ma, J., Wang, B. & Yu, R. 2010, Coffee consumption and risk of lung cancer: a meta-analysis, Lung Cancer, vol. 67, no. 1, pp. 17-22.
Tang, N.P., Zhou, B., Wang, B., Yu, R.B. & Ma, J. 2009a, Flavonoids intake and risk of lung cancer: a meta-analysis, Jpn J Clin Oncol, vol. 39, no. 6, pp. 352-359.
Tang, N., Wu, Y., Zhou, B., Wang, B. & Yu, R. 2009b, Green tea, black tea consumption and risk of lung cancer: a meta-analysis, Lung Cancer, vol. 65, no. 3, pp. 274-283.
Tanvetyanon, T [144]. & Bepler, G [145]. 2008, Beta-carotene in multivitamins and the possible risk of lung cancer among smokers versus former smokers: a meta-analysis and evaluation of national brands, Cancer, [146]vol. 113, no. 1, pp. 150-7.
Taylor, V.H., Misra, M. & Mukherjee, S.D. 2009, Is red meat intake a risk factor for breast cancer among premenopausal women?, Breast Cancer Res Treat, vol. 117, no. 1, pp. 1-8.
Teljeur C., O'Dowd T., Thomas S., Kelly A., 2010, The distribution of GPs in Ireland in relation to deprivation, Health Place, vol. 16, no. 6, pp. 1077-83.
Tian, W., Zhao, Y., Liu, S. & Li, X. 2010, Meta-analysis on the relationship between nonsteroidal anti-inflammatory drug use and gastric cancer, Eur J Cancer Prev, vol. 19, no. 4, pp. 288-298.
Turati, F., Galeone, C., La Vecchia, C., Garavello, W. & Tavani, A. 2011, Coffee and cancers of the upper digestive and respiratory tracts: meta-analyses of observational studies, Ann Oncol, vol. 22, no. 3, pp. 536-544.
Turati, F., Garavello, W., Tramacere, I., Bagnardi, V., Rota, M., Scotti, L., Islami, F., Corrao, G., Boffetta, P., La Vecchia, C. & Negri, E. 2010, A meta-analysis of alcohol drinking and oral and pharyngeal cancers. Part 2: results by subsites, Oral Oncol, vol. 46, no. 10, pp. 720-726.
Uehara, Y. & Kiyohara, C. 2010, Alcohol consumption and lung cancer risk among Japanese: a meta-analysis, Fukuoka Igaku Zasshi, vol 101, no. 5, pp. 101-8.
US Department Of Health And Human Services, Public Health Service, National Toxicology Program 2005, Report on carcinogens 11th edition, USA.)
Vajdic, C.M., Falster, M.O., de Sanjose, S., Martinez-Maza, O., Becker, N., Bracci, P.M., Melbye, M., Smedby, K.E., Engels, E.A., Turner, J., Vineis, P., Costantini, A.S., Holly, E.A., Kane, E., Spinelli, J.J., La Vecchia, C., Zheng, T., Chiu, B.C., Dal Maso, L., Cocco, P., Maynadie, M., Foretova, L., Staines, A., Brennan, P., Davis, S., Severson, R., Cerhan, J.R., Breen, E.C., Birmann, B., Cozen, W. & Grulich, A.E. 2009, Atopic disease and risk of non-Hodgkin lymphoma: an InterLymph pooled analysis, Cancer Res, vol. 69, no. 16, pp. 6482-6489.
Van Doorslaer E, Masseria C, Koolman X, for the OECD Health Equity Research Group, 2006, Inequalities in access to medical care by income in developed countries, CMAJ, vol. 174, no. 2, pp. 177-83
Van Maele-Fabry, G., Duhayon, S., Mertens, C. & Lison, D. 2008, Risk of leukaemia among pesticide manufacturing workers: a review and meta-analysis of cohort studies, Environ Res, vol. 106, no. 1, pp. 121-137.
Veronesi, U., Boyle, P., Goldhirsch, A., Orecchia, R. & Viale, G. 2005, Breast cancer, Lancet, vol. 365, no. 9472, pp. 1727-1741.
Villanueva, C.M., Cantor, K.P., Cordier, S., Jaakkola, J.J., King, W.D., Lynch, C.F., Porru, S. & Kogevinas, M. 2004, Disinfection byproducts and bladder cancer: a pooled analysis, Epidemiology, vol. 15, no. 3, pp. 357-367.
Villanueva, C.M., Cantor, K.P., King, W.D., Jaakkola, J.J., Cordier, S., Lynch, C.F., Porru, S. & Kogevinas, M. 2006, Total and specific fluid consumption as determinants of bladder cancer risk, Int J Cancer, vol. 118, no. 8, pp. 2040-2047.
Vrieling, A., Buck, K., Kaaks, R. & Chang-Claude, J. 2010, Adult weight gain in relation to breast cancer risk by estrogen and progesterone receptor status: a meta-analysis, Breast Cancer Res Treat, vol. 123, no. 3, pp. 641-649.
Vrieling, A., Bueno-de-Mesquita, H.B., Boshuizen, H.C., Michaud, D.S., Severinsen, M.T., Overvad, K., Olsen, A., Tjonneland, A., Clavel-Chapelon, F., Boutron-Ruault, M.C., Kaaks, R., Rohrmann, S., Boeing, H., Nothlings, U., Trichopoulou, A., Moutsiou, E., Dilis, V., Palli, D., Krogh, V., Panico, S., Tumino, R., Vineis, P., van Gils, C.H., Peeters, P.H., Lund, E., Gram, I.T., Rodriguez, L., Agudo, A., Larranaga, N., Sanchez, M.J., Navarro, C., Barricarte, A., Manjer, J., Lindkvist, B., Sund, M., Ye, W., Bingham, S., Khaw, K.T., Roddam, A., Key, T., Boffetta, P., Duell, E.J., Jenab, M., Gallo, V. & Riboli, E. 2010, Cigarette smoking, environmental tobacco smoke exposure and pancreatic cancer risk in the European Prospective Investigation into Cancer and Nutrition, Int J Cancer, vol. 126, no. 10, pp. 2394-2403.
Walsh, P., Comber H., Gavin A., 2001, All-Ireland cancer statistics 1994-1996, National Cancer Registry/Northern Ireland Cancer Registry, Cork/Belfast.
Walsh B., Silles, M., O’Neill, C., 2010, Ir Med J, vol. 103, no. 10, pp. 297-300.
Walsh B., Silles, M., O’Neill, C., 2011, Health Econ, Sep 9, [Epub]
Wang, S.S., Slager, S.L., Brennan, P., Holly, E.A., De Sanjose, S., Bernstein, L., Boffetta, P., Cerhan, J.R., Maynadie, M., Spinelli, J.J., Chiu, B.C., Cocco, P.L., Mensah, F., Zhang, Y., Nieters, A., Dal Maso, L., Bracci, P.M., Costantini, A.S., Vineis, P., Severson, R.K., Roman, E., Cozen, W., Weisenburger, D., Davis, S., Franceschi, S., La Vecchia, C., Foretova, L., Becker, N., Staines, A., Vornanen, M., Zheng, T. & Hartge, P. 2007, Family history of hematopoietic malignancies and risk of non-Hodgkin lymphoma (NHL): a pooled analysis of 10 211 cases and 11 905 controls from the International Lymphoma Epidemiology Consortium (InterLymph), Blood, vol. 109, no. 8, pp. 3479-3488.
Whittemore, A.S., Harris, R. & Itnyre, J. 1992, Characteristics relating to ovarian cancer risk: collaborative analysis of 12 US case-control studies. II. Invasive epithelial ovarian cancers in white women. Collaborative Ovarian Cancer Group, Am J Epidemiol, vol. 136, no. 10, pp. 1184-1203.
Wickerham, D.L., Costantino, J.P., Vogel, V.G., Cronin, W.M., Cecchini, R.S., Ford, L.G. & Wolmark, N. 2009, The use of tamoxifen and raloxifene for the prevention of breast cancer, Recent Results Cancer Res, vol. 181, pp. 113-119.
Willett, E.V., Morton, L.M., Hartge, P., Becker, N., Bernstein, L., Boffetta, P., Bracci, P., Cerhan, J., Chiu, B.C., Cocco, P., Dal Maso, L., Davis, S., De Sanjose, S., Smedby, K.E., Ennas, M.G., Foretova, L., Holly, E.A., La Vecchia, C., Matsuo, K., Maynadie, M., Melbye, M., Negri, E., Nieters, A., Severson, R., Slager, S.L., Spinelli, J.J., Staines, A., Talamini, R., Vornanen, M., Weisenburger, D.D., Roman, E. & Interlymph Consortium 2008, Non-Hodgkin lymphoma and obesity: a pooled analysis from the InterLymph Consortium, Int J Cancer, vol. 122, no. 9, pp. 2062-2070.
Winer, R.L. & Koutsky, L.A. 2004, The epidemiology of human papillomavirus infections in Cervical Cancer: from etiology to prevention, eds. T.E. Rohan & K.V. Shah, Kluwer Academic Publishers, The Netherlands, pp. 143-187.
Woods N., Whelton H., Kelleher V., 2009, Factors influencing the need for dental care amongst the elderly in the Republic of Ireland, Community Dent Health, vol. 26, no. 4, pp. 244-9.
World Cancer Research Fund / American Institute for Cancer Research 2007, Food, nutrition, physical activity, and the prevention of cancer: a global perspective, AICR, Washington DC.
World Health Organisation, 1990, International Classification of Diseases for Oncology 2nd edition. Geneva, World Health Organisation.
World Health Organisation, 1997. ICD10 International Classification of Diseases 10th revision. Geneva, World Health Organisation.
World Health Organisation, 2000. International Classification of Diseases for Oncology 3rd edition. Geneva, World Health Organisation.
Xu, X., Dailey, A.B., Peoples-Sheps, M., Talbott, E.O., Li, N. & Roth, J. 2009, Birth weight as a risk factor for breast cancer: a meta-analysis of 18 epidemiological studies, J Womens Health, vol. 18, no. 8, pp. 1169-1178.
Yan, L. & Spitznagel, E.L. 2009, Soy consumption and prostate cancer risk in men: a revisit of a meta-analysis, Am J Clin Nutr, vol. 89, no. 4, pp. 1155-1163.
Yan, L., Spitznagel, E.L. & Bosland, M.C. 2010, Soy consumption and colorectal cancer risk in humans: a meta-analysis, Cancer Epidemiol Biomarkers Prev, vol. 19, no. 1, pp. 148-158.
Yang, P., Zhou, Y., Chen, B., Wan, H.W., Jia, G.Q., Bai, H.L. & Wu, X.T. 2009, Overweight, obesity and gastric cancer risk: results from a meta-analysis of cohort studies, Eur J Cancer, vol. 45, no. 16, pp. 2867-2873.
Yang, P., Zhou, Y., Chen, B., Wan, H.W., Jia, G.Q., Bai, H.L. & Wu, X.T. 2010, Aspirin use and the risk of gastric cancer: a meta-analysis, Dig Dis Sci, vol. 55, no. 6, pp. 1533-1539.
Yang, X.R., Chang-Claude, J., Goode, E.L., Couch, F.J., Nevanlinna, H., Milne, R.L., Gaudet, M., Schmidt, M.K., Broeks, A., Cox, A., Fasching, P.A., Hein, R., Spurdle, A.B., Blows, F., Driver, K., Flesch-Janys, D., Heinz, J., Sinn, P., Vrieling, A., Heikkinen, T., Aittomaki, K., Heikkila, P., Blomqvist, C., Lissowska, J., Peplonska, B., Chanock, S., Figueroa, J., Brinton, L., Hall, P., Czene, K., Humphreys, K., Darabi, H., Liu, J., Van 't Veer, L.J., van Leeuwen, F.E., Andrulis, I.L., Glendon, G., Knight, J.A., Mulligan, A.M., O'Malley, F.P., Weerasooriya, N., John, E.M., Beckmann, M.W., Hartmann, A., Weihbrecht, S.B., Wachter, D.L., Jud, S.M., Loehberg, C.R., Baglietto, L., English, D.R., Giles, G.G., McLean, C.A., Severi, G., Lambrechts, D., Vandorpe, T., Weltens, C., Paridaens, R., Smeets, A., Neven, P., Wildiers, H., Wang, X., Olson, J.E., Cafourek, V., Fredericksen, Z., Kosel, M., Vachon, C., Cramp, H.E., Connley, D., Cross, S.S., Balasubramanian, S.P., Reed, M.W., Dork, T., Bremer, M., Meyer, A., Karstens, J.H., Ay, A., Park-Simon, T.W., Hillemanns, P., Arias Perez, J.I., Menendez Rodriguez, P., Zamora, P., Benitez, J., Ko, Y.D., Fischer, H.P., Hamann, U., Pesch, B., Bruning, T., Justenhoven, C., Brauch, H., Eccles, D.M., Tapper, W.J., Gerty, S.M., Sawyer, E.J., Tomlinson, I.P., Jones, A., Kerin, M., Miller, N., McInerney, N., Anton-Culver, H., Ziogas, A., Shen, C.Y., Hsiung, C.N., Wu, P.E., Yang, S.L., Yu, J.C., Chen, S.T., Hsu, G.C., Haiman, C.A., Henderson, B.E., Le Marchand, L., Kolonel, L.N., Lindblom, A., Margolin, S., Jakubowska, A., Lubinski, J., Huzarski, T., Byrski, T., Gorski, B., Gronwald, J., Hooning, M.J., Hollestelle, A., van den Ouweland, A.M., Jager, A., Kriege, M., Tilanus-Linthorst, M.M., Collee, M., Wang-Gohrke, S., Pylkas, K., Jukkola-Vuorinen, A., Mononen, K., Grip, M., Hirvikoski, P., Winqvist, R., Mannermaa, A., Kosma, V.M., Kauppinen, J., Kataja, V., Auvinen, P., Soini, Y., Sironen, R., Bojesen, S.E., Orsted, D.D., Kaur-Knudsen, D., Flyger, H., Nordestgaard, B.G., Holland, H., Chenevix-Trench, G., Manoukian, S., Barile, M., Radice, P., Hankinson, S.E., Hunter, D.J., Tamimi, R., Sangrajrang, S., Brennan, P., McKay, J., Odefrey, F., Gaborieau, V., Devilee, P., Huijts, P.E., Tollenaar, R.A., Seynaeve, C., Dite, G.S., Apicella, C., Hopper, J.L., Hammet, F., Tsimiklis, H., Smith, L.D., Southey, M.C., Humphreys, M.K., Easton, D., Pharoah, P., Sherman, M.E. & Garcia-Closas, M. 2011, Associations of breast cancer risk factors with tumor subtypes: a pooled analysis from the Breast Cancer Association Consortium studies, J Natl Cancer Inst, vol. 103, no. 3, pp. 250-263.
Yin, L., Grandi, N., Raum, E., Haug, U., Arndt, V. & Brenner, H. 2009, Meta-analysis: longitudinal studies of serum vitamin D and colorectal cancer risk, Aliment Pharmacol Ther, vol. 30, no. 2, pp. 113-125.
Yin, L., Grandi, N., Raum, E., Haug, U., Arndt, V. & Brenner, H. 2010, Meta-analysis: serum vitamin D and breast cancer risk, Eur J Cancer, vol. 46, no. 12, pp. 2196-2205.
Zhan, P., Suo, L.J., Qian, Q., Shen, X.K., Qiu, L.X., Yu, L.K. & Song, Y. 2011, Chlamydia pneumoniae infection and lung cancer risk: a meta-analysis, Eur J Cancer, vol. 47, no. 5, pp. 742-747.
Zhao, Y.S., Wang, F., Chang, D., Han, B. & You, D.Y. 2008, Meta-analysis of different test indicators: Helicobacter pylori infection and the risk of colorectal cancer, Int J Colorectal Dis, vol. 23, no. 9, pp. 875-882.
Zhao, Y.S., Zhu, S., Li, X.W., Wang, F., Hu, F.L., Li, D.D., Zhang, W.C. & Li, X. 2009, Association between NSAIDs use and breast cancer risk: a systematic review and meta-analysis, Breast Cancer Res Treat, vol. 117, no. 1, pp. 141-150.
Zhou, W.B., Xue, D.Q., Liu, X.A., Ding, Q. & Wang, S. 2011, The influence of family history and histological stratification on breast cancer risk in women with benign breast disease: a meta-analysis, J Cancer Res Clin Oncol, vol. 137, no. 7, pp. 1053-1060.
Zhuo, W.L., Zhu, B., Xiang, Z.L., Zhuo, X.L., Cai, L. & Chen, Z.T. 2009, Assessment of the relationship between Helicobacter pylori and lung cancer: a meta-analysis, Arch Med Res, vol. 40, no. 5, pp. 406-410.
Zuccolo, L., Harris, R., Gunnell, D., Oliver, S., Lane, J.A., Davis, M., Donovan, J., Neal, D., Hamdy, F., Beynon, R., Savovic, J. & Martin, R.M. 2008, Height and prostate cancer risk: a large nested case-control study (ProtecT) and meta-analysis, Cancer Epidemiol Biomarkers Prev, vol. 17, no. 9, pp. 2325-2336.
Figure 2.1 Population distribution of NI wards and RoI EDs
Figure 3.1 Age distribution of non-melanoma skin cancer cases in Ireland, 1995-2007, by sex
Figure 3.2 Adjusted relative risks (with 95% confidence intervals) of non-melanoma skin cancer by socio-economic characteristics of geographic area of residence: males
Figure 3.3 Adjusted relative risks (with 95% confidence intervals) of non-melanoma skin cancer by socio-economic characteristics of geographic area of residence: females
Figure 4.1 Age distribution of female breast cancer cases in Ireland, 1995-2007
Figure 4.2 Estimated incidence rate per 100,000 in 2008 for selected developed countries compared to 2005-2007 incidence rate for RoI and NI: female breast cancer
Figure 4.3 Adjusted relative risks (with 95% confidence intervals) of breast cancer by socio-economic characteristics of geographic area of residence: females
Figure 5.1 Age distribution of colorectal cases in Ireland, 1995-2007, by sex
Figure 5.2 Estimated incidence rate per 100,000 in 2008 for selected developed countries compared to 2005-2007 incidence rate for RoI and NI: colorectal cancer
Figure 5.3 Adjusted relative risks (with 95% confidence intervals) of colorectal cancer by socio-economic characteristics of geographic area of residence: males
Figure 5.4 Adjusted relative risks (with 95% confidence intervals) of colorectal cancer by socio-economic characteristics of geographic area of residence: females
Figure 6.1 Age distribution of lung cancer cases in Ireland, 1995-2007, by sex
Figure 6.2 Estimated incidence rate per 100,000 in 2008 for selected developed countries compared to 2005-2007 incidence rate for RoI and NI: lung cancer
Figure 6.3 Adjusted relative risks (with 95% confidence intervals) of lung cancer by socio-economic characteristics of geographic area of residence: males
Figure 6.4 Adjusted relative risks (with 95% confidence intervals) of lung cancer by socio-economic characteristics of geographic area of residence: females
Figure 7.1 Age distribution of prostate cancer cases in Ireland, 1995-2007
Figure 7.2 Estimated incidence rate per 100,000 in 2008 for selected developed countries compared to 2005-2007 incidence rate for RoI and NI: prostate cancer
Figure 7.3 Adjusted relative risks (with 95% confidence intervals) of prostate cancer by socio-economic characteristics of geographic area of residence
Figure 8.1 Age distribution of non-Hodgkin's lymphoma cases in Ireland, 1995-2007, by sex
Figure 8.2 Estimated incidence rate per 100,000 in 2008 for selected developed countries compared to 2005-2007 incidence rate for RoI and NI: non-Hodgkin's lymphoma
Figure 8.3 Adjusted relative risks (with 95% confidence intervals) of non-Hodgkin's lymphoma by socio-economic characteristics of geographic area of residence: males
Figure 8.4 Adjusted relative risks (with 95% confidence intervals) of non-Hodgkin's lymphoma by socio-economic characteristics of geographic area of residence: females
Figure 9.1 Age distribution of stomach cancer cases in Ireland, 1995-2007, by sex
Figure 9.2 Estimated incidence rate per 100,000 in 2008 for selected developed countries compared to 2005-2007 incidence rate for RoI and NI: stomach cancer
Figure 9.3 Adjusted relative risks (with 95% confidence intervals) of stomach cancer by socio-economic characteristics of geographic area of residence: males
Figure 9.4 Adjusted relative risks (with 95% confidence intervals) of stomach cancer by socio-economic characteristics of geographic area of residence: females
Figure 10.1 Age distribution of cases of melanoma of the skin in Ireland, 1995-2007, by sex
Figure 10.2 Estimated incidence rate per 100,000 in 2008 for selected developed countries compared to 2005-2007 incidence rate for RoI and NI: malignant melanoma of skin
Figure 10.3 Adjusted relative risks (with 95% confidence intervals) of melanoma of the skin by socio-economic characteristics of geographic area of residence: males
Figure 10.4 Adjusted relative risks (with 95% confidence intervals) of melanoma of the skin by socio-economic characteristics of geographic area of residence: females
Figure 11.1 Age distribution of bladder cancer cases in Ireland, 1995-2007, by sex
Figure 11.2 Estimated incidence rate per 100,000 in 2008 for selected developed countries compared to 2005-2007 incidence rate for RoI and NI: bladder cancer
Figure 11.3 Adjusted relative risks (with 95% confidence intervals) of bladder cancer by socio-economic characteristics of geographic area of residence: males
Figure 11.4 Adjusted relative risks (with 95% confidence intervals) of bladder cancer by socio-economic characteristics of geographic area of residence: females
Figure 12.1 Age distribution of head and neck cancer cases in Ireland, 1995-2007, by sex
Figure 12.2 Estimated incidence rate per 100,000 in 2008 for selected developed countries compared to 2005-2007 incidence rate for RoI and NI: head and neck cancer
Figure 12.3 Adjusted relative risks (with 95% confidence intervals) of head and neck cancer by socio-economic characteristics of geographic area of residence: males
Figure 12.4 Adjusted relative risks (with 95% confidence intervals) of head and neck cancer by socio-economic characteristics of geographic area of residence: females
Figure 13.1 Age distribution of leukaemia cases in Ireland, 1995-2007, by sex
Figure 13.2 Estimated incidence rate per 100,000 in 2008 for selected developed countries compared to 2005-2007 incidence rate for RoI and NI: leukaemia
Figure 13.3 Adjusted relative risks (with 95% confidence intervals) of leukaemia by socio-economic characteristics of geographic area of residence: males
Figure 13.4 Adjusted relative risks (with 95% confidence intervals) of leukaemia by socio-economic characteristics of geographic area of residence: females
Figure 14.1 Age distribution of pancreatic cancer cases in Ireland, 1995-2007, by sex
Figure 14.2 Estimated incidence rate per 100,000 in 2008 for selected developed countries compared to 2005-2007 incidence rate for RoI and NI: pancreatic cancer
Figure 14.3 Adjusted relative risks (with 95% confidence intervals) of pancreatic cancer by socio-economic characteristics of geographic area of residence: males
Figure 14.4 Adjusted relative risks (with 95% confidence intervals) of pancreatic cancer by socio-economic characteristics of geographic area of residence: females
Figure 15.1 Age distribution of kidney cancer cases in Ireland, 1995-2007, by sex
Figure 15.2 Estimated incidence rate per 100,000 in 2008 for selected developed countries compared to 2005-2007 incidence rate for RoI and NI: kidney cancer
Figure 15.3 Adjusted relative risks (with 95% confidence intervals) of kidney cancer by socio-economic characteristics of geographic area of residence: males
Figure 15.4 Adjusted relative risks (with 95% confidence intervals) of kidney cancer by socio-economic characteristics of geographic area of residence: females
Figure 16.1 Age distribution of oesophageal cancer cases in Ireland, 1995-2007, by sex
Figure 16.2 Estimated incidence rate per 100,000 in 2008 for selected developed countries compared to 2005-2007 incidence rate for RoI and NI: oesophageal cancer
Figure 16.3 Adjusted relative risks (with 95% confidence intervals) of oesophageal cancer by socio-economic characteristics of geographic area of residence: males
Figure 16.4 Adjusted relative risks (with 95% confidence intervals) of oesophageal cancer by socio-economic characteristics of geographic area of residence: females
Figure 17.1 Age distribution of ovarian cancer cases in Ireland, 1995-2007
Figure 17.2 Estimated incidence rate per 100,000 in 2008 for selected developed countries compared to 2005-2007 incid*ence rate for RoI and NI: ovarian cancer
Figure 17.3 Adjusted relative risks (with 95% confidence intervals) of ovarian cancer by socio-economic characteristics of geographic area of residence
Figure 18.1 Age distribution of brain and other central nervous system cancer cases in Ireland, 1995-2007, by sex
Figure 18.2 Estimated incidence rate per 100,000 in 2008 for selected developed countries compared to 2005-2007 incidence rate for RoI and NI: brain and other central nervous system cancers
Figure 18.3 Adjusted relative risks (with 95% confidence intervals) of brain and other central nervous system cancer by socio-economic characteristics of geographic area of residence: males
Figure 18.4 Adjusted relative risks (with 95% confidence intervals) of brain and other central nervous system cancer by socio-economic characteristics of geographic area of residence: females
Figure 19.1 Age distribution of cases of uterine cancer in Ireland, 1995-2007
Figure 19.2 Estimated incidence rate per 100,000 in 2008 for selected developed countries compared to 2005-2007 incidence rate for RoI and NI: uterine cancer
Figure 19.3 Adjusted relative risks (with 95% confidence intervals) of uterine cancer by socio-economic characteristics of geographic area of residence
Figure 20.1 Age distribution of cases of cervical cancer in Ireland, 1995-2007
Figure 20.2: Estimated incidence rate per 100,000 in 2008 for selected developed countries compared to 2005-2007 incidence rate for RoI and NI: cervical cancer
Figure 20.3 Adjusted relative risks (with 95% confidence intervals) of cancer of the cervix uteri by socio-economic characteristics of geographic area of residence
Figure 21.1 Smoking prevalence in Health and Social Services Boards and HSE regions, 2009-2010
Figure 21.2 Percentage of Irish population who were overweight or obese, by area of residence, 2005-2006
Figure 21.3 Trends in female breast cancer incidence for RoI and NI 1994-2009 (European age-standardised incidence rates ± 95% confidence limits)
Map 2.1 Counties and district councils
Map 2.2 Locations
Maps 2.3-2.6 Ward/ED characteristics
Map 2.7 Colorectal cancer, crude standardised incidence ratios: males, 1995-2007
Map 2.8 Colorectal cancer, smoothed relative risks: males, 1995-2007
Map 3.1 Non-melanoma skin cancer, smoothed relative risks: both sexes
Map 3.2 Non melanoma skin cancer, smoothed relative risks: males
Map 3.3 Non melanoma skin cancer, smoothed relative risks: females
Map 4.1 Breast cancer, smoothed relative risks: females 1995-2007
Map 4.2 Breast cancer, smoothed relative risks: females 1995-2001
Map 4.3 Breast cancer, smoothed relative risks: females 2002-2007
Map 5.1 Colorectal cancer, smoothed relative risks: both sexes
Map 5.3 Colorectal cancer, smoothed relative risks: females
Map 6.1 Lung cancer, smoothed relative risks: both sexes
Map 6.2 Lung cancer, smoothed relative risks: males
Map 6.3 Lung cancer smoothed relative risks: females
Map 7.1 Prostate cancer, smoothed relative risks 1995-2007
Map 7.2 Prostate cancer, smoothed relative risks: 1995-2001
Map 7.3 Prostate cancer, smoothed relative risks: 2002-2007
Map 8.1 Non-Hodgkin's lymphoma, smoothed relative risks: both sexes
Map 8.2 Non-Hodgkin's lymphoma, smoothed relative risks: males
Map 8.3 Non-Hodgkin's lymphoma, smoothed relative risks: females
Map 9.1 Stomach cancer, smoothed relative risks: both sexes
Map 9.2 Stomach cancer, smoothed relative risks: males
Map 9.3 Stomach cancer, smoothed relative risks: females
Map 10.1 Melanoma of the skin, smoothed relative risks: both sexes
Map 10.2 Melanoma of the skin, smoothed relative risks: males
Map 10.3 Melanoma of the skin, smoothed relative risks: females
Map 11.1 Bladder cancer, smoothed relative risks: both sexes
Map 11.2 Bladder cancer, smoothed relative risks: males
Map 11.3 Bladder cancer, smoothed relative risks: females
Map 12.1 Head and neck cancer, smoothed relative risks: both sexes
Map 12.2 Head and neck cancer, smoothed relative risks: males
Map 12.3 Head and neck cancer, smoothed relative risks: females
Map 13.1 Leukaemia, smoothed relative risks: both sexes
Map 13.2 Leukaemia, smoothed relative risks: males
Map 13.3 Leukaemia, smoothed relative risks: females
Map 14.1 Pancreatic cancer, smoothed relative risks: both sexes
Map 14.2 Pancreatic cancer, smoothed relative risks: males
Map 14.3 Pancreatic cancer, smoothed relative risks: females
Map 15.1 Kidney cancer, smoothed relative risks: both sexes
Map 15.2 Kidney cancer, smoothed relative risks: males
Map 15.3 Kidney cancer, smoothed relative risks: females
Map 16.1 Oesophageal cancer, smoothed relative risks: both sexes
Map 16.2 Oesophageal cancer, smoothed relative risks: males
Map 16.3 Oesophageal cancer, smoothed relative risks: females
Map 17.1 Ovarian cancer, smoothed relative risks
Map 18.1 Brain and other central nervous system cancer, smoothed relative risks: both sexes
Map 18.2 Brain and other central nervous system cancer, smoothed relative risks: males
Map 18.3 Brain and other central nervous system cancer, smoothed relative risks: females
Map 19.1 Cancer of the corpus uteri, smoothed relative risks
Map 20.1 Cancer of the cervix uteri, smoothed relative risks
Map 21.1 Relative risk of non-melanoma skin cancer (both sexes) and location of larger fishing ports
Map 21.2 Relative risk of non-melanoma skin cancer (both sexes ) and annual sunshine 1961-1990
Map 21.3 Average age of mother at first birth, RoI 1989-1998, NI 1997-1998
Map 21.4 Relative risk of melanoma 1994-2007 and annual sunshine hours 1961-1990
Table 2.1 Incident cancers diagnosed 1995-2007 included in this report: Republic of Ireland (RoI) and Northern Ireland (NI)
Table 2.2 Number and percentage of cases not assigned to an ED or ward, and of cases assigned to multiple EDs
Table 2.3 Population distribution of NI wards and RoI EDs
Table 2.4 Distribution of cancer cases and estimated average population in 1995-2007, and number of EDs and wards, by population density tertiles
Table 2.5 Population and number of areas (wards and EDs) included in each area-based socio-economic category
Table 2.6 Correlation coefficients (Spearman's rank) for ward/ED characteristics
Table 2.7 Mean and variance in the number of cancer cases diagnosed in each ward/ED: 1995-2007
Table 3.1 Summary information for non-melanoma skin cancer in Ireland, 1995-2007
Table 3.2 Risk factors for non-melanoma skin cancer, by direction of association and strength of evidence
Table 4.1 Summary information for breast cancer in Ireland, 1995-2007
Table 4.2 Risk factors for breast cancer, by direction of association and strength of evidence
Table 5.1 Summary information for colorectal cancer in Ireland, 1995-2007
Table 5.2 Risk factors for colorectal cancer, by direction of association and strength of evidence
Table 6.1 Summary information for lung cancer in Ireland, 1995-2007
Table 6.2 Risk factors for lung cancer, by direction of association and strength of evidence
Table 7.1 Summary information for prostate cancer in Ireland, 1995-2007
Table 7.2 Risk factors for prostate cancer, by direction of association and strength of evidence
Table 8.1 Summary information for non-Hodgkin's lymphoma in Ireland, 1995-2007
Table 8.2 Risk factors for non-Hodgkin's lymphoma, by direction of association and strength of evidence
Table 9.1 Summary information for stomach cancer in Ireland, 1995-2007
Table 9.2 Risk factors for stomach cancer, by direction of association and strength of evidence
Table 10.1 Summary information for melanoma of the skin in Ireland, 1995-2007
Table 10.2 Risk factors for melanoma of the skin, by direction of association and strength of evidence
Table 11.1 Summary information for bladder cancer in Ireland, 1995-2007
Table 11.2 Risk factors for bladder cancer, by direction of association and strength of evidence
Table 12.1 Summary information for head and neck cancer in Ireland, 1995-2007
Table 12.2 Risk factors for head and neck cancer, by direction of association and strength of evidence
Table 13.1 Summary information for leukaemia in Ireland, 1995-2007
Table 13.2 Risk factors for leukaemia, by direction of association and strength of evidence
Table 14.1 Summary information for pancreatic cancer in Ireland, 1995-2007
Table 14.2 Risk factors for pancreatic cancer, by direction of association and strength of evidence
Table 15.1 Summary information for kidney cancer in Ireland, 1995-2007
Table 15.2 Risk factors for kidney cancer, by direction of association and strength of evidence
Table 16.1 Summary information for oesophageal cancer in Ireland, 1995-2007
Table 16.2 Risk factors for oesophageal cancer, by direction of association and strength of evidence
Table 17.1 Summary information for ovarian cancer in Ireland, 1995-2007
Table 17.2 Risk factors for ovarian cancer, by direction of association and strength of evidence
Table 18.1 Summary information for brain and other central nervous system cancer in Ireland, 1995-2007
Table 18.2 Risk factors for brain and other central nervous system cancer, by direction of association and strength of evidence
Table 19.1 Summary information for uterine cancer in Ireland, 1995-2007
Table 19.2 Risk factors for uterine cancer, by direction of association and strength of evidence
Table 20.1 Summary information for cervical cancer in Ireland, 1995-2007
Table 20.2 Risk factors for cervical cancer, by direction of association and strength of evidence
Table 21.1 Percentage of male population in Ireland employed in agriculture, forestry and fishing, 1981
Table A2.1 "Confidential" electoral divisions which were merged for census purposes, RoI
Table A2.2 Urban areas with population splits altered between 1996 and 2002 censuses
Table A2.3 Urban areas surrounded by a single ED (rural part)
Table A2.4 Drogheda, Dundalk and Wexford-Population splits not available for 1996 census and altered in 2002
Table A2.5 Islands and headlands joined artificially to mainland EDs or wards
Table A3.1 Summary statistics for each cancer site mapped: numbers of cases per ED or ward, ranges of SIRs and smoothed RRs for 1995-2007
Table A4.1 Regions referred to in the atlas
Links
[1] http://www.geodirectory.ie/
[2] http://www.ilo.org/global/statistics-and-databases/statistics-overview-and-topics/employment-and-unemployment/lang--en/index.htm
[3] http://www.met.ie/climate-ireland/sunshine.asp
[4] http://www.cso.ie/census/
[5] http://www.ncbi.nlm.nih.gov/pubmed?term=%22Clague%20J%22%5BAuthor%5D
[6] http://www.ncbi.nlm.nih.gov/pubmed?term=%22Lin%20J%22%5BAuthor%5D
[7] http://www.ncbi.nlm.nih.gov/pubmed?term=%22Cassidy%20A%22%5BAuthor%5D
[8] http://www.ncbi.nlm.nih.gov/pubmed?term=%22Matin%20S%22%5BAuthor%5D
[9] http://www.ncbi.nlm.nih.gov/pubmed?term=%22Tannir%20NM%22%5BAuthor%5D
[10] http://www.ncbi.nlm.nih.gov/pubmed?term=%22Tamboli%20P%22%5BAuthor%5D
[11] http://www.ncbi.nlm.nih.gov/pubmed?term=%22Wood%20CG%22%5BAuthor%5D
[12] http://www.ncbi.nlm.nih.gov/pubmed?term=%22Wu%20X%22%5BAuthor%5D
[13] http://www.ncbi.nlm.nih.gov/pubmed/19240244
[14] http://www.ncbi.nlm.nih.gov/pubmed?term=%22Corrao%20G%22%5BAuthor%5D
[15] http://www.ncbi.nlm.nih.gov/pubmed?term=%22Scotti%20L%22%5BAuthor%5D
[16] http://www.ncbi.nlm.nih.gov/pubmed?term=%22Bagnardi%20V%22%5BAuthor%5D
[17] http://www.ncbi.nlm.nih.gov/pubmed?term=%22Sega%20R%22%5BAuthor%5D
[18] http://www.ncbi.nlm.nih.gov/pubmed?term=corrao%20%5Bau%5D%20AND%20kidney%20cancer
[19] http://www.dardni.gov.uk/index/fisheries-farming-and-food/marine_fisheries/fisheries-sea-fisheries.htm
[20] http://www.agriculture.gov.ie/fisheries/fisheryharbours/
[21] http://globocan.iarc.fr
[22] http://www.healthlink.ie/Oncology/NCCP%20Prostate%25
[23] http://www.ncbi.nlm.nih.gov/pubmed?term=%22Heck%20JE%22%5BAuthor%5D
[24] http://www.ncbi.nlm.nih.gov/pubmed?term=%22Berthiller%20J%22%5BAuthor%5D
[25] http://www.ncbi.nlm.nih.gov/pubmed?term=%22Vaccarella%20S%22%5BAuthor%5D
[26] http://www.ncbi.nlm.nih.gov/pubmed?term=%22Winn%20DM%22%5BAuthor%5D
[27] http://www.ncbi.nlm.nih.gov/pubmed?term=%22Smith%20EM%22%5BAuthor%5D
[28] http://www.ncbi.nlm.nih.gov/pubmed?term=%22Shan'gina%20O%22%5BAuthor%5D
[29] http://www.ncbi.nlm.nih.gov/pubmed?term=%22Schwartz%20SM%22%5BAuthor%5D
[30] http://www.ncbi.nlm.nih.gov/pubmed?term=%22Purdue%20MP%22%5BAuthor%5D
[31] http://www.ncbi.nlm.nih.gov/pubmed?term=%22Pilarska%20A%22%5BAuthor%5D
[32] http://www.ncbi.nlm.nih.gov/pubmed?term=%22Eluf-Neto%20J%22%5BAuthor%5D
[33] http://www.ncbi.nlm.nih.gov/pubmed?term=%22Menezes%20A%22%5BAuthor%5D
[34] http://www.ncbi.nlm.nih.gov/pubmed?term=%22McClean%20MD%22%5BAuthor%5D
[35] http://www.ncbi.nlm.nih.gov/pubmed?term=%22Matos%20E%22%5BAuthor%5D
[36] http://www.ncbi.nlm.nih.gov/pubmed?term=%22Koifman%20S%22%5BAuthor%5D
[37] http://www.ncbi.nlm.nih.gov/pubmed?term=%22Kelsey%20KT%22%5BAuthor%5D
[38] http://www.ncbi.nlm.nih.gov/pubmed?term=%22Herrero%20R%22%5BAuthor%5D
[39] http://www.ncbi.nlm.nih.gov/pubmed?term=%22Hayes%20RB%22%5BAuthor%5D
[40] http://www.ncbi.nlm.nih.gov/pubmed?term=%22Franceschi%20S%22%5BAuthor%5D
[41] http://www.ncbi.nlm.nih.gov/pubmed?term=%22W%C3%BCnsch-Filho%20V%22%5BAuthor%5D
[42] http://www.ncbi.nlm.nih.gov/pubmed?term=%22Fern%C3%A1ndez%20L%22%5BAuthor%5D
[43] http://www.ncbi.nlm.nih.gov/pubmed?term=%22Daudt%20AW%22%5BAuthor%5D
[44] http://www.ncbi.nlm.nih.gov/pubmed?term=%22Curado%20MP%22%5BAuthor%5D
[45] http://www.ncbi.nlm.nih.gov/pubmed?term=%22Chen%20C%22%5BAuthor%5D
[46] http://www.ncbi.nlm.nih.gov/pubmed?term=%22Castellsagu%C3%A9%20X%22%5BAuthor%5D
[47] http://www.ncbi.nlm.nih.gov/pubmed?term=%22Ferro%20G%22%5BAuthor%5D
[48] http://www.ncbi.nlm.nih.gov/pubmed?term=%22Brennan%20P%22%5BAuthor%5D
[49] http://www.ncbi.nlm.nih.gov/pubmed?term=%22Boffetta%20P%22%5BAuthor%5D
[50] http://www.ncbi.nlm.nih.gov/pubmed?term=%22Hashibe%20M%22%5BAuthor%5D
[51] http://www.ncbi.nlm.nih.gov/pubmed?term=heck%20%5Bau%5D%20AND%20HPV%20AND%20head%20and%20heck
[52] http://www.cancerscreening.hscni.net/breast/
[53] http://www.ncbi.nlm.nih.gov/pubmed?term=%22Hung%20RJ%22%5BAuthor%5D
[54] http://www.ncbi.nlm.nih.gov/pubmed?term=%22Moore%20L%22%5BAuthor%5D
[55] http://www.ncbi.nlm.nih.gov/pubmed?term=%22Feng%20BJ%22%5BAuthor%5D
[56] http://www.ncbi.nlm.nih.gov/pubmed?term=%22Toro%20JR%22%5BAuthor%5D
[57] http://www.ncbi.nlm.nih.gov/pubmed?term=%22Rothman%20N%22%5BAuthor%5D
[58] http://www.ncbi.nlm.nih.gov/pubmed?term=%22Zaridze%20D%22%5BAuthor%5D
[59] http://www.ncbi.nlm.nih.gov/pubmed?term=%22Navratilova%20M%22%5BAuthor%5D
[60] http://www.ncbi.nlm.nih.gov/pubmed?term=%22Bencko%20V%22%5BAuthor%5D
[61] http://www.ncbi.nlm.nih.gov/pubmed?term=%22Janout%20V%22%5BAuthor%5D
[62] http://www.ncbi.nlm.nih.gov/pubmed?term=%22Kollarova%20H%22%5BAuthor%5D
[63] http://www.ncbi.nlm.nih.gov/pubmed?term=%22Szeszenia-Dabrowska%20N%22%5BAuthor%5D
[64] http://www.ncbi.nlm.nih.gov/pubmed?term=%22Mates%20D%22%5BAuthor%5D
[65] http://www.ncbi.nlm.nih.gov/pubmed?term=%22Chow%20WH%22%5BAuthor%5D
[66] http://www.ncbi.nlm.nih.gov/pubmed/17548699
[67] http://www.ncbi.nlm.nih.gov/pubmed?term=%22Ildaphonse%20G%22%5BAuthor%5D
[68] http://www.ncbi.nlm.nih.gov/pubmed?term=%22George%20PS%22%5BAuthor%5D
[69] http://www.ncbi.nlm.nih.gov/pubmed?term=%22Mathew%20A%22%5BAuthor%5D
[70] http://www.ncbi.nlm.nih.gov/pubmed/19537897
[71] http://www.ncbi.nlm.nih.gov/pubmed?term=%22Islami%20F%22%5BAuthor%5D
[72] http://www.ncbi.nlm.nih.gov/pubmed?term=%22Kamangar%20F%22%5BAuthor%5D
[73] http://www.ncbi.nlm.nih.gov/pubmed/19138977
[74] http://www.ncbi.nlm.nih.gov/pubmed?term=%22Jansen-van%20der%20Weide%20MC%22%5BAuthor%5D
[75] http://www.ncbi.nlm.nih.gov/pubmed?term=%22Greuter%20MJ%22%5BAuthor%5D
[76] http://www.ncbi.nlm.nih.gov/pubmed?term=%22Jansen%20L%22%5BAuthor%5D
[77] http://www.ncbi.nlm.nih.gov/pubmed?term=%22Oosterwijk%20JC%22%5BAuthor%5D
[78] http://www.ncbi.nlm.nih.gov/pubmed?term=%22Pijnappel%20RM%22%5BAuthor%5D
[79] http://www.ncbi.nlm.nih.gov/pubmed?term=%22de%20Bock%20GH%22%5BAuthor%5D
[80] http://www.ncbi.nlm.nih.gov/pubmed/20582702
[81] http://www.ncbi.nlm.nih.gov/pubmed?term=%22Kelsh%20MA%22%5BAuthor%5D
[82] http://www.ncbi.nlm.nih.gov/pubmed?term=%22Alexander%20DD%22%5BAuthor%5D
[83] http://www.ncbi.nlm.nih.gov/pubmed?term=%22Mink%20PJ%22%5BAuthor%5D
[84] http://www.ncbi.nlm.nih.gov/pubmed?term=%22Mandel%20JH%22%5BAuthor%5D
[85] http://www.ncbi.nlm.nih.gov/pubmed/20010212
[86] http://www.ncbi.nlm.nih.gov/pubmed?term=%22Lahmann%20PH%22%5BAuthor%5D
[87] http://www.ncbi.nlm.nih.gov/pubmed?term=%22Cust%20AE%22%5BAuthor%5D
[88] http://www.ncbi.nlm.nih.gov/pubmed?term=%22Friedenreich%20CM%22%5BAuthor%5D
[89] http://www.ncbi.nlm.nih.gov/pubmed?term=%22Schulz%20M%22%5BAuthor%5D
[90] http://www.ncbi.nlm.nih.gov/pubmed?term=%22Lukanova%20A%22%5BAuthor%5D
[91] http://www.ncbi.nlm.nih.gov/pubmed?term=%22Kaaks%20R%22%5BAuthor%5D
[92] http://www.ncbi.nlm.nih.gov/pubmed?term=%22Lundin%20E%22%5BAuthor%5D
[93] http://www.ncbi.nlm.nih.gov/pubmed?term=%22Tj%C3%B8nneland%20A%22%5BAuthor%5D
[94] http://www.ncbi.nlm.nih.gov/pubmed?term=%22Halkjaer%20J%22%5BAuthor%5D
[95] http://www.ncbi.nlm.nih.gov/pubmed?term=%22Severinsen%20MT%22%5BAuthor%5D
[96] http://www.ncbi.nlm.nih.gov/pubmed?term=%22Overvad%20K%22%5BAuthor%5D
[97] http://www.ncbi.nlm.nih.gov/pubmed?term=%22Fournier%20A%22%5BAuthor%5D
[98] http://www.ncbi.nlm.nih.gov/pubmed?term=%22Chabbert-Buffet%20N%22%5BAuthor%5D
[99] http://www.ncbi.nlm.nih.gov/pubmed?term=%22Clavel-Chapelon%20F%22%5BAuthor%5D
[100] http://www.ncbi.nlm.nih.gov/pubmed?term=%22Dossus%20L%22%5BAuthor%5D
[101] http://www.ncbi.nlm.nih.gov/pubmed?term=%22Pischon%20T%22%5BAuthor%5D
[102] http://www.ncbi.nlm.nih.gov/pubmed?term=%22Boeing%20H%22%5BAuthor%5D
[103] http://www.ncbi.nlm.nih.gov/pubmed?term=%22Trichopoulou%20A%22%5BAuthor%5D
[104] http://www.ncbi.nlm.nih.gov/pubmed?term=%22Lagiou%20P%22%5BAuthor%5D
[105] http://www.ncbi.nlm.nih.gov/pubmed?term=%22Naska%20A%22%5BAuthor%5D
[106] http://www.ncbi.nlm.nih.gov/pubmed?term=%22Palli%20D%22%5BAuthor%5D
[107] http://www.ncbi.nlm.nih.gov/pubmed?term=%22Grioni%20S%22%5BAuthor%5D
[108] http://www.ncbi.nlm.nih.gov/pubmed?term=%22Mattiello%20A%22%5BAuthor%5D
[109] http://www.ncbi.nlm.nih.gov/pubmed?term=%22Tumino%20R%22%5BAuthor%5D
[110] http://www.ncbi.nlm.nih.gov/pubmed?term=%22Sacerdote%20C%22%5BAuthor%5D
[111] http://www.ncbi.nlm.nih.gov/pubmed?term=%22Redondo%20ML%22%5BAuthor%5D
[112] http://www.ncbi.nlm.nih.gov/pubmed?term=%22Jakszyn%20P%22%5BAuthor%5D
[113] http://www.ncbi.nlm.nih.gov/pubmed?term=%22S%C3%A1nchez%20MJ%22%5BAuthor%5D
[114] http://www.ncbi.nlm.nih.gov/pubmed?term=%22Tormo%20MJ%22%5BAuthor%5D
[115] http://www.ncbi.nlm.nih.gov/pubmed?term=%22Ardanaz%20E%22%5BAuthor%5D
[116] http://www.ncbi.nlm.nih.gov/pubmed?term=%22Arriola%20L%22%5BAuthor%5D
[117] http://www.ncbi.nlm.nih.gov/pubmed?term=%22Manjer%20J%22%5BAuthor%5D
[118] http://www.ncbi.nlm.nih.gov/pubmed?term=%22Jirstr%C3%B6m%20K%22%5BAuthor%5D
[119] http://www.ncbi.nlm.nih.gov/pubmed?term=%22Bueno-de-Mesquita%20HB%22%5BAuthor%5D
[120] http://www.ncbi.nlm.nih.gov/pubmed?term=%22May%20AM%22%5BAuthor%5D
[121] http://www.ncbi.nlm.nih.gov/pubmed?term=%22Peeters%20PH%22%5BAuthor%5D
[122] http://www.ncbi.nlm.nih.gov/pubmed?term=%22Onland-Moret%20NC%22%5BAuthor%5D
[123] http://www.ncbi.nlm.nih.gov/pubmed?term=%22Bingham%20S%22%5BAuthor%5D
[124] http://www.ncbi.nlm.nih.gov/pubmed?term=%22Khaw%20KT%22%5BAuthor%5D
[125] http://www.ncbi.nlm.nih.gov/pubmed?term=%22Allen%20NE%22%5BAuthor%5D
[126] http://www.ncbi.nlm.nih.gov/pubmed?term=%22Spencer%20E%22%5BAuthor%5D
[127] http://www.ncbi.nlm.nih.gov/pubmed?term=%22Rinaldi%20S%22%5BAuthor%5D
[128] http://www.ncbi.nlm.nih.gov/pubmed?term=%22Slimani%20N%22%5BAuthor%5D
[129] http://www.ncbi.nlm.nih.gov/pubmed?term=%22Chajes%20V%22%5BAuthor%5D
[130] http://www.ncbi.nlm.nih.gov/pubmed?term=%22Michaud%20D%22%5BAuthor%5D
[131] http://www.ncbi.nlm.nih.gov/pubmed?term=%22Norat%20T%22%5BAuthor%5D
[132] http://www.ncbi.nlm.nih.gov/pubmed?term=%22Riboli%20E%22%5BAuthor%5D
[133] http://www.ncbi.nlm.nih.gov/pubmed/19821492
[134] http://www.ncbi.nlm.nih.gov/pubmed/19640194
[135] http://www.nisra.gov.uk/Census.html
[136] http://www.nisra.gov.uk
[137] http://www.ninis.nisra.gov.uk/mapxtreme/DataCatalogue.asp?button=Health
[138] http://www.otc.ie/fig.asp?image=2010Charts/Fig2.1.jpg
[139] http://www.ncbi.nlm.nih.gov/pubmed?term=%22Puskin%20JS%22%5BAuthor%5D
[140] http://www.ncbi.nlm.nih.gov/pubmed/12705451
[141] http://www.ncbi.nlm.nih.gov/pubmed?term=%22Quinn%20M%22%5BAuthor%5D
[142] http://www.ncbi.nlm.nih.gov/pubmed?term=%22Babb%20P%22%5BAuthor%5D
[143] http://www.ncbi.nlm.nih.gov/pubmed/12081758
[144] http://www.ncbi.nlm.nih.gov/pubmed?term=%22Tanvetyanon%20T%22%5BAuthor%5D
[145] http://www.ncbi.nlm.nih.gov/pubmed?term=%22Bepler%20G%22%5BAuthor%5D
[146] http://www.ncbi.nlm.nih.gov/pubmed/18429004


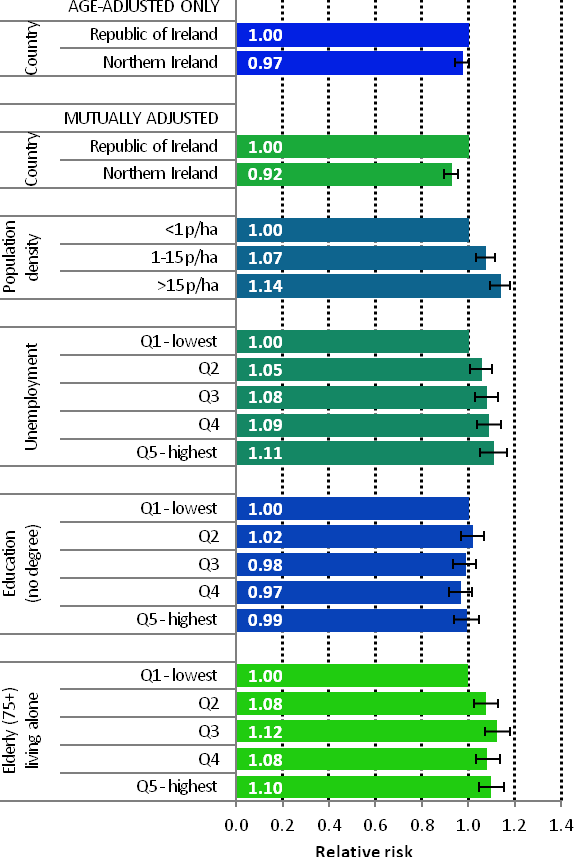
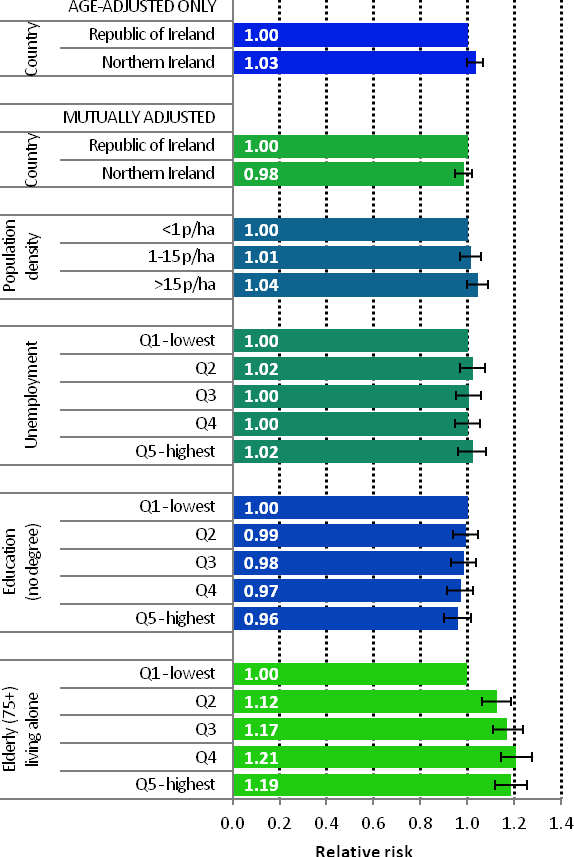
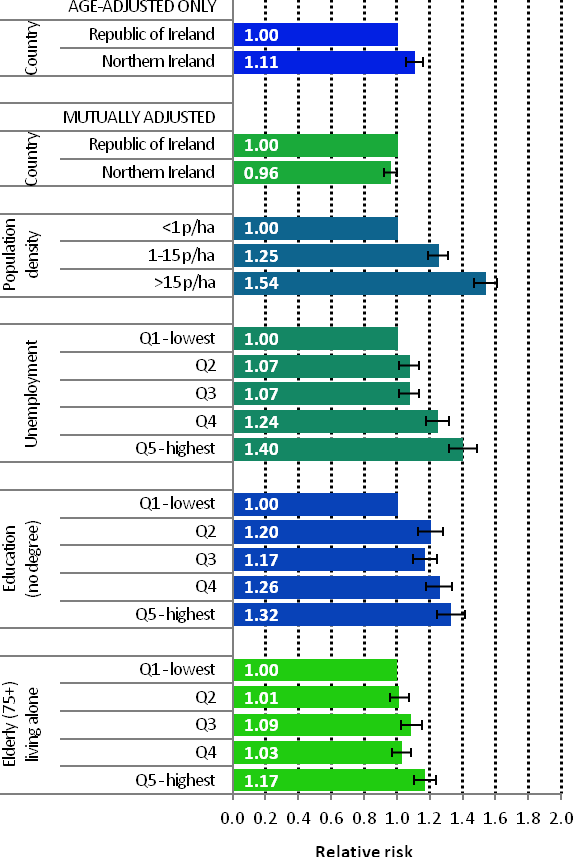
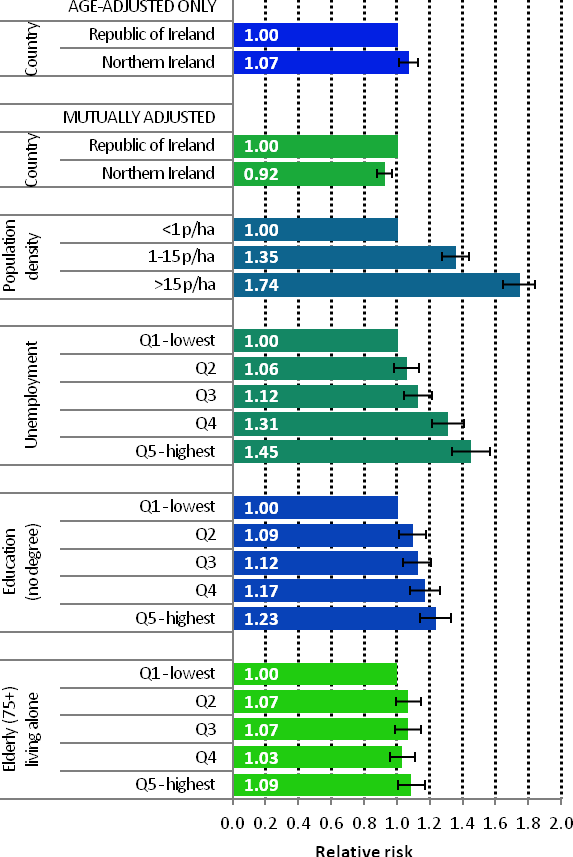

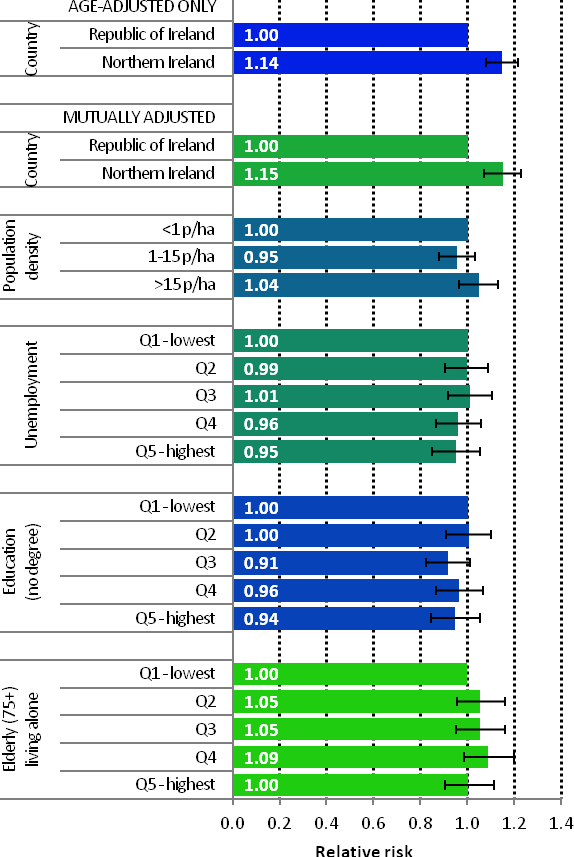
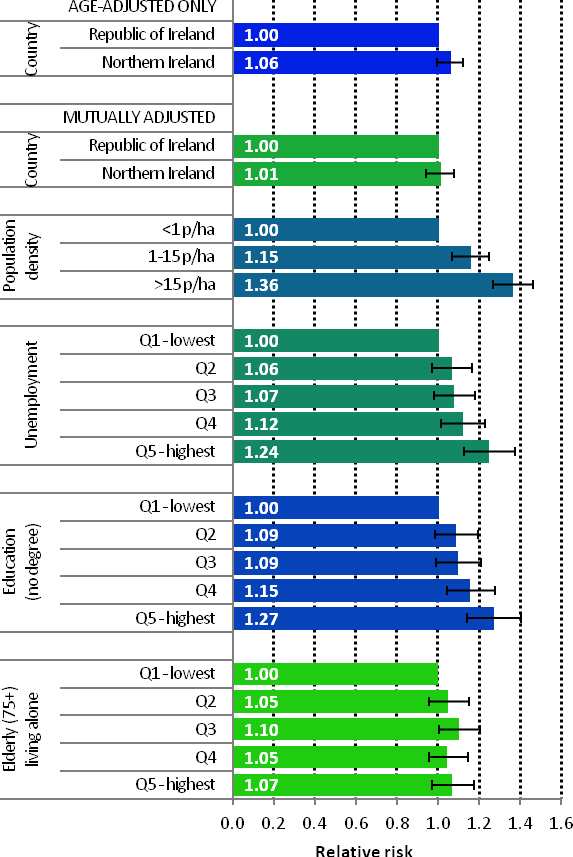
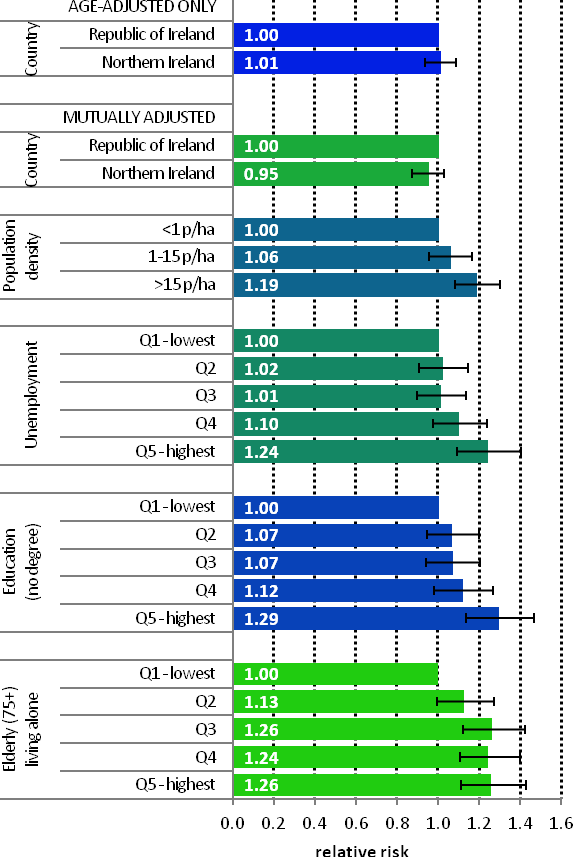
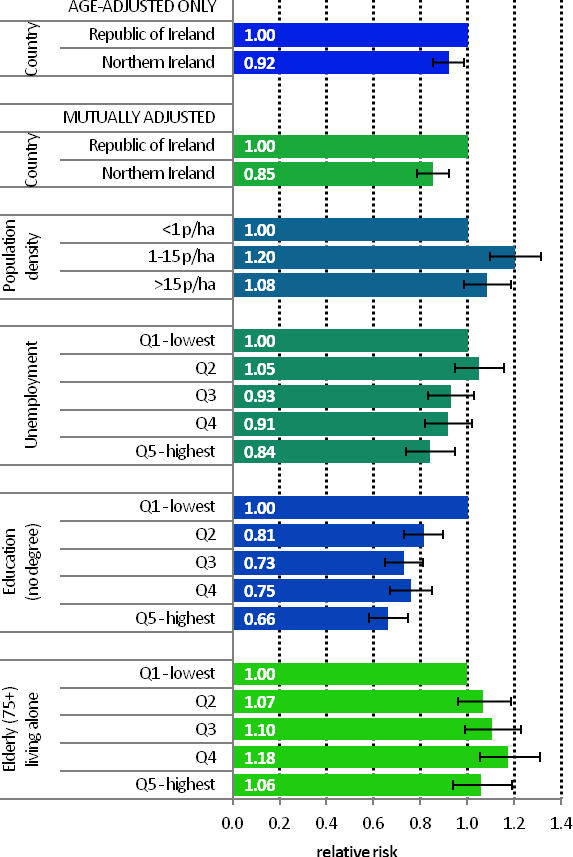
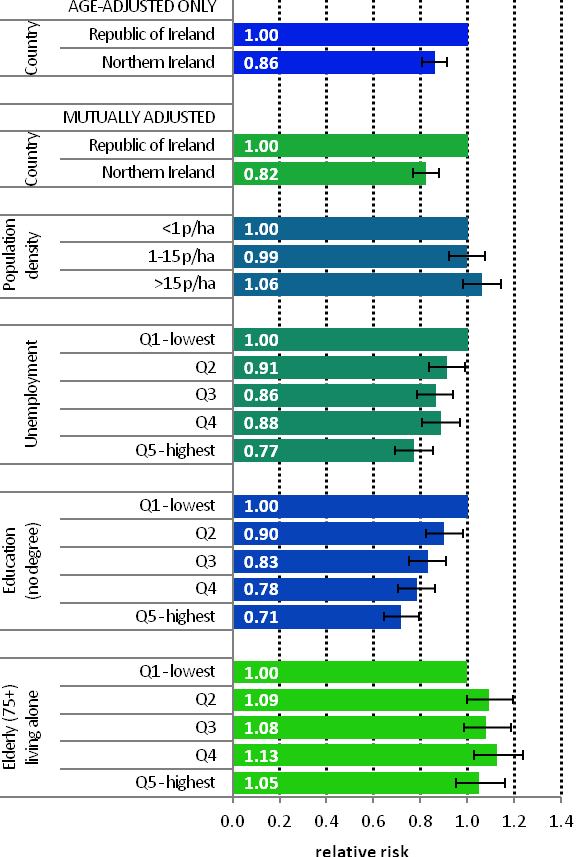
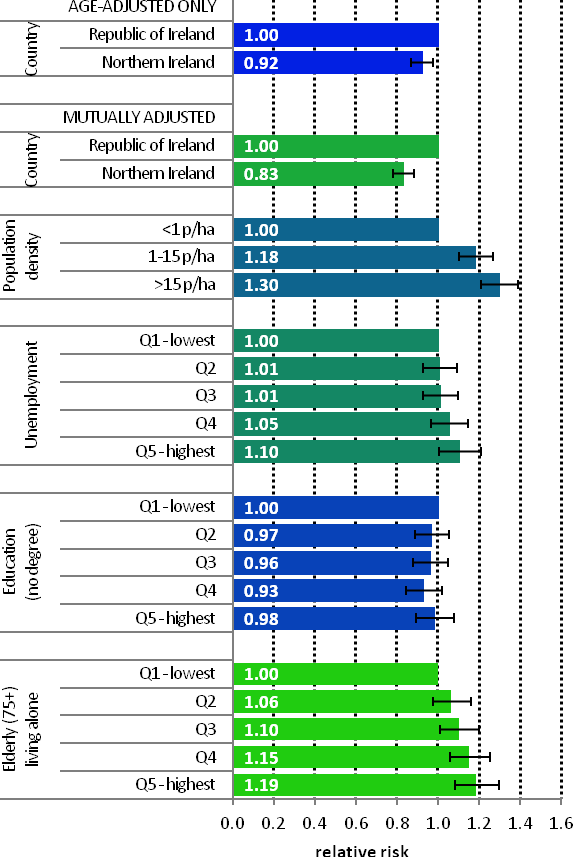
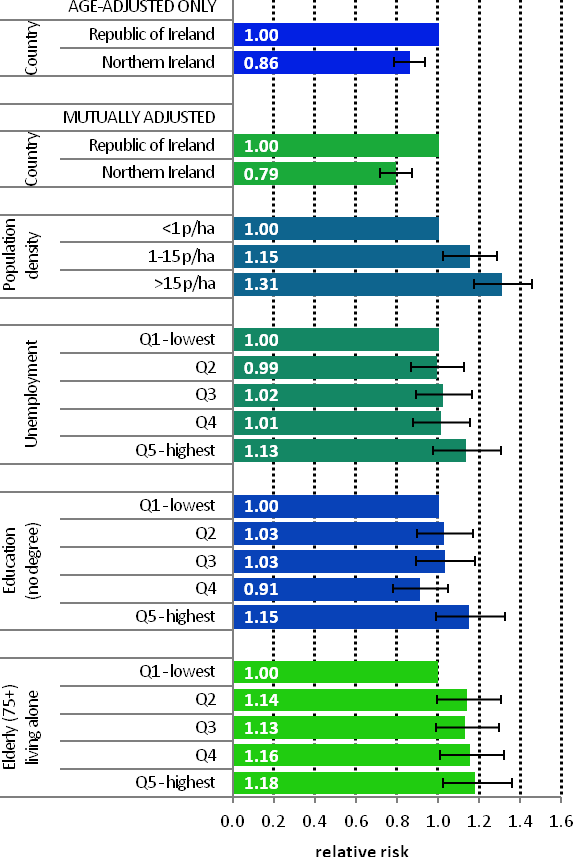
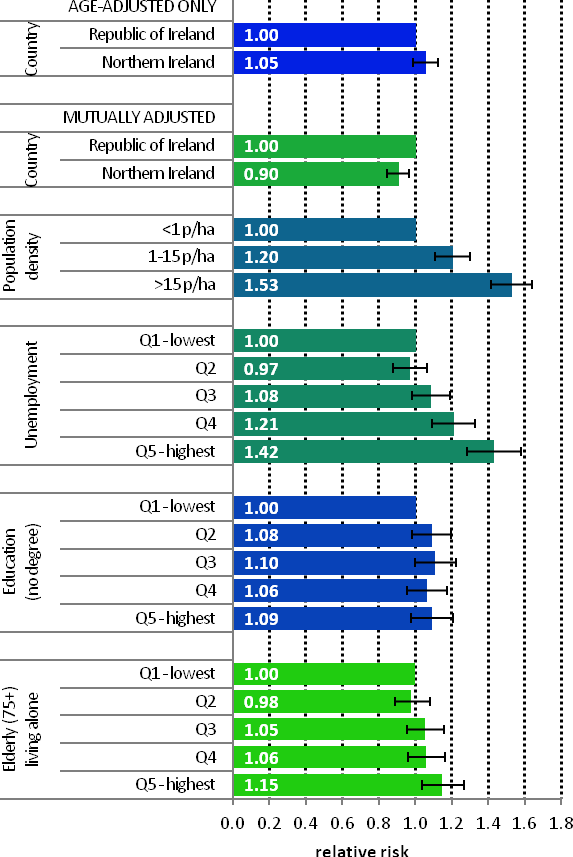
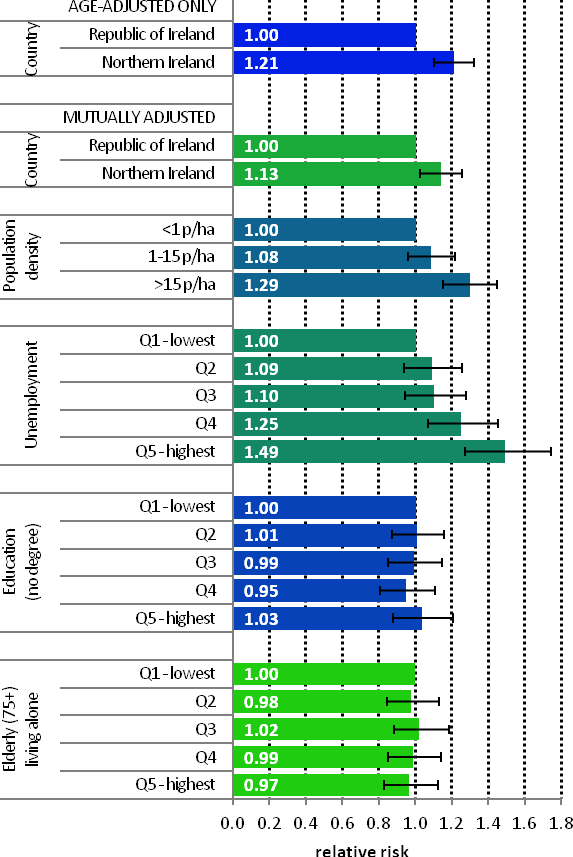

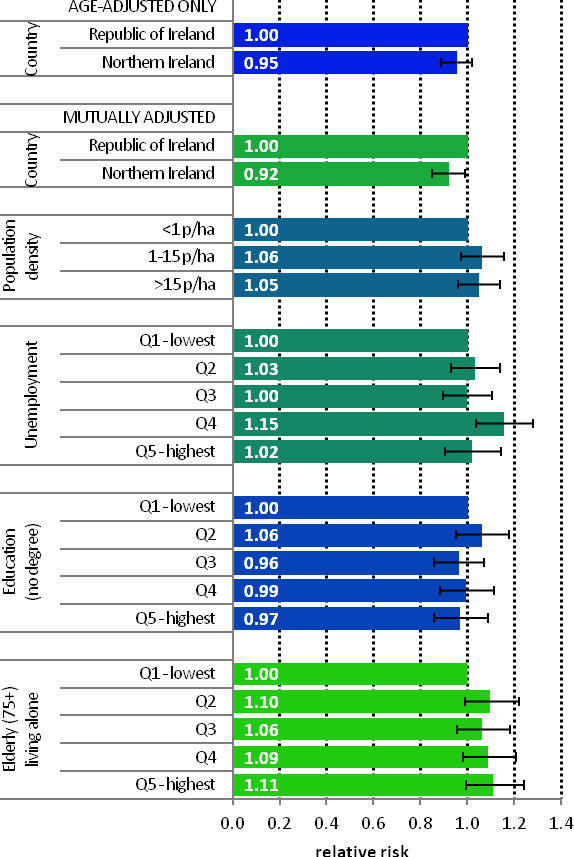
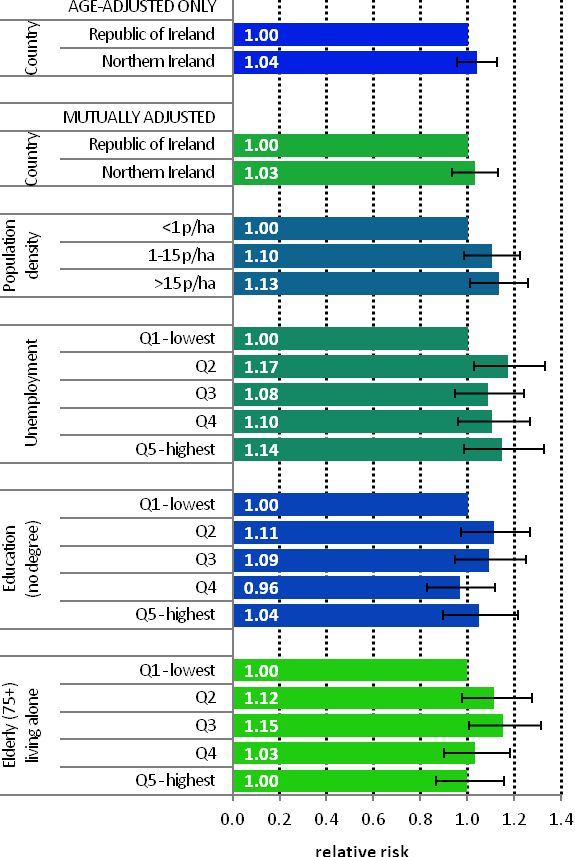
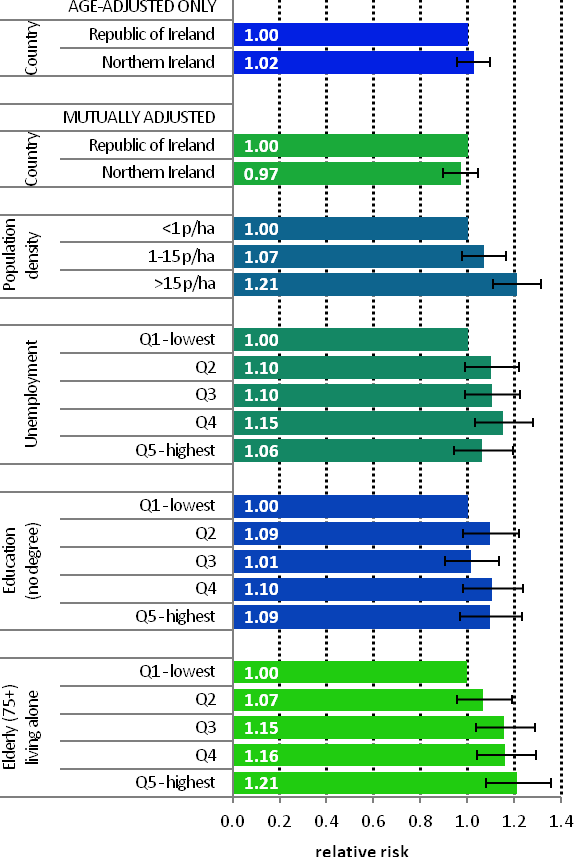
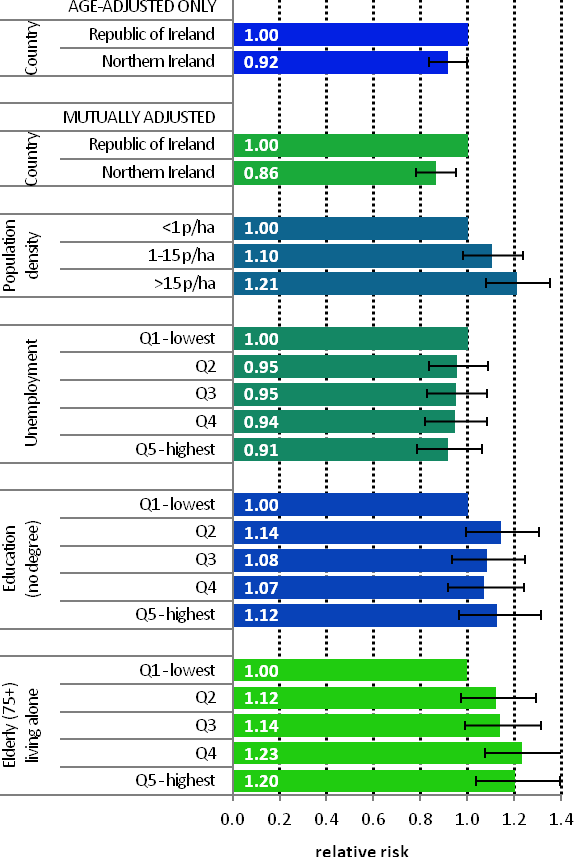
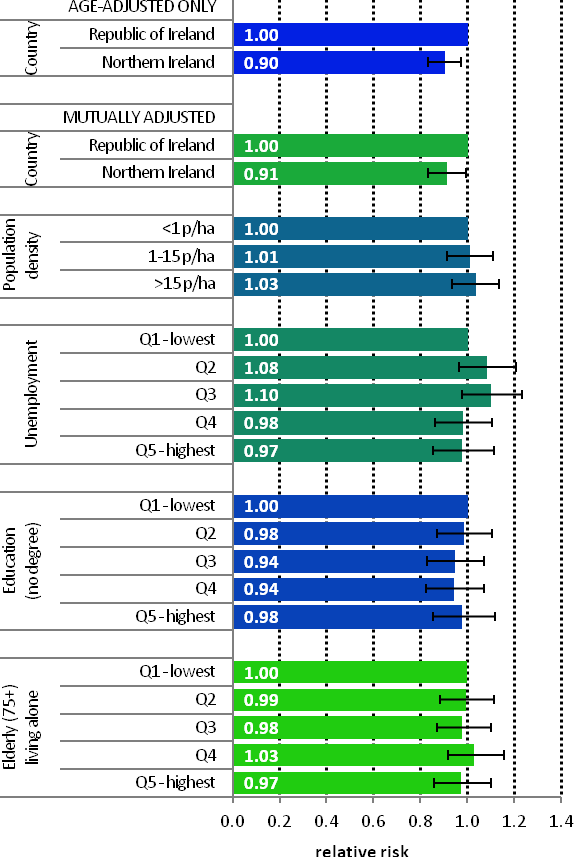
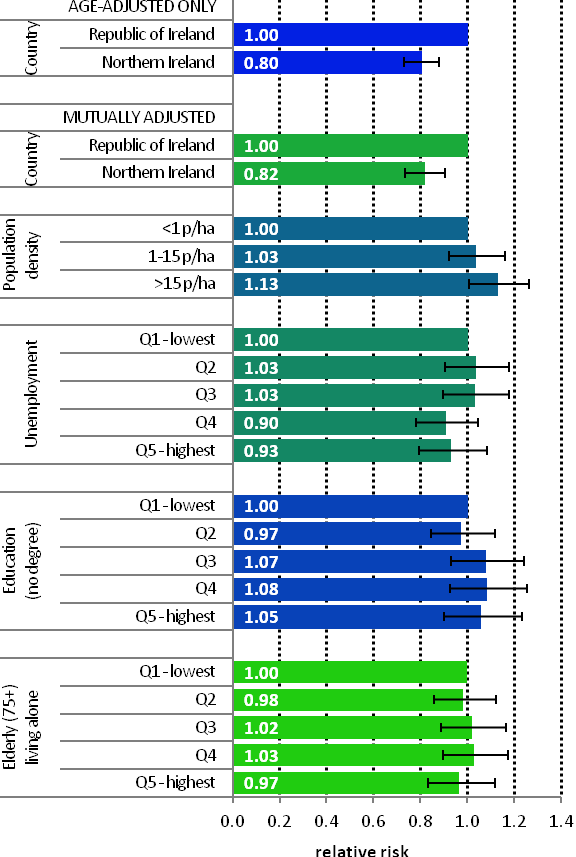