Current Size: 100%


13.5 Mapping and geographical variation
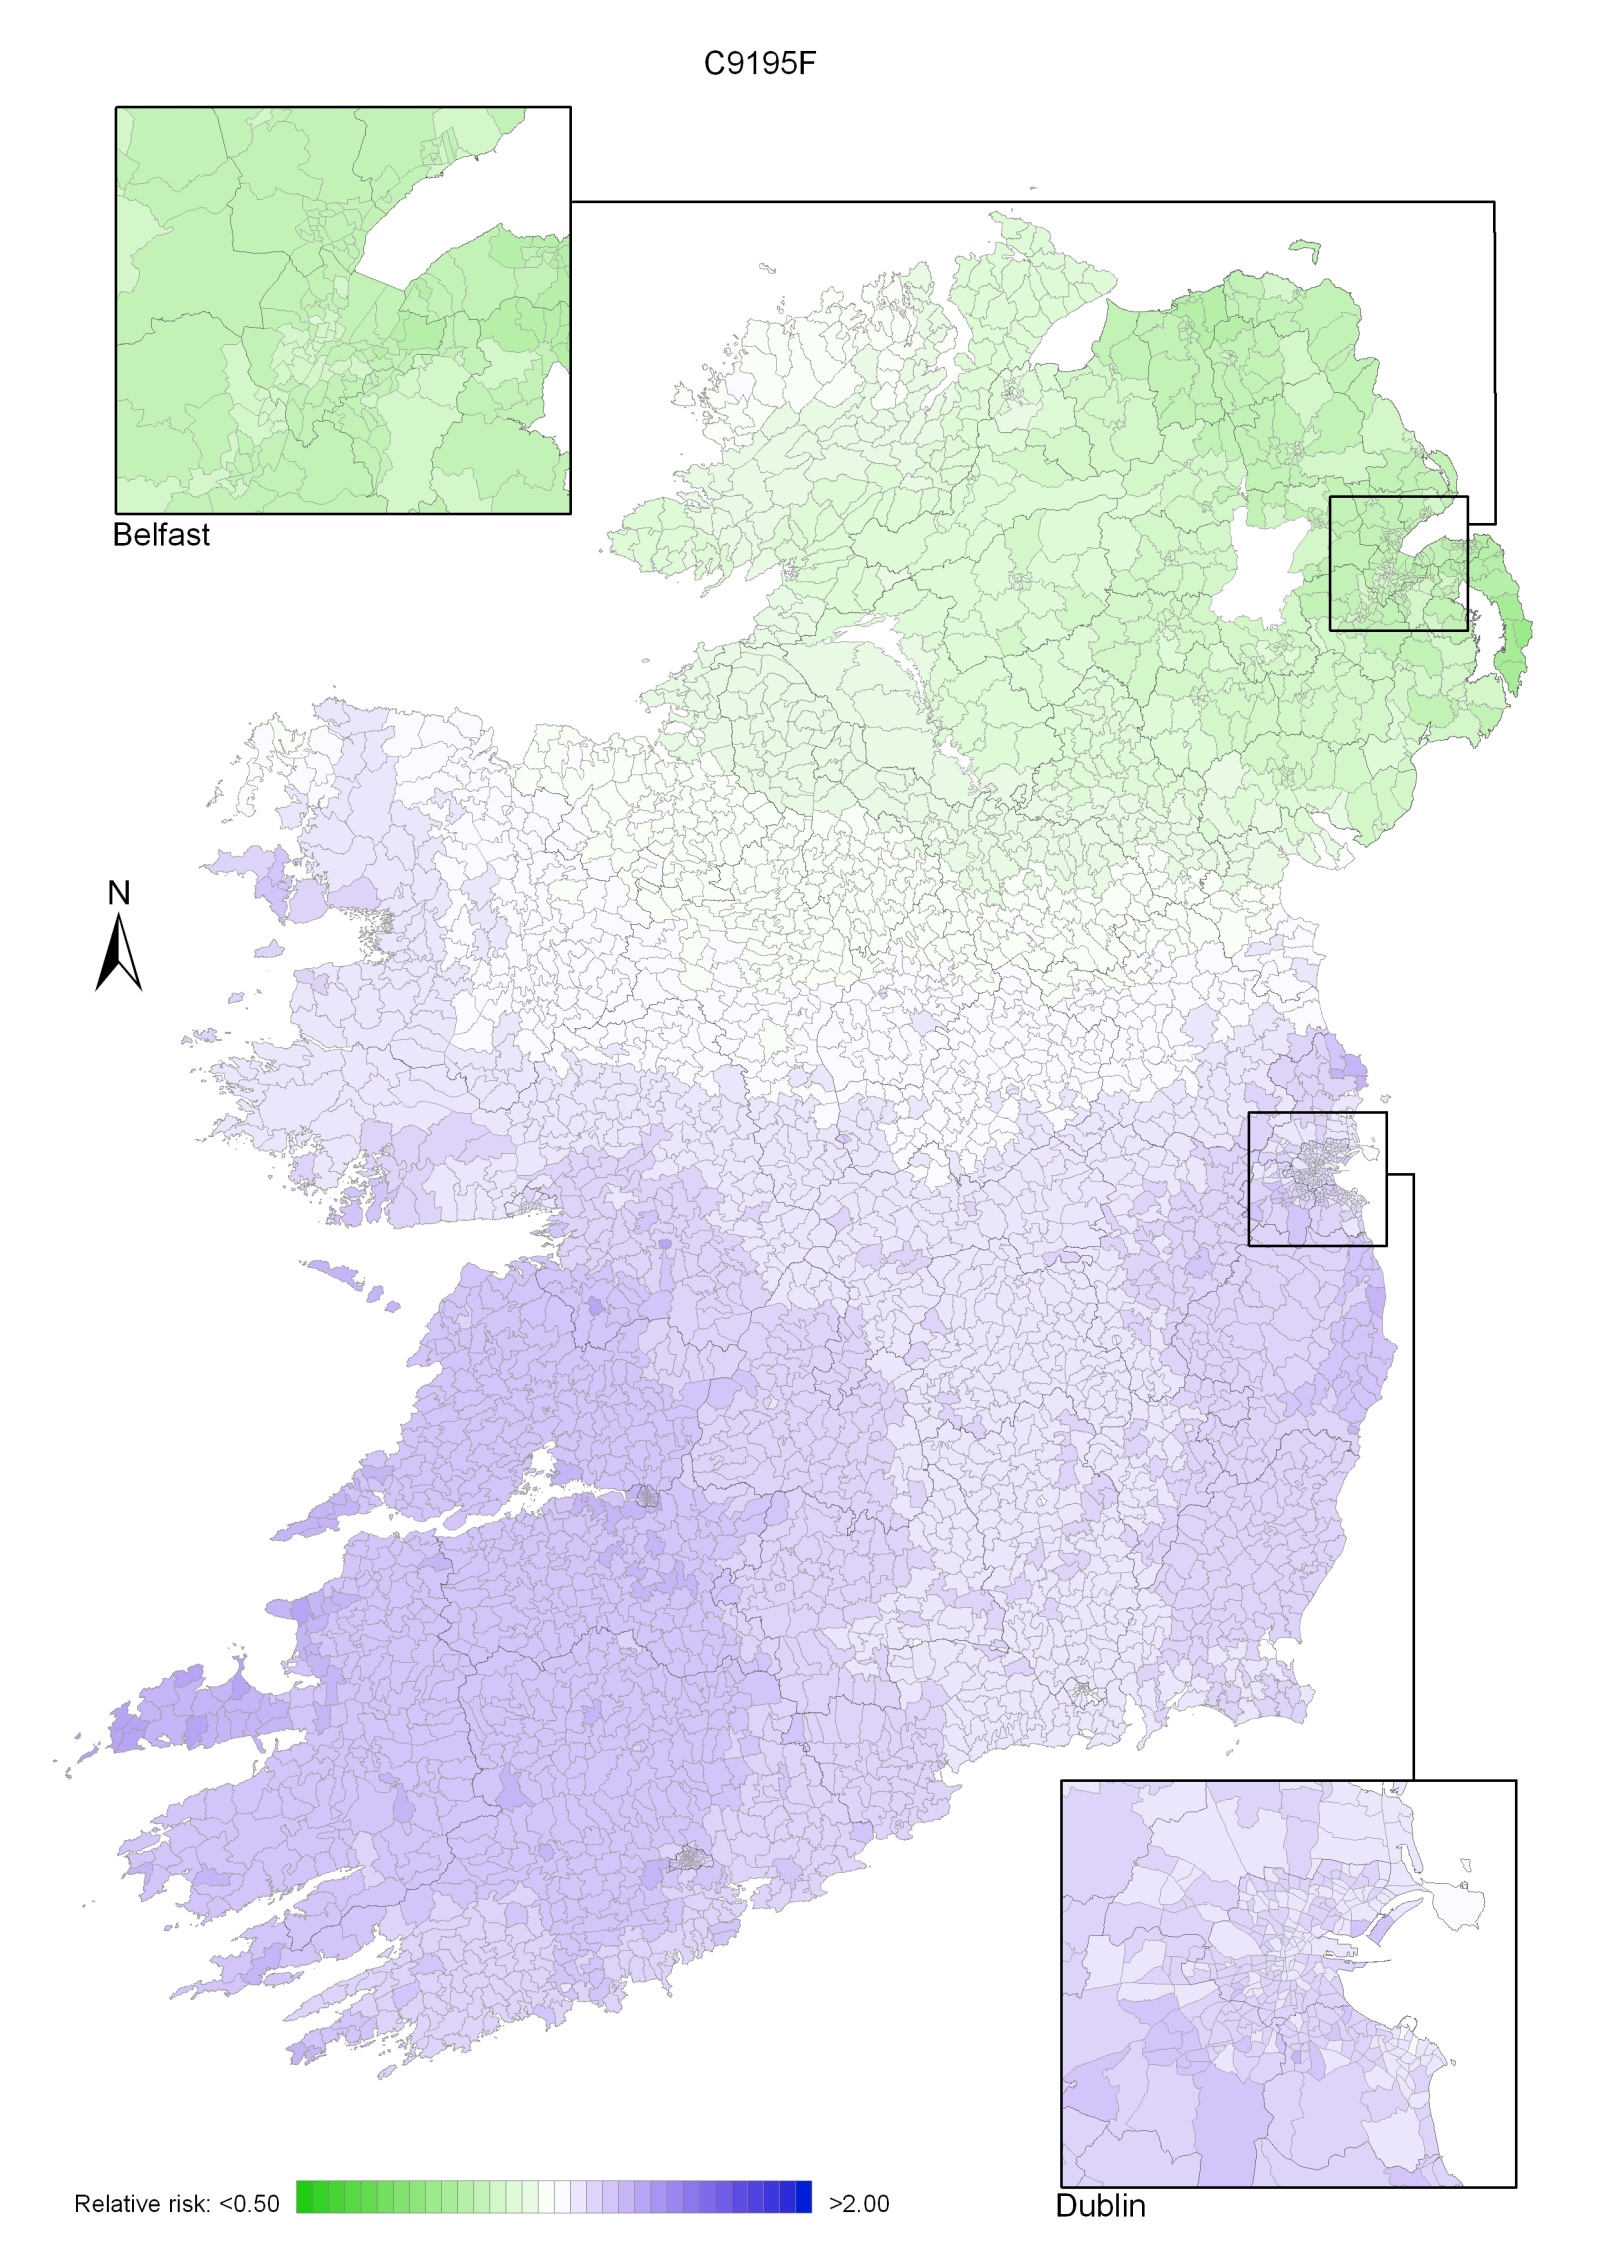
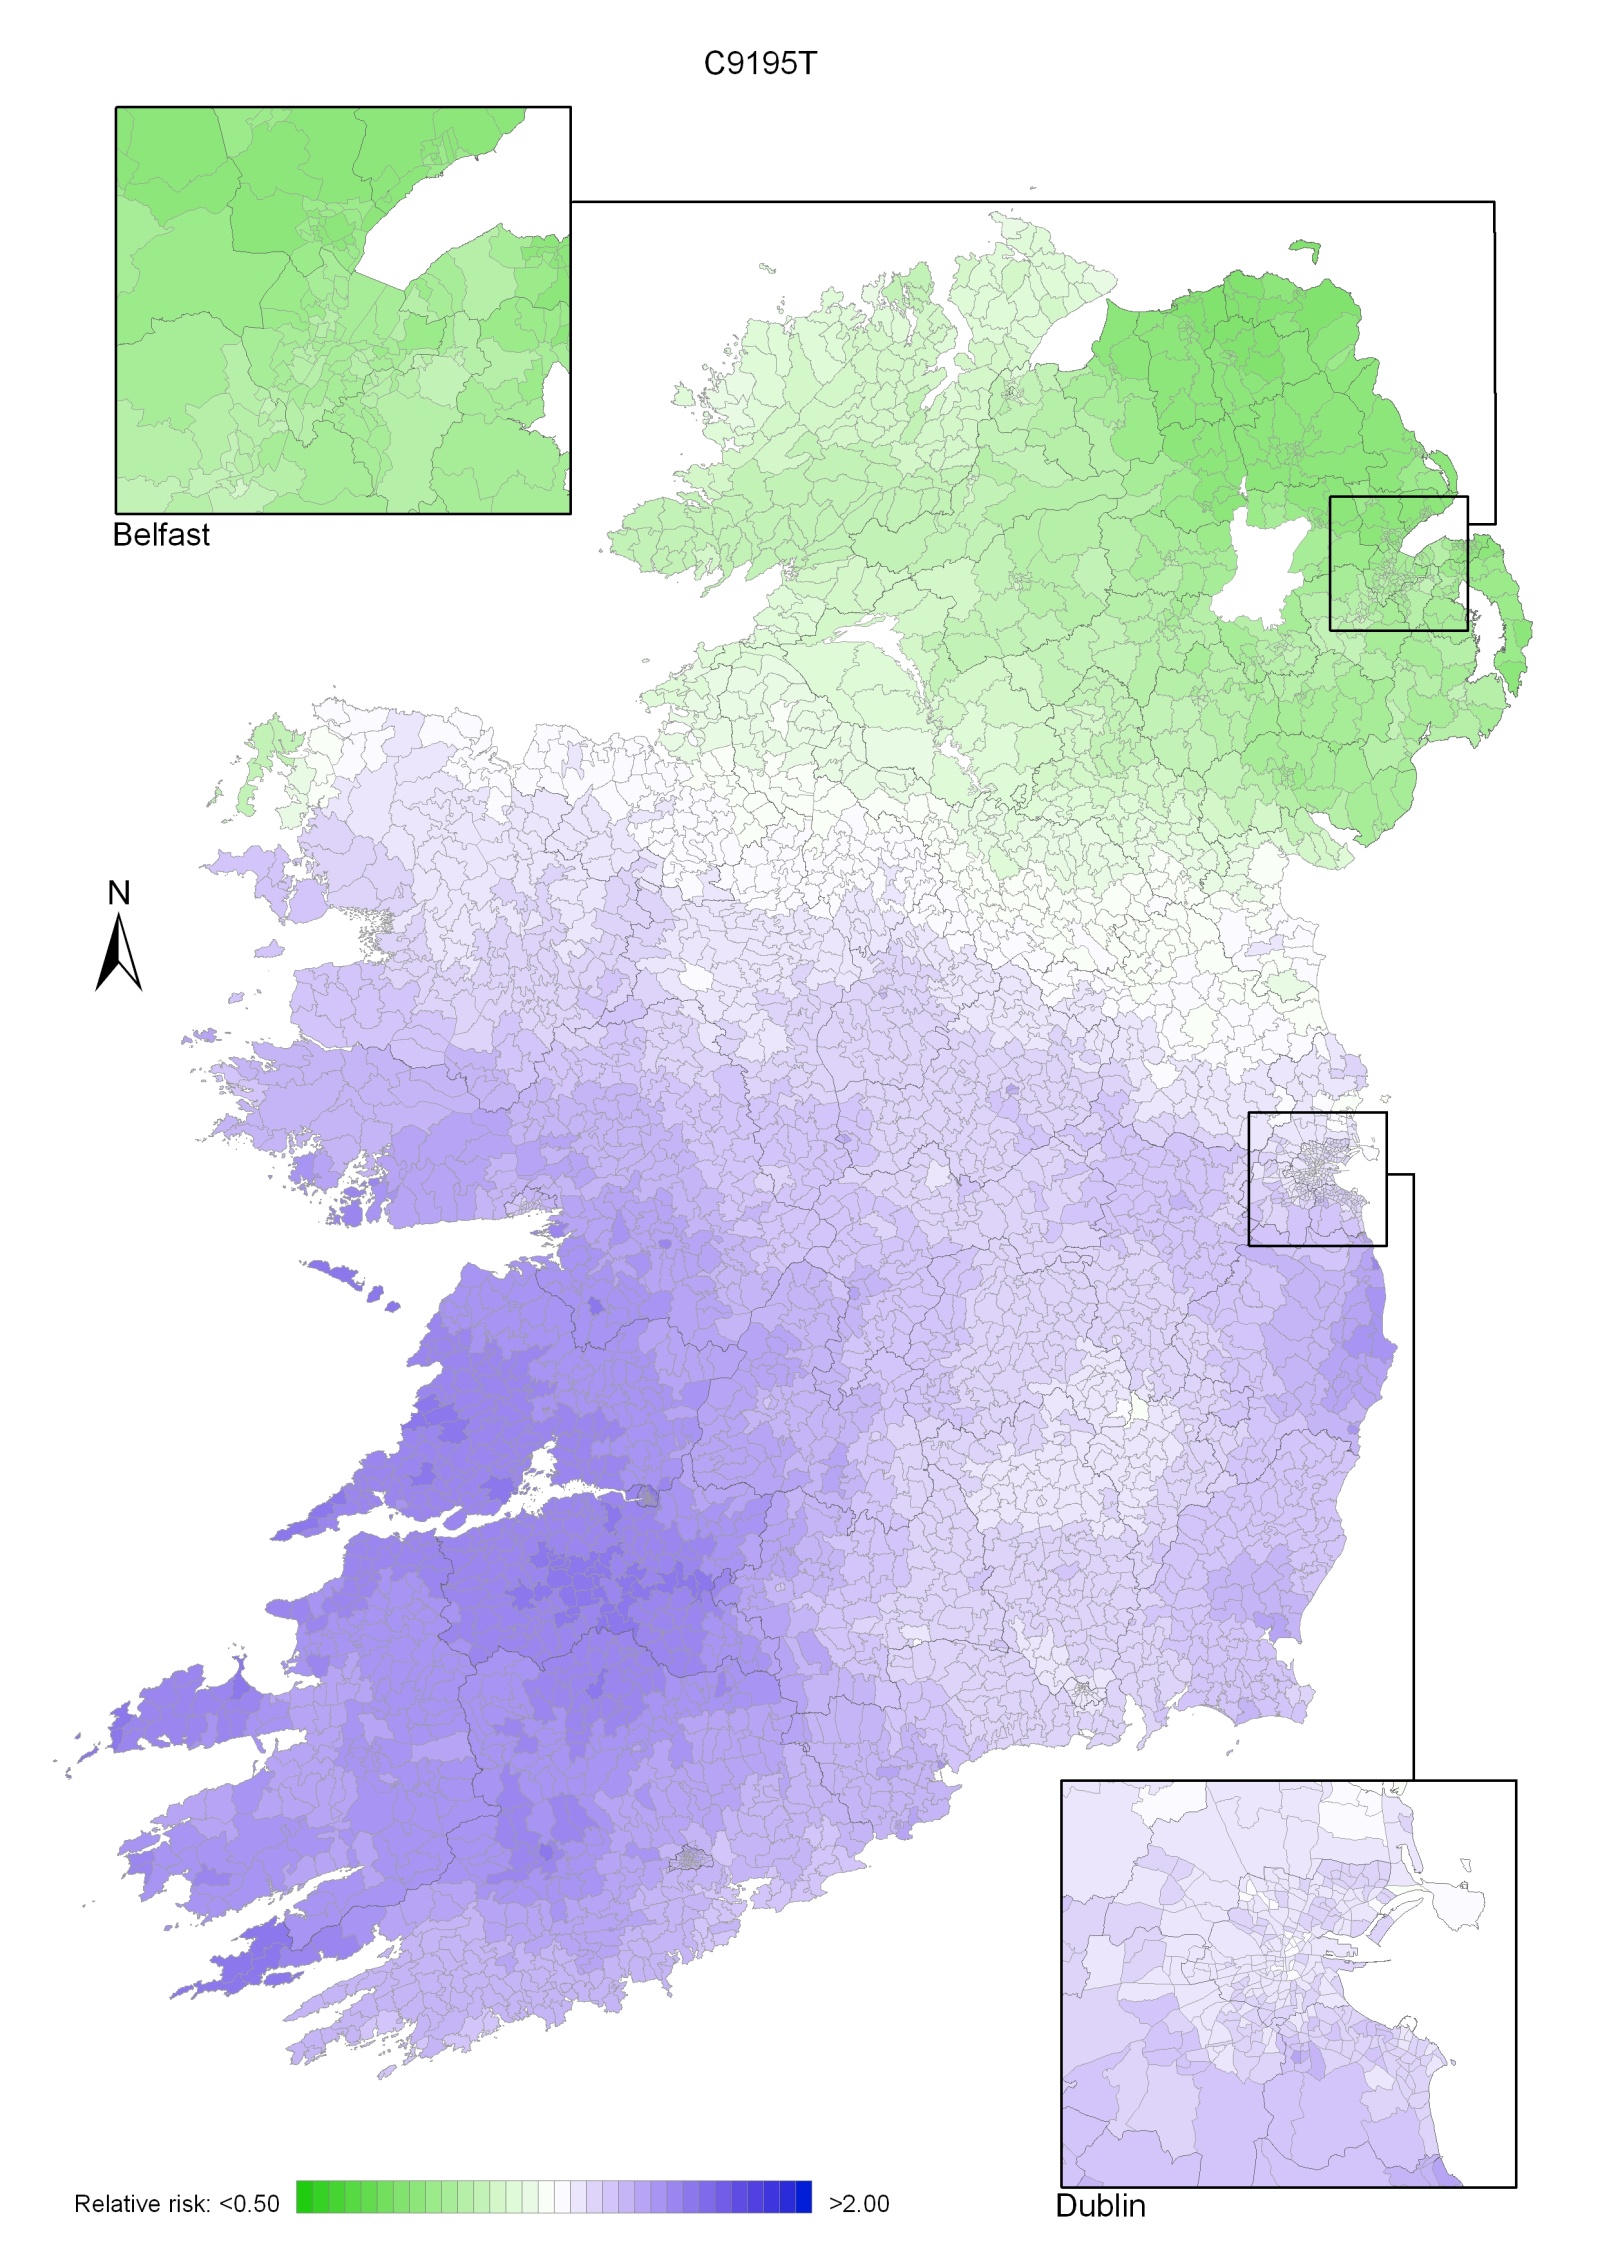
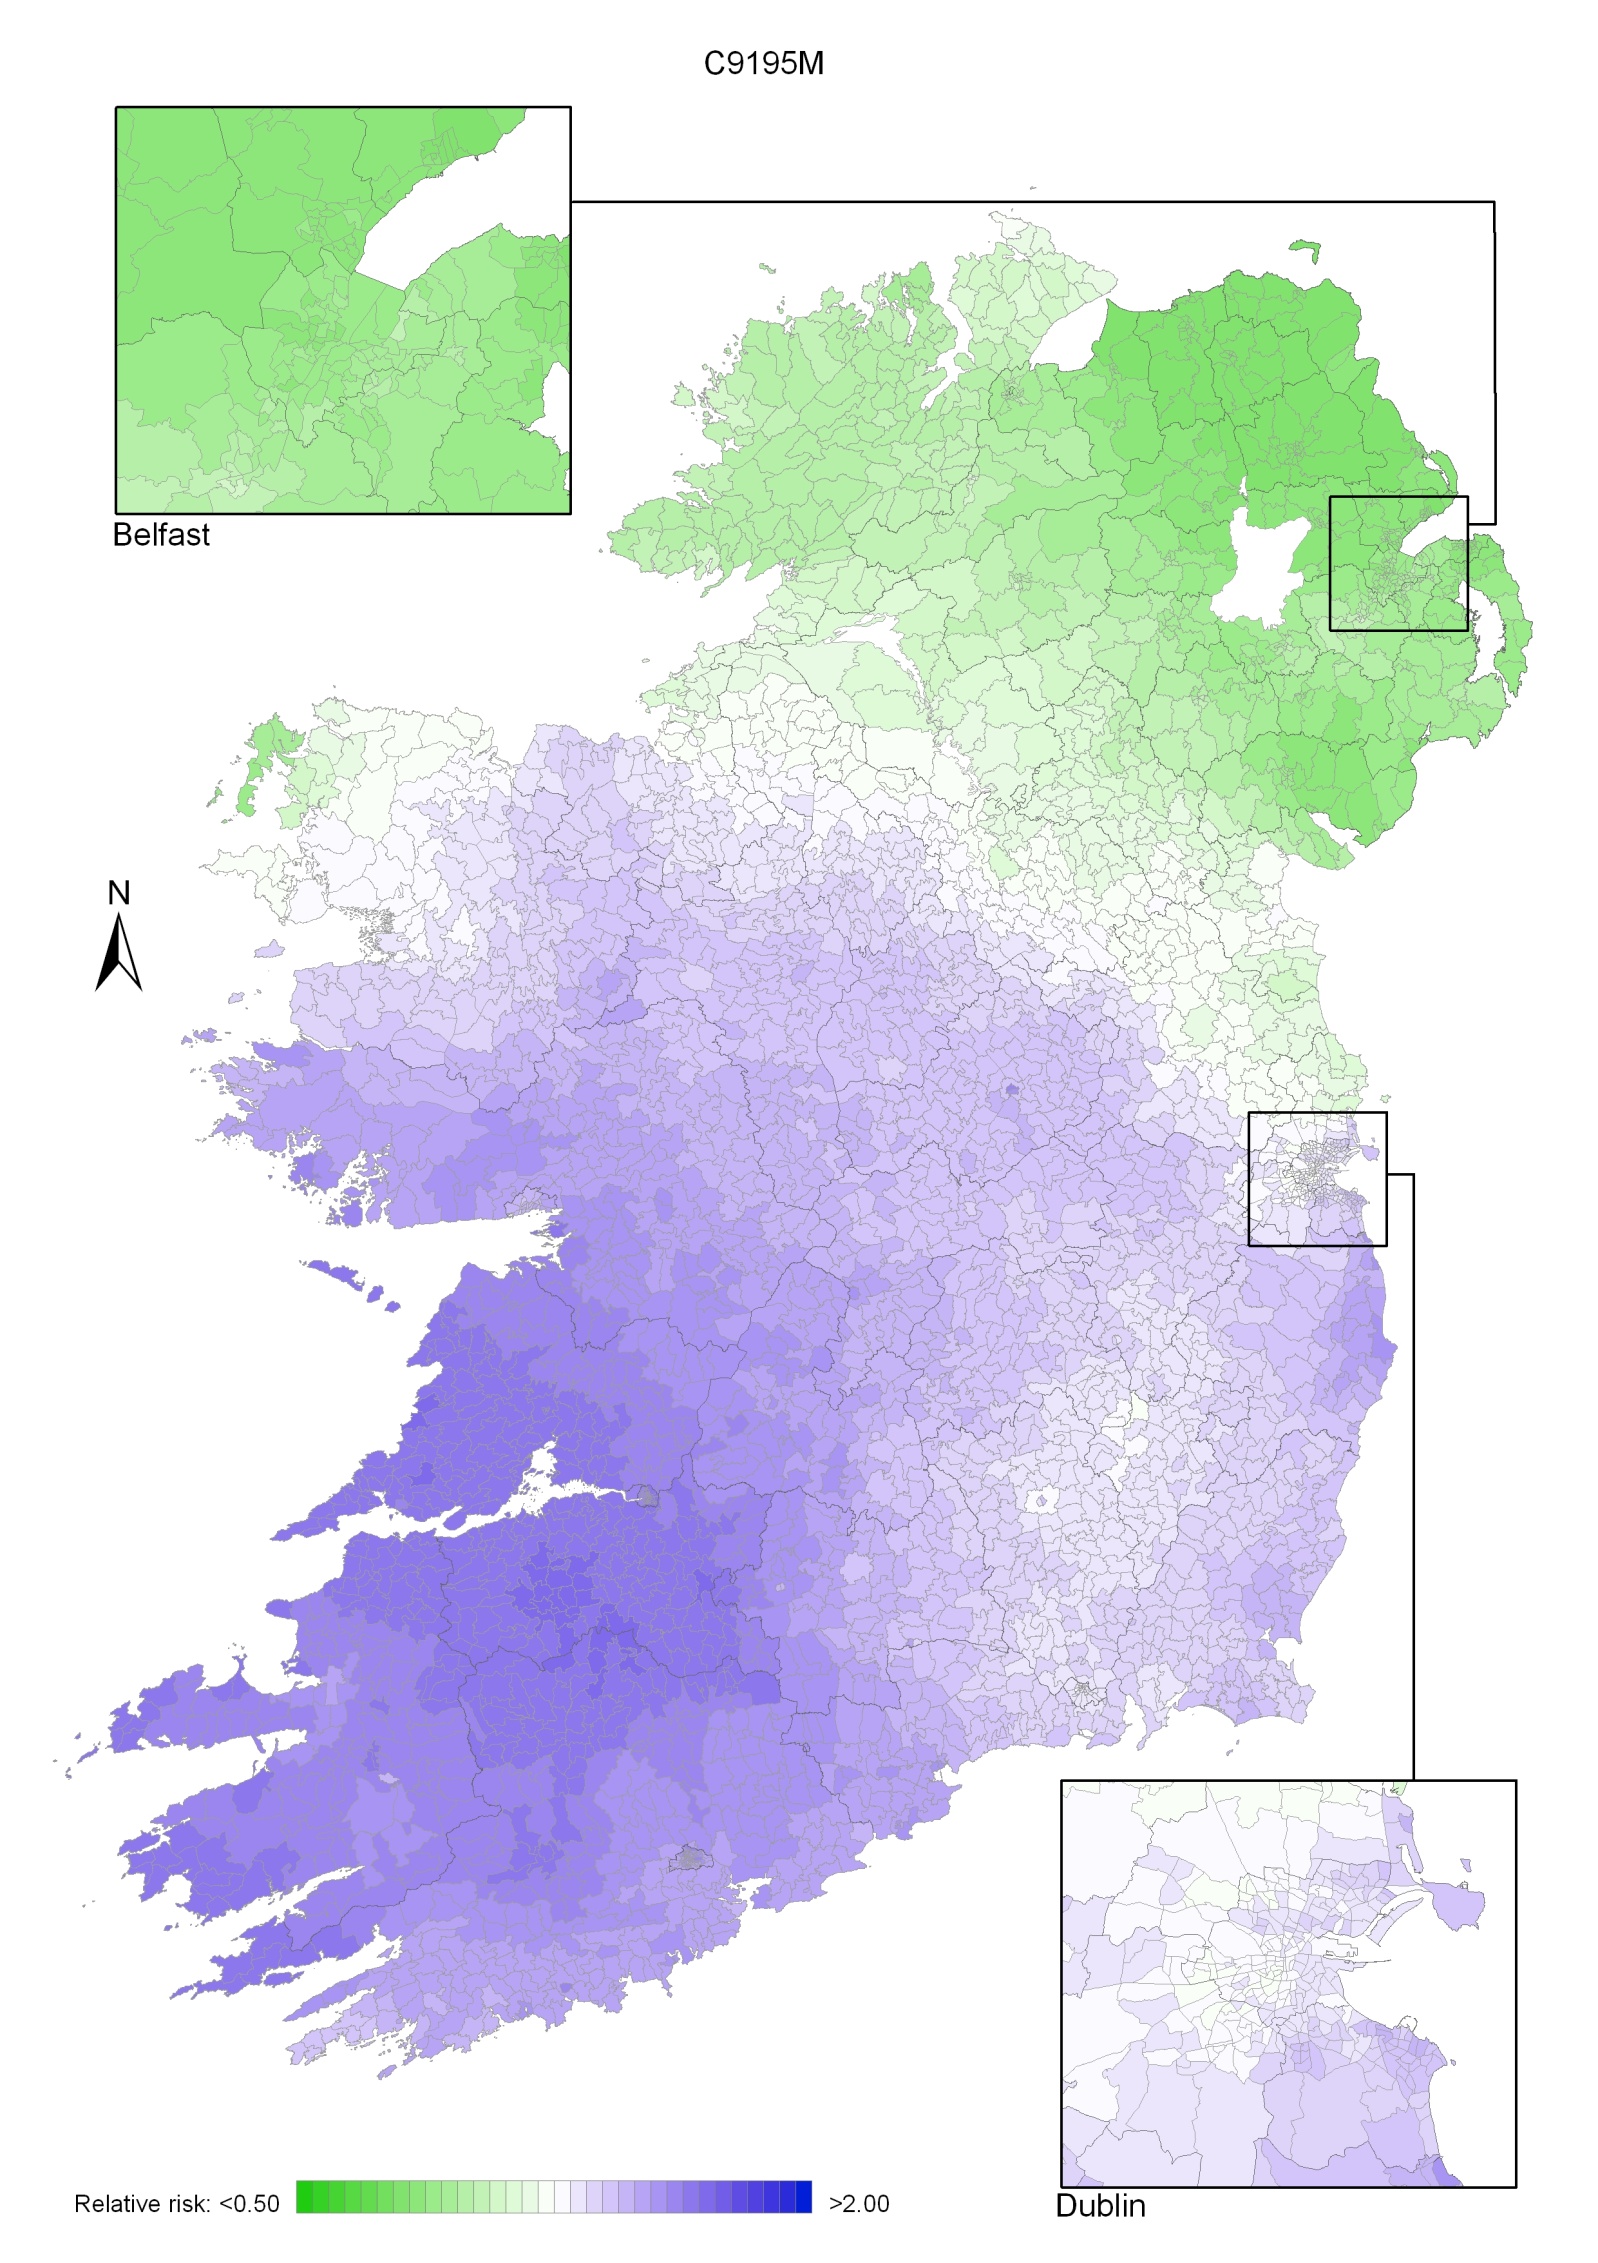
Leukaemia had a very strong geographical pattern of relative risk, which was similar for men and women, although more pronounced in men (Maps 13.1-13.3).
The maps show a gradient of risk across the island, highest in the south-west and reducing uniformly across the country, with the lowest risk in the north-east (Map 13.1).
This pattern was more pronounced for men (Map 13.2) than women (Map 13.3). There was no marked variation in risk within the urban areas, which had similar risks to their surrounding rural areas.
Map 13.1 Leukaemia, smoothed relative risks: both sexes
Map 13.2 Leukaemia, smoothed relative risks: males
Map 13.3 Leukaemia, smoothed relative risks: females