Current Size: 100%


21.1 Potential explanations for geographical variation in cancer incidence
21.1.1 Variation in case definition and ascertainment
The relative risk of developing many of the cancers presented here was higher in RoI than in NI. The risk of non-melanoma skin cancer, melanoma, leukaemia, bladder, pancreas and brain/central nervous system cancer was significantly higher for both sexes in RoI. For men, the risk of prostate cancer was higher in RoI and, for women, cancer of the oesophagus and cervix. In NI, the risk of lung cancer was higher for both sexes as was that of non-Hodgkin’s lymphoma, head and neck cancers and cancer of the corpus uteri for women.
The possibility therefore exists that some of these differences are due to the methods by which cases are registered. The completeness of registration is very high in both registries and differences in case ascertainment are unlikely to contribute substantially to the differences in cancer risk found. The two registries identify and code cancer cases in very similar ways and adhere to the agreed international guidelines on quality assurance in registration. However, the demarcation between frankly malignant, borderline malignant and benign cancers is not always clear. Slight variations in how these cancers are reported by histopathologists, and how these reports are interpreted by registries, may lead to systematic differences in reported incidence rates. In the course of a number of collaborative projects by the two Irish registries (Donnelly et al., 2009, Campo et al., 2004, Walsh et al., 2001) we have identified the situations in which such discrepancies might occur (e.g. for bladder and ovarian cancer) and we are satisfied that there are no significant differences between the registries in registration practices.
21.1.2 Random variation
The element of random variation is important in interpreting geographical variation in cancer risk. By using as long a time period as possible to maximise the number of cases in each small area, and well-developed smoothing methods, we have considerably reduced the contribution of random variation. However, for areas which have very small populations, or are geographically isolated, and for some of the less common cancers, smoothing is less effective and it is likely that some of the small variations in risk shown on the maps are due to random variation in incidence, unrelated to underlying risk.
21.1.3 Genetics
The aetiology of most cancers is a complex interplay between environmental (in the broadest sense) and genetic factors. Genetic factors might be responsible for a little of the geographical variation seen, but genetic variation is an improbable overall explanation for the patterns reported here. There is little evidence for significant heterogeneity (O’Dushlaine et al., 2008) or geographical variation (Hill et al., 2000, Dolan et al., 2005) in the genetic makeup of the Irish population, although Dolan et al (2005) report a small north-east/south-west gradient in polymorphisms of some pathogen-response-associated genes.
21.1.4 Cancer detection rates
Differing levels of cancer detection, case-finding or screening may result in higher disease rates in one area compared with another. For example, asymptomatic prostate cancer cases will be picked up sooner and probably at a higher rate if an area has a higher level of prostate-specific antigen testing. This will result in an apparently higher risk of prostate cancer in the target population. Chronic lymphocytic leukaemia (CLL), a disease of older persons which is usually only identified by a blood test and is frequently asymptomatic, will often be detected only if the person happens to have a blood count. Increased use of CT scans of the abdomen for other illnesses will increase the detection of occult intra-abdominal cancer e.g. kidney cancer. Organised screening, for instance for breast and cervical cancer, will result in an increase in incidence at the beginning of the screening programme, and possibly for longer.
21.1.5 Risks attributable to known aetiological factors
The contribution of lifestyle factors to variation in cancer risk is well known. Tobacco use is the best-established of these; it has a clear geographical pattern of prevalence in Ireland and causes the largest increase in relative risk. In addition, diet, exercise, obesity, sun exposure and alcohol use are known risk factors, the prevalence of which is also known to vary with area of residence. Since we lack detailed information on the spatial distribution of these risk factors in Ireland, in this report we have used area-based measures such as population density, unemployment and level of educational attainment as partial proxies for lifestyle. Where data (however limited) on geographical variation in known risk factors was available we present it below.
Tobacco
Smoking is clearly established as a cause of many cancers (Secretan et al., 2009). The highest smoking prevalence in NI in 2010 (26% for men and 28% for women) was in the Western Health and Social Services Board¶ (HSSB) (Northern Ireland Statistics and Research Agency, 2010b) (Figure 21.1). The lowest smoking prevalence for men (22%) was in the Northern HSSB and for women (19%) in the Southern HSSB.
In RoI in 1998 smoking prevalence was 32% for men and 31% for women. By 2003 these had fallen to 30% and 27% respectively (Office of Tobacco Control, 2010). In RoI, there was a clear geographical pattern in 2003, with overall prevalence in Dublin at 32%, in the rest of Leinster¶ 29%, in Munster 27% and in Connacht 25%. However by 2010, smoking prevalence was highest in the RoI Health Service Executive (HSE) South region¶ (which covers much of Munster) (Figure 21.1) (Office of Tobacco Control, 2010).
| Figure 21.1 Smoking prevalence in Health and Social Services Boards and HSE regions, 2009-2010 |
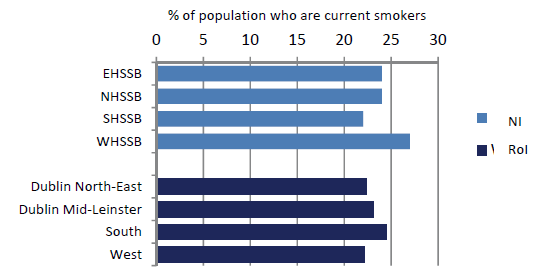 |
Figures refer to the population aged 15 years and over in RoI and 16 years and over in NI. |
While smoking prevalence in 2003 can have no direct bearing on cancer risk in 1995-2007, due to the lag time for development of cancer, these geographical patterns are likely to reflect long-term differentials. Looking at the tobacco-related cancers, the geographical distribution of lung cancer clearly reflects the higher cigarette consumption in the east of RoI, as does that for cervical cancer. Cancers of oesophagus and bladder also have an east-west gradient, but this is less marked, consistent with their more complex aetiology.
Alcohol
Alcohol has been established as a causative factor in breast, colorectal, head and neck, pancreatic and oesophageal cancers (Secretan et al., 2009). In NI, the percentage of drinkers exceeding the “sensible” weekly limits in 2008 was highest in the Eastern HSSB (28%), and lowest in the Southern HSSB (20%) (Department of Health, Social Services and Public Safety, 2008). There was some geographical variation in the prevalence of alcohol consumption in 2007 in RoI (Morgan et al., 2009). The highest prevalence was in Dublin, with 84-85% regular drinkers, followed by Cork and Kerry (76%), with a fairly even prevalence in the rest of the country of 73-74%.
Alcohol-related cancers had a variety of geographical patterns. Colorectal cancer was commonest in the south, and in the east around Dublin and in much of NI for women, breast cancer was most common in the east, pancreatic cancer in the south-west and oesophageal cancer in the east and south. There was no overall geographical pattern for head and neck cancers. The pattern of oesophageal cancer risk was closest to that of higher alcohol consumption, but, as with tobacco, it cannot be assumed that current consumption patterns reflect of those two decades ago.
Obesity
Obesity has been shown to be a risk factor for breast, colorectal, pancreas, kidney, oesophagus, and corpus uteri cancers, and may be a risk factor for NHL, melanoma, leukaemia and cancers of prostate and ovary (World Cancer Research Fund/American Institute for Cancer Research, 2007).
In 2005-2006 levels of obesity (measured, not self-reported) were higher overall in RoI than in NI (Figure 21.2) and, within RoI, in the west and south-west (Morgan et al., 2009). In NI the prevalence of obesity was highest in the Southern HSSB (Northern Ireland Statistics and Research Agency, 2010b). The lowest levels of obesity were in urban areas—Dublin in RoI and the Eastern HSSB (which includes Belfast) in NI, and in the Mid-West region in RoI.
| Figure 21.2 Percentage of Irish population who were overweight or obese, by area of residence, 2005-2006 |
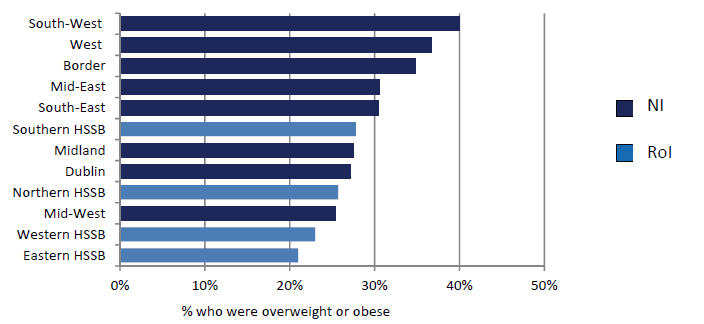 |
Note: The regions shown for NI are Health and Social Services boards and for RoI the NUTS level 3 regions (see Appendix table A4.1). |
Infection
The two main infective causes of cancer in the Irish population are Helicobacter pylori, which causes stomach cancer and human papilloma virus (HPV), which causes cervical cancer, some head and neck cancers and non-melanoma skin cancers.
The reported prevalence of H pylori in a random sample of 1000 blood donors in RoI in 1998 was reported as 43%, and 62% in those aged 46-60 (Buckley et al., 1998). 504 individuals aged 35 to 74 sampled in Cork and Kerry in 1997/1998 had a prevalence of 61% (Sheehan et al., 2005a) and in a sample from a population study of cardiovascular risk in NI in 1986/1987 the prevalence was 50% overall and 67% in those aged 45-59 (Murray et al., 1997). A survey of 104 Irish university students (Sheehan et al., 2004b) yielded a prevalence of 59%, a very high value for a young cohort. The NI samples showed a clear social class gradient, with a prevalence of 43% in social class I and 68% in social class V. Inadequate sanitation and crowded housing appear to be related to higher rates of H pylori infection (Brown, 2000).
HPV prevalence in a sample of women presenting for cervical screening in the Dublin area of RoI in 2004-2005 was reported as 19.8% (Keegan et al., 2007). No information has been published on geographical variation in infection rates in RoI. The crude prevalence of high risk HPV for women in the NI Screening programme was reported to be 18.1% in 2008 (personal communication)
Other factors
For other important aetiological factors—including UV exposure, patterns of child-bearing and use of medications such as hormone replacement therapy, oral contraceptives and non-steroidal anti-inflammatory drugs—little information is available on geographical or socio-economic variation in prevalence, and most of what exists (Boyle et al., 2010; Corcoran et al., 1996) pertains to recent periods. Information on occupational and environmental exposures is equally scanty.
A number of surveys of diet, lifestyle and physical activity have been published in RoI (Friel et al., 1999; Kelleher et al., 2003; Harrington et al., 2008; Morgan et al., 2008; Morgan et al., 2009) but contain very little information on geographical variation in risk factor prevalence other than for the largest geographical units.
¶ Information on Health and Social Services boards, provinces, health service regions, and their constituent counties and district councils, is given in Appendix table A4.1.